Supplementary Data
Metabolic engineering using iterative self-cloning to improve lipid productivity in Coccomyxa
Yuki Kasai1,2*, Takuya Tsukahara1, Fukiko Ikeda1, Yoko Ide1,2,3, and Shigeaki Harayama1,2
1
Department of Biological Sciences, Faculty of Science and Engineering, Chuo
University, Bunkyo-ku, Tokyo 112-8551, Japan 2
Research and Development Initiative, Chuo University, Bunkyo-ku, Tokyo 112-8551,
Japan 3
Present address: Advanced Research and Innovation Center, DENSO CORPORATION,
Nisshin, 470-0111, Japan
*Correspondence:
[email protected] Postal address: Department of Biological Science, Chuo University Kasuga 1-13-27, Bunkyo-ku, Tokyo 112-8551
Supplementary Tables Supplementary Table S1 — Primers used in this study Primer
Sequence (5′ to 3′)
For plasmid construction ACCGAATTCATAACTTCGTATAGCATACATTATACGAAGTTATATGCCCTCAATCGGCCGATT loxPF TTGGATCCATAACTTCGTATAATGTATGCTATACGAAGTTATTGTGCTGGTCTGTTTCCATG loxPR ATAACTTCGTATAGCATACATTATACGAAGTTATATGCCCTCAATCGGCCGATT loxPF2 ATAACTTCGTATAATGTATGCTATACGAAGTTATTGTGCTGGTCTGTTTCCATG loxPR2 ATGATTGAAGTGATTCTCAA UBLF CTAGTTGTAGTACAGCTCCA UBLR GAAGGAGATATACATATGAGCAACCTGCTGACCGTGCAC Cre_HTF GTGATGGTGGTGATGATGGTCGCCGTCCTCCAGCAGGCG Cre_HTR TTGCTTTGTGCAGCCATGTCAATGTTCAGTACAAT FAT1F GTCGACGGTATCGATTCAGTGAAGCTGCAGTTTGC FAT1R TTGCTTTGTGCAGCCATGGCAGACTCATTCTGGAGT DGAT2dF GTCGACGGTATCGATTCACACTATCTGGAGCTCCT DGAT2dR For the detection of transgenes and marker-excision event GAATTCATAACTTCGTATAGCATAC loxPF3 GGATCCATAACTTCGTATAATGTAT loxPR3 ACGGATCCGCGGCCGCTCTAGAACTAGTATGCCC RBCSPF ACAAGCTTTCGAGTGTGCTGGTCTGTTTCCATGCAG RBCSTR CTCAATCGGCCGATTTCATGCATGA RBCSPF2 GTGCTGGTCTGTTTCCATGCAGTCAT RBCSTR2 TAACGCTTACAATTTCCATTCGCCA TT4-46F CGCAATTAATGTGAGTTAGCTCACT TT4-46R5 CTTTGTACTTGTGCAACCGAGC UBLF2 TCTGAATGCGAATCTTCTCTGGG UBLR2 For RT-qPCR TTCATAGCCGCCAACCAGAC UqrtF CGCCATCAGCTCCAACAG UqrtR GACTCGCAAAACATCAGTGC TqrtF TGTTCAGCATACCCACACAC TqrtR TCAGGTTTGTGCACATGCTG FATqrtF TCAGTGAAGCTGCAGTTTGC FATqrtR TTGTTTGCAGCTGTCGTGTG DGATqrtF TGTATGCCCACCAGATATTGCC DGATqrtR GGATCAATTGGAGGGCAAGT 18SrRNAqrtF GCCCGAAATCCAACTACGAG 18SrRNAqrtR
Supplementary Table S2 — cUMPS copy numbers estimated by Southern blot and RT-qPCR analyses
Strain name M2 TT2-1 TT2-28 TT2-34 TT3-5 TT4-46 TT5-24 TT6-29 TT7-24
Copy number estimated by Southern blot 0 2 3 1 2 1 1 1 9
Copy number estimated by qPCR 0 2 3 1 2 1 1 1 8
Supplementary Table S3 — Sizes of cell and lipid body of strain Obi and its derivatives
Strain
Obi Obi Fox023 FDox037
Medium
A7 1/3 A7 1/3 A7 1/3 A7
Cell size (μm)a
Length 7.0 ± 0.7 7.8 ± 0.6 8.4 ± 0.8 8.8 ± 1.3
Width 2.0 ± 0.5 2.9 ± 0.7 3.4 ± 0.3 4.1 ± 0.5**
Total lipid droplet area (μm2/cell)a
Cell dry weight (pg/cell)b
9.8 ± 4.9 10.6 ± 6.5 15.7 ± 8.4**
13.6 ± 1.8 15.8 ± 0.6** 18.4 ± 0.7**
Strains Obi, Fox023 and FDox037 were grown for 14 days in either A7 or 1/3 A7 medium. Statistical significance of differences between strain Obi (1/3 A7) and other strains was tested by Student’s t-test (two tailed), and the results are shown as asterisks. A single asterisk indicates a P-value between 0.01 and 0.05, and two asterisks indicate P < 0.01. a The data are shown as mean ± standard deviation of 40 cells. b The data are shown as mean ± standard deviation of more than triplicates.
Supplementary Table S4 — Lipid productivity in DGAT2d-overexpressed strains
Strain
Strain Obi TT4-46 Dox262 Dox292 Dox307
Biomass concentration (g dry weight L−1) 1.76 ± 0.02 1.64 ± 0.08 1.77 ± 0.06 1.53 ± 0.05 1.58 ± 0.04
Lipid content (%)
Lipid productivity (mg L−1 d−1)
37.7 ± 0.2 37.6 ± 0.6 41.3 ± 0.4** 38.6 ± 0.3* 43.8 ± 0.3**
47.4 ± 0.4 43.9 ± 2.3 52.1 ± 2.1** 42.1 ± 1.5 49.5 ± 1.5*
The data are shown as mean ± standard deviation of more than triplicates. The biomass dry weights and lipid contents were determined 14 days after the start of the cultivation. Statistical significance of differences between strain TT4-46 and the DGAT2d-overexpressed strains was tested by Student’s t-test (two tailed), and the results are shown as asterisks. A single asterisk indicates a P-value between 0.01 and 0.05, and two asterisks indicate P < 0.01.
Supplementary Figures
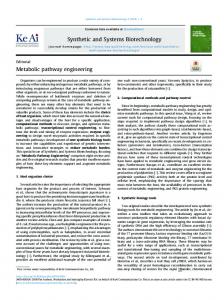
Supplementary Figure S1. The Cre/loxP system The Cre/loxP system, which is originally found in bacteriophage P1, consists of the Cre recombinase (yellow ellipses) and a pair of the 34-bp-long loxP site (red arrows) flanking an intervening gene (green line) located on a chromosome (black line). The Cre recombinase recognizes the loxP sites, and catalyzes site-specific recombination between the loxP pair. As a consequence of the recombination, the intervening gene is excised to form a circular DNA carrying a single copy of loxP, leaving a single copy of loxP on the chromosome.
Supplementary Figure S2. PCR detection of the loxP_cUMPS_loxP sequence in Ura+ transformants of strain M2 obtained with the ploxP_cUMPS plasmid
a. The map of loxP_cUMPS_loxP in the ploxP_cUMPS plasmid. The sites of primer hybridization for amplification of the loxP_cUMPS_loxP sequence are shown below the map. Abbreviations: RBCS_P, the promoter region of RBCS; RBCS_I, the first intron of RBCS; cUMPS, UMPS cDNA; RBCS_T, the terminator region of RBCS. b. Agarose gel electrophoresis of the PCR-amplified loxP_cUMPS_loxP fragments amplified from genomic DNAs. PCR screening revealed positive amplification of the intact loxP_cUMPS_loxP sequence in 40 out of 436 Ura+ transformants. Seven positive (lane #1 to 7) and one negative Ura+ transformant (lane #8) were selected to prepare this electropherogram. Lane M, DNA marker (λ-EcoT14 I digest) with molecular sizes in bp. DNA templates were: lane P, ploxP_cUMPS plasmid DNA; lane M2, genomic DNA of strain M2; lanes 1–8, genomic DNA of Ura+ transformants of strain M; and lane N, no template.
Supplementary Figure S3. Analysis of cUMPS copy number by Southern blotting in Ura+ transformants of strain M2 obtained with the ploxP_cUMPS plasmid
a. The NcoI restriction sites in the 13-kb genomic DNA region comprising the endogenous UMPS gene. b. Southern blotting of NcoI-digested genomic DNAs of indicated strains with a digoxigenin-labeled cUMPS. Lane M2, strain M2; next eight lanes, Ura+ transformants obtained with the ploxP_cUMPS plasmid whose names are indicated above the lanes; lane P, the ploxP_cUMPS plasmid.
Supplementary Figure S4. PCR analysis to detect Cre-recombinase-mediated excision of the loxP_cUMPS_loxP sequence
a. A 4.4-kb DNA fragment consisting of the loxP_cUMPS_loxP sequence flanked by partial vector sequences was shown to be integrated in the intergenic region between the gene for predicted importin-11 (IPO11) and that for translation initiation factor 3 subunit I (EIF3I). The two green boxes indicate transcribed regions, while blue boxes intergenic regions. The loxP sites are indicated by red triangles. Two arrows beneath the map denote the PCR primer set (TT4-46F and TT4-46R) used for the amplification of either a 3.6-kb fragment from genomic DNAs without the excision event or a 0.5-kb fragment from genomic DNAs which underwent Cre recombinase-mediated excision. b. Agarose gel electrophoresis of the 3.6-kb or 0.5-kb fragments amplified from genomic DNAs of indicated strains. Lane M, DNA size marker (λ-EcoT14 I digest) with molecular sizes in bp. DNA templates were: lane M2, genomic DNA of strain M2; lane TT4-46, genomic DNA of strain TT4-46; lanes 1–25, genomic DNA of 5-FOAr derivatives of strain TT4-46 isolated after intracellular delivery of Cre recombinase. c. Nucleotide sequence of chromosome region containing the loxP_cUMPS_loxP sequence integration site. Partial genomic DNA of strain Obi is shown as blue letters, partial vector DNA as black letters, loxP DNA as red letters, and cUMPS expression cassette DNA as green letters. The arrows indicate the positions and sequences of PCR primers TT4-46F and TT4-46R5. d. Nucleotide sequence of 0.5-kb PCR fragment. The color codes used are the same as those used in c.
Supplementary Figure S5. PCR detection of the cFAT1 expression cassette sequence and the loxP_cUMPS_loxP sequence in Ura+ transformants of strain M2
a. The structure of the cFAT1 expression cassette and the sizes of the PCR products (1 and 2) amplified using two different primer sets. b. Agarose gel electrophoresis analyses of PCR products (1 and 2). The cFAT1 expression cassette DNA and the loxP_cUMPS_loxP DNA were used to transform strain M2. Among 312 Ura+ transformants, eight transformants named Fox023, Fox0224, Fox0232, Fox0329, Fox0929, Fox1115, Fox1117, and Fox1120 carried intact cFAT1 expression cassette sequence, and these strains were selected to prepare this electropherogram. Panels 1 and 2 show the detection of PCR products 1 and 2,
respectively. Lane M: DNA marker (λ-EcoT14 I digest) with molecular sizes in bp. DNA templates were: lane P, pFAT1 plasmid DNA which carries the cFAT1 expression cassette; lanes 1–8, genomic DNAs of Fox023, Fox0224, Fox0232, Fox0329, Fox0929, Fox1115, Fox1117, and Fox1120. c. The partial structure of the ploxP_cUMPS _2 plasmid in which the loxP_cUMPS_loxP sequence is inserted within the UBL5 sequence. UBL5_U and UBL5_D are upstream and downstream regions, respectively, of UBL5. Primer-hybridization sites for amplification of the loxP_cUMPS_loxP sequence are shown below the map. d. Agarose gel electrophoresis analyses of 3.3-kb PCR products. Lane M, DNA marker (λ-EcoT14 I digest) with molecular sizes in bp. DNA templates were: lane P, ploxP_cUMPS_2 plasmid DNA; lanes 1–8, genomic DNAs of Fox023, Fox0224, Fox0232, Fox0329, Fox0929, Fox1115, Fox1117, and Fox1120.
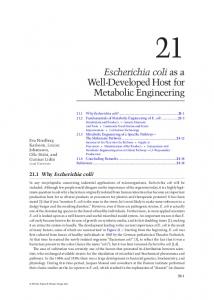
Supplementary Figure S6. Expression of cFAT1 in Ura+ transformants of strain M2
RT-qPCR detected transcripts of both endogenous FAT1 and transgenic cFAT1. 18S rRNA was used as an internal control. The data are presented as relative expression levels of FAT1 normalized to 18S rRNA expression in transgenic strains taking the expression level in strain Obi as 1. Bars represent the standard deviation of three replicates.
Supplementary Figure S7. PCR detection of the cDGAT2d-expression-cassette sequence and the loxP_cUMPS_loxP sequence in Ura+ transformants of strain −
Fox023(Ura )
a. The structure of the cDGAT2d expression cassette and the sizes of the PCR products (1 and 2) amplified using two different primer sets. b. Agarose gel electrophoresis analyses of PCR products (1 and 2). Among 263 Ura+
transformants of strain Fox023(Ura−),19 strains carried the intact cDGAT2d expression cassette. These strains were selected to prepare this electropherogram. Panels 1 and 2 show the detection of PCR products 1 and 2, respectively. Lane M, DNA marker (λ-EcoT14 I digest) with molecular sizes in bp. DNA templates were: lane P, pDGAT2d plasmid DNA; lane Fox023(Ura−), genomic DNA of strain Fox023(Ura−); lanes 1–19, genomic DNA of Ura+ transformants of strain Fox023(Ura−) carrying the intact cDGAT2d expression cassette; lane N, no template. c. The structure of the loxP_UMPS_loxP cassette flanked by the 5’ and 3’ regions of the ubiquitin-like protein 5 gene (UBL5). Primer-hybridization sites for the amplification of the loxP_cUMPS _loxP sequence are shown below the map. d. Agarose gel electrophoresis analyses of 3.3-kb PCR products amplified from genomic DNAs of indicated strains. Lane M, DNA marker (λ-EcoT14 I digest) with molecular sizes in bp. DNA templates were: lane P, ploxP_cUMPS_loxP2 plasmid DNA; lane Fox023(Ura−), strain Fox023(Ura−); lanes 1–19, the same transformants as those in b; lane N, no template.
Supplementary Figure S8. Expression of cDGAT2d in Ura+ transformants of strains Fox023(Ura−) and M2
a. RT-qPCR analysis of the expression of cDGAT2d in strains derived from strain Fox023(Ura−) b. RT-qPCR analysis of the expression of cDGAT2d in strains derived from strain from strain M2 (b). In a and b, RT-qPCR detected transcripts of both endogenous DGAT2d and transgenic
cDGAT2d. 18S rRNA was used as an internal control. The data are presented as relative expression levels of DGAT2d normalized to 18S rRNA expression in transgenic strains taking the expression level in strain Obi as 1. Bars represent the standard deviation of three replicates.