Method for the development of a functional adaptive simulation model for designing robust products Stefan Kemmler1∗ & Martin Dazer1 & Tobias Leopold2 & Bernd Bertsche1 1
Institute of Machine Components (IMA), University of Stuttgart 2
Knorr-Bremse Systeme f¨ ur Nutzfahrzeuge GmbH
Abstract Products have to ensure their function under the influence of internal and external noise factors in order to remain competitive in the current market. Therefore the step of designing robust products should be integrated in early stages of the Product Development Process (PDP). Robust products are developed using the Robust Design Method SMART (Systematic Method for Axiomatic Robustness-Testing). Thus far, SMART was applied and verified based on a simple mechanical machine element. In this paper, the method will be applied to a complex technical system. Additionally, the conflict of aiming between the high efforts and the level of detail in the creation of a simulation model are discussed. This conflict is brought about owing to the complex functionality of the design. In order to solve the conflict, an approach is given for the creation of an adjusted simulation model. Short simulation times are an advantage for the analysis of parameters regarding robustness. The adaptive simulation model discussed in this paper is based on a flexible and equation-based model, which is extended with local -structural-mechanical SUB-models for a more detailed analysis. This approach offers the option of obtaining first insights about the functionality of the product and the opportunity to complement the simulation model iteratively for the following design phases. This approach complements SMART on the one hand in the simulative design of robust design parameters and, on the other hand, in their reliability prediction in both the Parameter Design and Tolerance Design phase.
Keywords: Robust Design, SMART, Robust Design Optimization, Reliability-based Design Optimization, Taguchi Method, Axiomatic Design
∗
Contact: Dipl.-Ing. Stefan Kemmler, Institute of Machine Components (IMA), University of Stuttgart, Pfaffenwaldring 9, D-70569 Stuttgart, E-Mail:
[email protected]
1
1
Introduction
Nowadays, products are becoming more and more complex for the purpose of satisfying the steadily increasing functional requirements. Design Parameters (DP) no longer have to simply satisfy a Functional Requirement (FR), but rather need to meet several Functional Requirements (FRs) - mostly at the same time. This leads to a high level of functional density and subsequently to an increase in the degree of complexity. According to P. Milling (Milling (1981)), his definition can be used to well describe the complexity of this characteristic. He defines the complexity of a system including both an increasing number of elements as well as an increasing number of links between these elements and their functionality. This characteristic, brought about by the FRs, leads to an increased burden on the respective DPs and thus to a potentially higher probability of failure. This additional strain has to be taken into account in the structuring of the DPs at an early phase in the Product Development Process (PDP). The Systematic Method for Axiomatic Robustness-Testing (SMART) - according to Kemmler and Bertsche (2014b) - takes this aspect into account at an early phase in the product development. The method takes into account that complexity at the draft phase, with the objective of creating a nearly Decoupled Design, but optimally an Encoupled Design. SMART is oriented towards the Robust Design Method, Axiomatic Design (AD), according to Suh (Suh (2001)). Furthermore, SMART pursues the merging of the two basis ideas of Robust Design according to Taguchi with the System Design (SD), Parameter Design (PD) and Tolerance Design (TD) development phases and with the reliability of having the objective of demonstrating a structured order in the early PDP for the design of robust and reliable products. Besides a reduction in the complexity used in SD, SMART also puts significant emphasis on the implementation of a suitable simulation strategy, which is used for the introduction of validated simulation models in PD and TD for parameter studies. This simulation strategy should prove helpful when parameter simulations are carried out in order to define the robust design and predict the reliability. Here, the focus needs to be centred on the creation of a functionally adaptive simulation model that must satisfy the criteria involved both for shorter computing times (ideal case: “real time simulation“), flexibility in the expansion options, parameter diversity as well as user flexibility. This paper presents a simulation strategy that will satisfy these demands and will show how a functionally adaptive simulation model can be created and applied.
2
Systematic Method for Axiomatic RobustnessTesting (SMART)
A subtarget of SMART is implementing (at an early phase in the product development) parameter studies for the sensitivity analysis, optimization systems and robustness analyses, thereby defining nominally robust adjustment levels in the PD and the related diversification limits in the TD. SMART is oriented chronologically towards PEP in accordance with the VDI 2221 (VDI (1993)) Guideline, and classifies the three phases used in offline quality control, SD, PD and TD, according to Taguchi (Taguchi, G. et al. (2005)). In addition, the
11. Weimar Optimization and Stochastic Days – 6.-7. November 2014
2
sample phases common today in the automotive industry (Hab and Wagner (2013)) are supplemented in order to improve how the methods are classified (Kemmler and Bertsche (2014b)); see Figure 1. S
M
A
R
T
A-Sample B-Sample CLARIFICATION OF THE TASK
Define user requirements specifications Define functional specifications
CONCEPTUAL DESIGN
Identify functions and structures Search for solution principles Assess solutions and choose one
DETAILED DESIGN
EMBODIMENT DESIGN
Rough design of the components Create overall design Simulation & calculation
Create detailed overall design Produce and test prototypes Run pilot series
Figure 1: Classification of SMART in PDP (Kemmler and Bertsche (2014b)). The three phases, SD, PD and TD - see Figure 2 - are integrated in SMART as iterative loops that need to be run through several times depending on the individual problem at hand. If possible, a Decoupled Design should be available at the end of the SD phase in accordance with AD understanding. If the draft satisfies the requirements, then the P-diagram ((Fowlkes and Creveling (1995)) can be used to enter into the PD phase. In the PD phase, the objective is to stipulate the nominally robust adjustment levels of the DPs using a suitable simulation strategy. This can be done, for instance, using the three classic steps of sensitivity analysis, optimization and robustness analysis. Depending on the simulation effort involved, it may be noted at this juncture that these steps can be carried out in accordance with dynamic sampling or in accordance with a suitable Design of Experiment (DoE). The procedure for the method according to Taguchi provides the option of carrying out the internal and external experimental design in accordance with various DoEs. In doing so, the control factors are allocated to the internal field and the problem variables to the external field in accordance with the P-diagram. By reason of the very nature of highly mixed Taguchi experimental designs, the internal DoE should, where possible, be carried out in accordance with factorial DoEs constituting a higher level of resolution. By contrast, the external field can be done in accordance with orthogonal DoEs. The objective, and thus the exit from the PD phase, is the projection of reliability in terms of random failures and tiredness. Depending on the target function considered, a robust design may sometimes be able to be defined, but not a reliable design in accordance with the criteria for the set lifetime (Kemmler and Bertsche (2014a)). A second loop should be run through in that case, by determining new, robust DPs which correspond with the criterion for reliability. Should such a design be found, then it is now possible to go through to the TD phase with the tolerance analysis. The actual tolerance limits of the DPs are then defined in the TD phase, whilst taking the 11. Weimar Optimization and Stochastic Days – 6.-7. November 2014
3
Is the reorganization of the transfer matrix possible?
Reorganization of the transfer matrix Application of the independence axiom
Is the transfer matrix satisfactory?
Are there several drafts and thus transfer Matrices available?
Set up of the transfer matrix [A]
Comparison on the basis of the information axiom Redefining the Design Parameter (for draft part concerned)
Application of the information axiom
Introduction of new draft levels that remove the couplings
Is the information satisfactory?
Defining the functional requirements and design parameters from the customer requirements determined
Design of Experiment
Carrying out the experiment Analysing the experiment
Setting up the P-diagram Is the draft already available?
Starting the contemplation of the system
Are the optimum nominal values for the Design parameter known?
Axiomatic Design to disclose any draft errors that may have occurred, and to remedy them
Optimization possible?
Technical Feasibility possible?
Was the confirmation experiment successful?
Main workflow Tolerance analysis
1. Loop
customer requirements
2. Loop
Optimizing the draft on the basis of the results
functional tolerances
Yes
Determination of the predicted reliability
No
Was the confirmation experiment successful?
Tolerance synthesis based on the planned process capability
Carrying out the confirmation experiment
Variance decomposition
Technical feasibility possible? Optimization of tolerance costs using weighting factors
Design of Experiment Set up Quality Loss Function
Analysis using statistical methods
Robustness criteria satisfies?
Best possible costs?
Limit sample test
Determining the reliability
Recommending the steps of action
Figure 2: SMART according to Kemmler and Bertsche (2014b). 11. Weimar Optimization and Stochastic Days – 6.-7. November 2014
4
manufacture, the process capability and the production costs into account. These aspects are used to supplement and extend the original simulation strategy. The diversification of the target function will also be determined considering the previously mentioned diversification of the DPs and under the influence of the external problem variables. If a robust design on the basis of the tolerance synthesis is not available, then new variances for the DPs will have to be determined with the aid of variance decomposition and converted to the tolerance limits of those DPs. However, should a robust design be available, a design at optimum costs will be defined together with the cost aspect taking the manufacturing costs into account. In case neither the robust design nor the best possible design costs is available, then a loop through the TD phase will have to be performed again. Where both the robust design and best possible design costs are available, the TD phase can be left and one can commence with the limit sample and the appropriate test strategy for determining the reliability. In conclusion, steps of action are given in regard of implementing both the robust and reliable design.
3
Simulation strategy
An adaptive simulation model constituting the basis of a flexibly designed and equationbased SMART simulation model (SIM-SMART) is going to be developed in order to satisfy the described criteria for the suitable simulation model in Chapter 1. This model is going to be expanded locally by structural-mechanical SUB models for more detailed analyses. This procedure complements SMART on the one hand by the simulative design of robust DPs and, on the other, by its reliability predictions, both in the PD as well as in the TD phase. In the first step of the sensitivity analysis in the PD phase, the parameters used in the system are both identified and classified to conform with SMART, and recorded in a global P-diagram. There may be DPs among the identified DPs that can only be calculated using an FE simulation, for instance temperature or wear influences. Owing to the high degree of product complexity, it is only possible to implement a comprehensive FE simulation with considerable time and effort. Huge capacities are required to calculate the relevant simulations. This is how the limitations of practicability are quickly reached, both from a technical and economical point of view. By contrast, short computing times are an advantage for the optimization systems and for the robustness analyses, owing to iteration loops that can potentially be carried out. A simulation strategy that takes into account the conflict of objective in terms of the high level of expense for creating the model (due to the functional complexity and degree of detail) subsequently needs to be defined. This is going to be described using a procedure for designing a customized simulation model. Against this backdrop, an intelligent and functionally adaptive simulation strategy needs to be developed. The basis of the simulation strategy if formed by a one-dimensional (1-D) analytical basic model that is divided up into relevant SUB models. This complex overall system should be divided up in accordance with functional viewpoints. Care should also be taken in ensuring that the correctly functioning cause-effect relationships in the material flow, the force flow and the energy flow are maintained in the system. In the next step, a decision can be made on which SUB models are to be analysed more closely on the basis of the
11. Weimar Optimization and Stochastic Days – 6.-7. November 2014
5
allocation of the parameters to the SUB models and the relevant operating modes. SUB models having a high functional share in the overall system can now be analysed in accordance with the newly set local limits. Suitable META models, which are, in turn, implemented in SIM-SMART, are produced from the results of these analyses. From this, insights can be gained in terms of the global optimization variable. META models have an analytical basis and therefore require low computing capacities. This is why within the framework of Simultaneous Engineering there is still the option of optimizing single META models specifically. These results can also be integrated in SIM-SMART after optimization (in order to carry out confirmation tests on the overall system).
3.1
Description of application example
Heavy goods vehicles (HGV) in Europe are nowadays fitted almost exclusively with compressed-air operated disc brakes (Breuer and Bill (2012)). The following chapters describe both an example of use including the working principle of the service brake as well as the adjusting unit function. 3.1.1
Design and working principle of the service brake
The service brake is a typical build with inside leverage and a coaxially installed brake cylinder, see Figure 3. When the brake is actuated, the force generated by the brake cylinder is transferred to the eccentrically mounted lever (1). Here, the transmission ratio can be found in a range between 10:1 and 18:1 and is used for strengthening the brake power. The lever transfers this force onto the screwed-in threaded spindles (3) with their seals (4) via bridge (2) and then onto the brake pad (5). This, in turn, moves against the brake disc (6), and the braking effect comes into being (Breuer and Bill (2012)). As a rule, there needs to be a defined clearance between the brake disc (6) und brake pad (5) in order to prevent the brakes from constantly grinding when the vehicle is being driven. That clearance must be calculated such that any wobble in the brake disc (6) does not lead to contact being made, thus resulting in irregular wear. It also needs to be adequately protected against any thermal expansion in the components. If the clearance is too small, the brake may overheat due to permanent contact being made, which can lead to failure. A clearance that is too large will reduce the braking effect. The clearance has to be calculated such that all possible operating conditions in the vehicle are safeguarded. For compressed-air operated disc brakes, ranges between 0.5 to 1.1 mm are normal (Breuer and Bill (2012)). The brake pads (5) are subject to continuous wear, meaning that the clearance would become increasingly larger. To avoid this happening, an automatic wear adjuster is installed that is supposed to keep the clearance at a constant level. The adjuster and the complete brake unit are installed in the brake calliper, see Figure 3. 3.1.2
Design and function of the adjusting unit
The basic working principle of an adjusting unit in line with the market is the same, despite various designs. The active adjusting process only occurs when the brake is in idle 11. Weimar Optimization and Stochastic Days – 6.-7. November 2014
6
6
5
2
1
4
3
Figure 3: Service brake (Breuer and Bill (2012)). stroke, which means when there is no contact between the brake pad and brake disc. All adjusting movements will be stopped as soon as the brake force starts taking effect on the brake disc via the threaded spindles and the brake pads. The drive for the adjusting movement is produced by the lever, and this is coupled with the adjuster via a rigid connection for that purpose. The brake lever always travels in a defined way - without an adjustment taking place - each time the brake is applied. The driving movement of the lever does not have an effect on the adjuster until this empty run has taken place. An input torque is then initiated. The defined idle stroke is called constructive play and significantly determines the clearance being set. This is realized by means of precise geometrical occurrences on the adjuster. The amount adjusted when the brake is pressed (hN ) is proportional both to the difference arising from the idle stroke (hidle ) and constructive play (skl ), which is known as overtravel, as well as to an adjustment factor for the brake (fN ) - see Equation 1. The adjustment factor represents an important quality criterion for an adjusting unit. It constitutes a measurement for the speed at which excessive clearance is able to be corrected using the number of brake applications; see Figure 5. hN = fN (hidle − skl )
(1)
The function of the adjuster comprises the implementation of five operating modes: 1. Negotiating constructive play 2. Adjusting 3. Overload - decoupling 4. Back-twist movement - starting position 5. Service function 11. Weimar Optimization and Stochastic Days – 6.-7. November 2014
7
Taking the first four operating modes as a basis, the function of the adjuster is shown in the following. The service function in operating mode 5 is available for allowing manual screwing back. This is necessary when the brake is being serviced. Servicing operations are only applicable outside the regular use of the product and are therefore not relevant for the targeted value being examined.
2
1
3
6
4
5
Figure 4: Automatic wear adjuster (Breuer and Bill (2012)). At the start of the brake application, the lever (1) initiates a movement via the shift fork (2), see Figure 4. An idle stroke is executed until the constructive play has been negotiated. This means that operating mode 1 has finished already. After that, the input torque, which is passed on to the threaded spindles (5) by freewheel (3) and overload coupling (4) - is initiated in the adjuster via the swivel stroke of the lever. The turning movement in the threaded spindles corrects an excessive clearance. The adjusting movement takes place for as long as it takes until the brake pad is resting against the disc. This means that a resistive torque (that stops the adjusting movement) is built up. Operating mode 3 starts at this point. As a result of the resistive torque, the threaded spindles can no longer turn and the adjustment will stop. The lever (1), by contrast, initiates a driving movement in the adjuster just the same as before. The system therefore needs to be decoupled from the turning movement, which is realized by the overload coupling (4). The torque is only transmitted up to a specific limit value. If the initiated torque has a higher value, the system will be decoupled in a translatory axial movement. In operating mode 4, the brake is released and thus the driving movement vice versa. It is necessary to prevent the threaded spindles (5) from also screwing back, since otherwise the clearance would become larger again. The freewheel (3) allows this function to happen. In the direction of drive, it is disabled owing to geometrical occurrences, whilst it remains open for the reversal of the movement. This makes sure that the threaded spindles (5) 11. Weimar Optimization and Stochastic Days – 6.-7. November 2014
8
skl
hidle
1,0
0 0
20
40 60 80 100 120 140 160 180 200 Number of brake actuations [-]
20
40
Clearance [mm] 4,0
3,0
hN
2,0
skl
hidle
1,0
0 0
60
80 100 120 140 160 180 200 Number of brake actuations [-]
Figure 5: Adjustment speed according to Breuer and Bill (2012). do not screw back, but rather are only moved back translationally with the bridge (6). The bridge path exactly matches the constructive play if the set clearance is correct. In that case, the complete driving movement will be absorbed by the overload coupling (4), because the threaded spindles (5) already have the resistive torque applied to them before drive is initiated in the adjuster. The essential characteristics of the adjuster combine the freewheel (3) and the overload coupling (4). These mainly carry the overall function of the adjusting unit. The main characteristic of the freewheel (3) is its monotonic transmission of the driving movement. The main function of the overload coupling (4) is the decoupling of the turning movement in an axial movement so that the high forces induced can be compensated.
3.2
Adaptive simulation model SIM-SMART
The basic prerequisite for an adaptive simulation model is a correctly functioning system analysis on the basis of cause-effect relationships. For this purpose, the AD method applied in SMART System Design can prove supportive. Consideration of the torque used in the individual operating modes is particularly suitable for the example at hand. The reason for this is the varying demands on the product for each operating mode. For instance, a different torque range to that used in the Overload operating mode is required during the adjustment process. Consequently, an entire torque range in the form of one torque curve can be determined for all succeeding operating modes. In addition, the correctly functioning cause-effect relationship continues to be guaranteed in this approach. A decision is then made as to which SUB models are to be analysed in more detail. The decision is made in accordance with the P-diagram or in accordance with the parameter allocation to the individual SUB models. One SUB model here matches a specific operating mode; see Figure 6. A defined set of parameters can be fixed for each SUB model. This allows 11. Weimar Optimization and Stochastic Days – 6.-7. November 2014
9
CF NF the individual parameters to be viewed either separately or locally. An increase in wear ϕKL Geometrie M = const. M in (ϕ) the torque than sLüft, neu brings about a different in the overload coupling, for instance, increase Spiele ϕN (sLüft, alt) Kräfte M (ϕ) |M |(ϕ) M1 / 2 / 3 an increase in ϕ wear in the adjustment torque. The operating modes mentioned are the M (ϕ) M = const. µ-Werte first four operating phases as per Chapter 3.1.2 and are shown in series in Figure 6. 1
Φ
SUBMODEL 1 MStart - Forwards CF NF Control Factors
ΦKL
SUBMODEL 2 MAdjust
ΦN
4
3
5
SUBMODEL 3 MOverload
- Adjust CF NF
4
2
- Overload CF NF
Φmax
SUBMODEL 4 MBack
Φ
- Backwards CF NF
Noise Factors
Konstruktives Figure 6:Lüftspiel MethodologyNachstellen used for simulation creation in SIM-SMART. Überlast Rückstellen überwinden
1 φ(M ) SUBSYSTEM SUBSYSTEM 3 2 4 The rotatary SUBSYSTEM movement is the input and control variable forSUBSYSTEM the purpose of simu|M |< M M > M is recorded M > M ϕKL ϕ ϕ ϕ ϕ M >respective M max lation. The torque accordingly inN the SUB model. The individual M > M M > M operating modes or SUB models follow a defined angle φ in series. For instance, the Ad” just “operating mode is not applied until the constructive play has been negotiated. This point in time is identified with angle φkl . After this, the adjustment is made for as long as it takes until the pads touch the discs. This point in time is defined as adjustment angle φN . The Overload “operating mode comes about as a result of the high contact force and ” owing to the immediate and greatly rising resistive torque on the adjuster. This operating mode remains active for as long as it takes until the braking phase has ended. This point in time is identified as φmax . After that, the adjuster is turned back to its home position by the lever. The SUB models can be built up after the simulation strategy has been determined using the individual operating modes. Here, the focus is put on the components involved in each operating mode that have an influence on the torque curve. The first simplification causes an initial shortening of the simulation time. A further benefit of this type of dividing up is that the respective SUB model can be worked on at the same time. In addition, the individual SUB model can be supplemented and expanded relatively quickly depending on the required changes to the product. The basis and merging of the SUB models constitutes the 1-D simulation model, SIMSMART; see Figure 7. The basis is the 1-D SIM-SMART built into MATLAB SimMechanics. All information is both pooled and processed in this model. The basis is an analytical model created at the start which can be used to directly describe changes such as the diameter and friction coefficient, and to record the resultant torque curve. Parameters such as temperature or tribological analyses cannot be explicitly described in this model. As a consequence, such parameters are to be simulated in an FE model and transferred over to the respective SUB model using optiSLang. The procedure has three different steps. In the first step, the META model (system equation) is built up in the FE environment (ANSYS) and the corresponding parameters defined. A Design of Experiment (DoE) is performed in the second step using optiSLang as an aid. This DoE is used to model a system equation (META model of optimal Prognosis – MOP). If the MOP is given a satisfactory model adjustment (Coefficient of Prognosis – CoP), then it can be integrated 1
Passscheibe
2
Kopfreib
3
4
Rampe/Überlast
4
Druckfeder
5
11. Weimar Optimization and Stochastic Days – 6.-7. November 2014
Druckfeder Freilauf
10
in SIM-SMART. MOP-Solver from optiSLang is used for that purpose in MATLAB. Its request for any parameter settings can be used to return the corresponding torque curve from the parameter range. The entry is made by means of the relevant GUI. STEP 1: SUB model X modeling META model simulation Target: Behaviour of input- and output-parameters
ANSYS
Variable A Temperature
FE model
Fitting Curve
FIT Parameterindentification of the 1D model
Variable B Variable C
Wear
Variable D
SUB X
Diameter
Coefficient of friction
META model (MOP) Response Surface Variable D
Variable C
Variable B
Variable A
Variable / parameter in 1D model
Wear
META model (MOP) Response Surface
optiSLang
Temperature
STEP 2: META model (MOP) modeling with optiSLang Target: continuous correlation
STEP 3: META model (MOP) integration Interaction between the models Parameter variation / tolerance analyse
Direct parameters
SIM-SMART (BASIS model) (1D model with GUI)
Figure 7: Methodology used for simulation modelling in SIM-SMART.
3.3
META model using the overload coupling as an example
To develop a META model, the simulation strategy first has to be adjusted, since individual SUB models no longer have a global effect-relationship. Furthermore, the system limits need to be transferred over from a global consideration to the appropriate local view. Only components can be found within the new local system limits which are of fundamental importance for fulfilling the local functions. In the specific application of the overload coupling, this involves both a hub (1) and a flange ring (2) as well as rotationally symmetric ball bearings (3) that transmit the torque through their contact properties, see Figure 8. In correct operation, the ball bearings transmit the torque (up to a defined limit value) from the hub (1) to the flange ring (2). In the case of overload, the hub and flange ring turn relatively to one another, which presses the ball bearings out of their engagement points. In this state, a torque is not able to be transmitted. The turning movement is decoupled in a translatory axial movement owing to the overload function. The adapted simulation strategy can be seen in an adjustment of the P-diagram, which is defined according to the recently selected local system limits, see Figure 9. When the 11. Weimar Optimization and Stochastic Days – 6.-7. November 2014
11
global P-diagram has been submitted, targeted values (dimension of robustness) and correcting variables need to be defined together with the control variables being analysed and the problem variables. The target function going to be optimized first needs to be defined. This is defined analogously to the global strategy as the torque curve for the overload torque. The movement or torque is induced on the hub of the overload coupling via the brake lever. 1
3
2
Figure 8: Overload coupling. Without this occurrence, the function will not be able to be met and there would be no effect. The induced movement thus constitutes the first correcting variable. Moreover, a point in time that defines the opening of the overload coupling is needed. This is specifically attained in the adjuster via the induced resistive torque. This can be understood as the point in time at which the overload coupling starts to open. This point in time is accurately defined by the old clearance present in the previous stroke in the adjuster. This means that one can determine exactly how much needs to be adjusted and also, therefore, the point in time when the overload coupling is opened. The old clearance thus constitutes the second correcting variable to complete the cause-effect relationship of the overload coupling. As control variables, the geometry parameters are used in the roll-off path for the contact ball bearings. These parameters can be varied as desired within specific areas. Problem variables constitute, on the one hand, non-changeable parameters such as temperature, tribological effects and fluctuations in the material properties. On the other hand, parameters not inside the system limit of the overload coupling, but still having an effect on the function, are also introduced as a problem variable. This specifically involves the compression spring, which exerts a normal force on the overload coupling owing to its pretensioning. Overload torques that are either too great or too low will lead to a malfunction and must be avoided. As part of an optiSLang sensitivity analysis, various design points are calculated and assessed using discrete Latin hypercube sampling. All parameters are equally treated, since they represent an action for the targeted value which is going to be examined. These actions are determined by the correlations in the system produced from the evaluation of the sensitivity analysis. All analysed parameters are transferred to SIM-SMART after the META model has been created, in that they are evaluated using various combinations in the overall system. Against this backdrop, a strict separation of the parameters in control 11. Weimar Optimization and Stochastic Days – 6.-7. November 2014
12
Control Factors Tolerances Geometry-Parameter Flanschring, Nabe und Kugeln
Error States Higher Overload Lower Overload
Noise Factors Wear / Coefficient of Friction Temperature Material-Properties Compression Spring
Signal Factors
Overload-Clutch
Rotation-Load Clearance (sold) Control Factors
Tolerances Geometry-Parameter flange ring, hub and ball bearings
Ideal Function Robustness-Value M Overload
Error States Higher Overload Lower Overload
Figure 9: P-diagram of the overload coupling. variables or problem variables does not take place. However, the classified parameters are required for the further optimization and robustness analysis. In addition, the global P-diagram is supplemented or extended by the local P-diagram. In order to make the emergence of the results shown in the further process clear, there now follows a brief introduction in the statistical evaluation methods. The following sections are based on references Most and Will (2008) and Most and Will (2011). 3.3.1
Moving Least Squares Approximation (MLS)
The MLS approach has the advantage that simply the weighting factor and the local polynomial coefficients need to be calculated at each point, which makes this approach a quick one in comparison with other approximation methods. Position dependent weighting functions are introduced in order to achieve a local character of the regression function. The basic function can accept every order, whereby usually it is linear and quadratic terms that are used. The approximation function is: Y (x) = pT (x) · a(x) .
(2)
It contains moving coefficients a(x). The further developed approximation function is: Y (x) = pT (x)(P T W (x)P )−1 · P T W (x) · y .
(3)
Matrix W (x) contains the weighting values for each design point. 3.3.2
Coeffient of Prognosis
The Coefficient of Prognosis (CoP) is an independent measurement to evaluate the quality of the model. The CoP is defined as: CoP = 1 −
SSEEP rediction . SST
11. Weimar Optimization and Stochastic Days – 6.-7. November 2014
(4)
13
10.0 5.0
Supports D=0.3 D=2.0 D=5.0
0.0 -5.0 1.0
1.5
2.0
2.5
3.0
3.5
4.0
4
Figure 3: Local weighting support point (left) and influence of the influ Figure 10: Local weighting of the design of points (Most andvalues Will (2011)). radius D on the smoothing of the MLS approximation function (right)
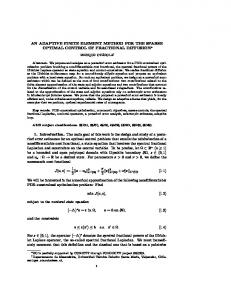
Explained variation
SSEEP rediction is defined as the sum of all least squares. SST describes this as the sum, over 5.2 Coefficient of each Prognosis all observations, of the squared differences of observation from the overall mean. The CoP offers benefits in terms of precision convergence behaviour when set against and Willand 2008) a model independent measure to assessthe the model quality In (Most Coefficient of Determination (CoD). The CoD is used for model evaluation on the basis of proposed. This measure is the Coefficient of Prognosis (CoP), whicha is defined as fo polynomial regression. Figure 11 shows convergence behaviour for an approximation in an P rediction example. It is evident here that the CoP does not overestimate theSSvariation E ,in the event CoP = 1 − SST behaviour for of a low number of samples like the CoD does. Furthermore, the convergence the approximation quality is significantly better when only the most important variables where SSEP rediction is the sum of squared prediction errors. These errors are estim are used. based on cross validation. In the cross validation procedure, the set of support poi mapped to q subsets. Then the approximation model is built by removing subset i 1.00support points and approximating the subset model output y˜j using the rema the point set. This means that the model quality is estimated only at these points, whic 0.90 not used to build the approximation model. Since the prediction error is used inste the 0.80fit, this approach applies to regression and even interpolation models. The evaluation of the cross validation subsets, which are usually between 5 an 0.70 sets, causes additional numerical effort in order to calculate the CoP. Nevertheles polynomial regression and Moving Least Squares, this additional effort is still quite 0.60 CoD quad CoD quad since no complex training algorithm is required. For other meta-modeling appro adj 0.50 CoP MLS as neural networks, Kriging and5Var even Support Vector Regression, the time consu CoP MLS 3Var training algorithm has to be performed for every subset combination. 0.40 25 50 the 100 200 of the 500 CoP values of an MLS approximation o 4, convergence In Figure nonlinear coupled Number functionofgiven in Equation 12 is shown in comparison to the polyn samples CoD. The figure indicates that the CoP values are not over-estimating the approxim themeasure CoD does a small of samples. The influence radius o Figure 4: Convergencequality of the as CoP byfor using MLSnumber approximation compared to Figure 11: Convergence of the CoP on the basis of MLS when compared to CoD on the MLS approximation is found by maximizing the CoP measure. As shown in Figu the polynomial CoD measure basis of polynomial regression (Most and (2011)). the convergence of Will the approximation quality is much better if only the three impo variables are used in the approximation model. Metamodel of Optimal Prognosis (MOP) proposed in (Most and Will 2008) which is based on the search for the optimal input variable set and the most appropriate approximation 3.3.3 Metamodelorof Optimal Prognosis 5.3 Metamodel of Optimal Prognosis model (polynomial MLS with linear or quadratic basis). Due to the model independence and objectivity of the the quality CoP measure, it is well section, suited compare different in As already shown, of in the can be to improved if the insignificant variables As shown theprognosis previous the prediction quality of anmodels approximation model m theeliminated. different subspaces. In Figure 5, the CoP values of all possible subspaces and all are This approach is pursued further in the Meta model of Optimal Prognosis improved if unimportant variables are removed from the model. This idea is adopted i (MOP). It is based on the search for the optimal structure of the input variables in terms of t of Prognosis
1.00
Weimar Optimization and Stochastic Days
11. Weimar Optimization and Stochastic Days – 6.-7. November 2014 0.80
0.60
8.0 – November 24–25, 2011 14
8
their significance and in terms of the most suitable approximation model on a polynomial or MLS basis. It is very well suited for comparing various models in various sub-areas when using the model-independent and objective CoP method as an aid. An approximation model containing the most sensitive parameters is produced as a result of the MOP. The significance of a parameter results from its CoP and the sensitivity index whose effect is estimated from the approximation model. CoP (xi ) = CoP · STM OP (xi )
(5)
Furthermore, this can be used to estimate the effect of interactions within the input parameters. If the sum of all CoPs for the parameters is significantly higher than the CoP for the overall model, then the interactions have a significant effect. The result of the MOP can be shown in a two- or three-dimensional response area, which helps the user to interpret the result. The response area displays both the sampled design points as well as the approximated effects of one or two parameters to the targeted value. 3.3.4
Results of the sensitivity analysis
In the first step, Latin hypercube sampling in optiSLang was carried out using an FE model for the overload coupling. The values for the parameters were specified discretely here. This was to make sure that parameter limits are also included in the sampling. The model quality used in the system is evaluated using the CoP method. The CoP of the overall model reaches a value of 94 %. The sum of the individual CoP values for the parameters does not exceed the total value of the CoP; as a consequence, there are no interactions in the META model. It may be noted here that the META model takes all parameters used in the sensitivity analysis into account. If, at this point, only the most important parameters were also to be integrated for the META model, then the CoP rises to approx. 99 %. The reason for this compromise is the later application of SIM-SMART. Among other things, the objective is in making a simulation tool available to the developer which allows him/her to take into account all parameter values in SIM-SMART. In a global context, there are also parameter combinations from the individual META models which can bring about interactions in SIM-SMART, but have little impact in the META models. This guarantees a holistic view of the simulation model. A target value in optiSLang can only be set to a single value that represents in this case the overload torque. Accordingly the META model is created and evaluated only for those defined target value. However, in order to obtain the torque curve, the angle of rotation has to be introduced as an additional input parameter. The calculated torque curves are exported from the FEM software ANSYS. Thus, with the aid of the rotation angle as a running variable, there is a torque curve for every sampled parameter combination available. From these data another META model is created with optiSLang, which describes the correlations of the parameter concerning to the torque curve. This META model comprises a CoP-value of 99 % and is represented for one DP in Figure 12. Due to mathematical limitations, a perfect model, as seen in Figure 12 can’t be generated, when all 16 parameters (16 dimensions) are integrated in the model. To get the best possible META model, three different approximation methods Polynomial regression (PNR), Classic MLS 11. Weimar Optimization and Stochastic Days – 6.-7. November 2014
15
regression (MLS CL) and Interpolating MLS regression (MLS INT) will be compared. It may be noted that the torque curve is neglected from a rotation angle of 15◦ because the posterior part of the torque curve is not relevant for SIM-SMART. Furthermore, the approximation ratio is generally higher. The appraisal process takes place in two stages. The first step involves evaluating the deviation of the models to a discrete sampled design point (D1) and in the second stage the models will be compared to a design that was not sampled yet (D2). According to Hyndman and Koehler (2006) the root mean squared error (RMSE) is used as an evaluation criterion, see Equation 6. In addition, a subjective evaluation is conducted, which manifests itself in how well certain areas of the torque curves are approximated by the regression method. s Pn yt − yt )2 t=1 (ˆ (6) RM SE = n The results for D1 are shown in Table 1 and Figure 13. The interpolation based on MLS detects the data of the FE model almost exactly which is reflected in a very low RMSE. The approximation ratio of MLS CL is higher than PNR. The PNR follows a parabolic shape, therefore it over- or underestimated the overload torque in many sections, especially the range between 13-15◦ . The MLS CL has an acceptable approximation ratio with an average deviation of about 8 %, referring to the average overload torque. Nevertheless, for D1 MLS INT is to be preferred, because it reproduces the FE-Model with almost 0 % deviation. The results for the comparison of regression methods for D2 are shown in Figure 13. It will be seen that the approximation with the PNR and MLS CL is more successful than with MLS INT. The interpolation overestimates the overload torque in the range of increase then flattens to strongly and is at the end of the curve in turn too large. A RMSE of 1488.6 N mm confirms the inaccurate approximation of the MLS INT, see Table 1. The Reason is the linear function approach of the MLS INT which makes it almost impossible to model highly non linear target functions in a high dimension with sufficiently small error. PNR and MLS CL also use quadratic function approaches. Thus, the approximation is generally better than MLS INT. It may be noted that the MLS INT regression almost exactly reproduces the discreet designs, but due to poor detection of the non-sampled designs by regression, it can not be used. For this problem MLS CL was identified as the best approximation method. It may be noted, that this result can not be applied to other problems without problem oriented studies. As seen in Figure 13 the MLS CL approximates the rise and the rear reagion of the torque curve very well. In the intermediate section the overload torque is underestimated, thereby increasing the mean error. To prevent such a deviation, the curve and thus the META model is devided at a rotation angle of 3.4◦ , see Figure 14. With this approach, the underestimation in the transition region is selectively eliminated because not the entire curve has to be included in one model. This is also relfected in a reduction of the RMSE, which is significantly lower. The RMSE for the devided META-Modell is about 255 N mm for D1 and 205 Nmm for D2, which results in a average deviation of 3 %. In this approach MLS CL is still the best approximation method. With the aid of the developed model, the correlations can be represented in 16 dimensions.
11. Weimar Optimization and Stochastic Days – 6.-7. November 2014
16
The torque curve can be calculated for every parameter combination that is located in the permissible parameter space.
Table 1: RMSE of D1 and D2 RMSE
D1 [N mm]
D2 [N mm]
PNR
918.7
823.9
MLS CL
510.9
491.1
MLS INT
4.8
1488.6
Standardized overload torque
100
80
60
40
20
0 5 15
1
5
2
5 3
15 4
5
25
6
35 7
45
Figure 12: Meta model for one DP.
3.4
Transfer to SIM-SMART
The other META models are created analogous to the procedure described for creating the META model for the overload coupling. Care should be taken to ensure that the respective local requirements to be met by the SUB models are adapted accordingly in the P-diagram. After all META models have been created, they can be transferred over to the individual SUB models in SIM-SMART; see Figure 7 in Chapter 3.2. Afterwards, the input 11. Weimar Optimization and Stochastic Days – 6.-7. November 2014
17
Approximation methods for D1 Standardized overload torque
100 90 80 70 60 50 40 30 20 10 0
0
3
6 9 Rotation angle [°]
FE-Model / MLS INT
12
MLS CL
15
PNR
Approximation methods for D2 Standardized overload torque
100 90 80 70 60 50 40 30 20 10
0 0
3
FE-Model
6 9 Rotation angle [°] MLS CL
PNR
12
15
MLS INT
Figure 13: META model Overload Clutch.
11. Weimar Optimization and Stochastic Days – 6.-7. November 2014
18
60 40
Standardized overload torque
80
110
100
90
80
Standardized overload torque
100
20 20 0
21 22
2,2
2,6
3
14
20
3,4
10
21 22
6
Figure 14: Devided META model. parameters in MATLAB need to linked with the parameters in the META model or with the MOP-Solver. When all META models are integrated in SIM-SMART, they can be combined with one another. This is done by the developer defining in the GUI the parameters needing to be analysed. After that, the relevant parameters are transferred to the MOP-Solver and thus to the respective META model. For the corresponding parameters, the relevant torque curve is returned to SIM-SMART from the META model. The respective torque curves Mφ are merged in series using the defined boundary conditions for the critical angles φn as per Figure 6 in Chapter 3.2. For the defined angles φn , torque Mn is recorded in the individual torque curve Mφn and linked to the appropriately equal torque level Mn+1 in the next torque curve Mφn+1 ; Mn (φn ) = Mn+1 (φn+1 )
(7)
if angle φ is continued, see Figure 15. This continues the entire torque curve Mφ . This takes place analogously for the other SUB models, until the entire adjusting process (icycle) has finished. This process is done i times until a consistent clearance is produced as per Figure 5.
4
Discussion and summary
A correctly functioning system analysis in the form of cause-effect relationships is essential for the development of complex simulation models. A simulation strategy can be designed using this system description, by having the individual operating modes in SUB models classified with the same cause-effect relationship. In the example shown for the adjusting unit for a disc brake, the torque curve can be used to define a global simulation strategy and to classify the individual operating modes into four SUB models. The first simplification allows, on the one hand, the META models to be worked on and developed at the
11. Weimar Optimization and Stochastic Days – 6.-7. November 2014
19
FEModel
SUBMODEL 1
SUBMODEL 2
SUBMODEL 3
SUBMODEL 4
- Forwards -
- Adjust -
- Overload -
- Backwards -
M
M ϑ
METAModel µ
M ϑ
µ
Φ
M
ϑ µ
Φ
M
M
SIMSMART
M
+
+ Φ
Φ
Φ
= Φ
. . Φ
Figure 15: Transferring the META models over to SIM-SMART. same time, and on the other, it allows saving on simulation time. When defining the discrete sampling, care must be taken to ensure that the parameter limits are taken into consideration. In the case of continuous sampling, the parameter limits are frequently not recorded, which subsequently does not quite cover the parameter range. In addition, more designs should be selected in the peripheral areas so that a better quality MOP model is produced. Accurately specifying the design points for the parameters and their decimal mode is recommended. The reason for this is the very good approximation of the META model for the simulated designs. Now, improved statements regarding the clearance behaviour can be applied, owing to the more accurate torque curves produced as a result of the extended parameter analyses, which are implemented using extended FE simulations. The procedure presented for creating an adaptive simulation model can generally be implemented in other simulation tasks. Another great benefit of the functionally adaptive simulation model is, on the one hand, the flexible expandability by other META models and, on the other, the simple integration of modified DPs within the META models. In addition, this simulation strategy satisfies the criteria for reduced computing time (ideal case: real-time simulation ), the flexibility of the option to expand, the parameter ” ” diversity as well as the user flexibility all mentioned at the beginning of this paper.
5
Future research work
For future research work, the adaptive SIM-SMART simulation model created is going to be used to implement the global P-diagram in accordance with the Parameter Design and the Tolerance Design as set out in the SMART Robust Design Method. With the aid 11. Weimar Optimization and Stochastic Days – 6.-7. November 2014
20
of SIM-SMART, near real-time simulations can be implemented and, as a consequence, more samplings are possible for the sensitivity analysis, the optimization system and for the robustness analysis. In addition to that, the META models created can now be used to perform all parameter analyses in accordance with the global P-diagram, and to determine the nominal robust design. In further steps, SIM-SMART is to be supplemented and extended by the Tolerance Design phase, which will be implemented as described in Chapter 2.
References Breuer, B. ; Bill, K. H.: Bremshandbuch - Grundlagen, Komponenten, Systeme, Fahrdynamik. 4. Edition. Berlin : Springer Vieweg Verlag, 2012 Fowlkes, W. Y. ; Creveling, C. M.: Engineering Methods for Robust Product Design Using Taguchi Methods in Technology and Product Development. New York : AddisonWesley Publishing Company, 1995 Hab, G. ; Wagner, R.: Projektmanagement in der Automobilindustrie. Wiesbaden : Springer Gabler, 2013 Hyndman, R. ; Koehler, A.: Another look at measures of forecast accuracy. In: International Journal of Forecasting 22. Monash University, Australia, 2006, p. 679–688 Kemmler, S. ; Bertsche, B.: Gestaltung robuster und zuverl¨assiger Produkte nach der SMART-Methode. In: Proceedings of the Symposium on Design for X. Bamberg, October 2014, p. 169–180 Kemmler, S. ; Bertsche, B.: Systematic Method for Axiomatic Robustness-Testing (SMART). In: Proceedings of the International Symposium on Robust Design. Copenhagen, August 2014, p. 101–112 Milling, P.: Systemtheoretische Grundlagen zur Planung der Unternehmenspolitik. Berlin : Duncker & Humblot, 1981 Most, T. ; Will, J.: Metamodel of Optimal Prognosis - An automatic approach for variable reduction and optimal metamodel selection. In: Weimar Optimization and Stochastic Days 2008. Weimar, November 2008 Most, T. ; Will, J.: Sensitivity analysis using the Metamodel of Optimal Prognosis. In: Weimar Optimization and Stochastic Days 2011. Weimar, November 2011 Suh, N. P.: Axiomatic Design - Advances and Applications. New York : Oxford University Press, 2001 Taguchi, G. et al.: Taguchi’s Quality Engineering Handbook. New Jersey : John Wiley & Sons, Inc., 2005 VDI - Verein Deutscher Ingenieure e.V.: VDI Guideline 2221. D¨ usseldorf: Beuth Verlag. 1993 11. Weimar Optimization and Stochastic Days – 6.-7. November 2014
21