microcystins as markers of algae bloom contamination in ... The authors of this work would like to thank Mike Baylerian, Dan Rabinowitz and Stephen White for.
Method optimization strategies for the determination of microcystins as markers of algae bloom contamination in surface waters by UHPLC-ESI-TOFMS Nicole Lenca1 , Frank A. Kero2, Jason Weisenseel3, Benjamin Southwell4, Bogdan Bogdanov5, Craig Young5 , Judy Westrick1 1. Wayne State University, 5101 Cass Ave, Detroit, MI 48202 2. PerkinElmer, Oak Brook Technology Center, 2000 York Road, Suite 132, Oak Brook, IL 60523 USA 3. PerkinElmer, Atlanta Center of Excellence, 11695 Johns Creek Pkwy, Suite 150, Johns Creek, GA 30097 4. Lake Superior State University, 650 W Easterday Ave, Sault Ste Marie, MI 49783 5. PerkinElmer, San Jose Technology Center, 75 Nicholson Lane, San Jose, CA 95134, U.S.A.
TOFMS: Pulse mode
UHPLC methods
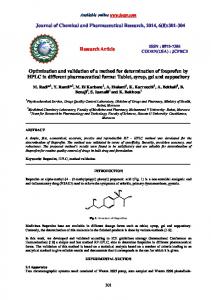
Introduction Algae bloom contamination of surface waters has become an emerging issue of public health in recent years, both to human and animal biota (Figure 1).
RR Surface water Collected from The United States, MidWest
LR
Results verified By inter-lab comparison
Figure 4: Oak Brook Tech Center – TOFMS lab
• Mobile Phases (gradient flow rate 0.5 mL/min) • A: 0.1% formic acid (FA) in water • B: 0.1% formic acid in acetonitrile (ACN)
Figure 1: Example of a contaminated public water source by algae blooms. Microcystins are peptide markers of algae bloom contamination that are currently monitored as a means to identify the type of algae bloom present in a geographic location. An example of a microcystin structure is given in (Fig 2).
Figure 5: UHPLC-TOFMS analysis (Pulse mode) of a surface water sample
• Lock Mass Tune Mix Solution (isocratic flow 1mL/min split 20:1) • Prepare in a 250 mL volumetric flask • 50 mL of ESI Tuning Mix • 75 mL LCMS-grade ACN • 250 µL FA • Dilute to volume (~125 mL) with LCMS-grade MeOH
Surface water Collected from The United States, West Coast
Column: • Brownlee SPP C18 2.1 100, 2.7 µm particle OD
Results verified By inter-lab comparison
Column Temp: • 40 °C No sodiated peaks (refer to Fig 5)
Injection volume: • 5 µL
Analytes of interest
Figure 6: UHPLC-TOFMS analysis (Pulse mode) of a surface water sample obtained from a different source
Table 1: The microcystin panel of interest Figure 2: Example of a microcystin stucture The advantages for mass spectrometry (MS) testing platforms have previously been reported for both small molecule screening and peptide applications versus traditional ELISA methods at ppb levels (Figure 3). Of particular interest to this study is the emergence of MS as a means to monitor chemical markers of algae bloom contamination in surface waters. Time-of-flight (TOF) MS is ideal for this application, since researchers may not know the exact nature of contaminants for geographically isolated samples. Fast scanning TOFMS instruments offer identification by exact mass measurements and when paired with chromatographic separation tools (e.g. LC, UHPLC) will provide data that is more informing versus many orthogonal qualitative techniques. A comparison of operational scan modes for the TOFMS will also be presented to detail the advantages in sensitivity with TrapPulse mode. Standards were prepared independent of this laboratory at Lake Superior State University (Sault Ste Marie, MI). The second source standards were prepared at Wayne State University (Detroit, MI). Preliminary method development work was completed at the University of Central Florida (3 analytes) prior to technology transfer to the PerkinElmer Center of Excellence (Figure 4: Oak Brook, IL). The analyte panel was extended to 6 analytes consistent with current trends in the field (Table 1). Additional method optimization was required. Authentic samples of contaminated surface waters were obtained and prepared by Wayne State University.
TOFMS: TrapPulse mode Microcystin
Structure
m/z (1+/2+) Standard 6 analytes
LR
C49H74N10O12
995.5590 sodiated peaks detected
1400
1200
RR
C49H75N13O12
519.7878
YR
C52H72N10O13
1045.5371
Figure 7: UHPLC-TOFMS (TrapPulse mode) analysis of a 50 ppb standard solution
Publication count on Google Scholar
1000
800 microcystins + ELISA microcystins + mass spectrometry microcystins + HPLC
600
LA
TrapPulse example
400
LW
200
C54H72N8O12
1025.5367
sodiated peaks detected
0 2000 2001 2002 2003 2004 2005 2006 2007 2008 2009 2010 2011 2012 2013 2014 Jul-15
Figure 3: Trends in analytical testing for microcystins towards mass spectrometry
LF
C52H71N7O12
986.5268 Figure 8: UHPLC-TOFMS analysis (TrapPulse mode) of a surface water
Sample Collection Two sources of contaminated public water were collected as “grab samples” and shipped to Wayne State University. Surface Water Sample 1: from the United States, West Coast
LA
C46H67N7O12
910.496
Surface Water Sample 2: from the United States, MidWest Samples were stored in 2 Liter containers. These containers were subject to 3 freeze thaw cycles to lyse cellular material prior to analysis to capture the total microcystin population. 10 mL of surface water samples were transferred to 15mL centrifuge tubes and subsequently centrifuged at 3000 rpm for 20 min. The supernatant was filtered with 0.45 µm cellulose acetate membrane filters. 1mL of filtrate was shipped to PerkinElmer (Oakbrook, IL) for analysis (Figure 4).
Results Preliminary development efforts focused on the direct transfer of PerkinElmer’s application note for 3 microcystins by LCMS (single quad). The method was successful on the TOFMS platform for LR, RR, YR . It was determined that acetonitrile was needed to extend the panel. It follows that the mobile phase chemistry and gradient ramp parameters were adjusted. No advantage was observed with the addition of selectivity modifiers (e.g. formic acid) in the diluent. Water or methanol provided adequate peak shape for these analytes. The standard solution prepared at Wayne State University was diluted in 80/20% water/methanol.
Methods
Authentic surface water samples were prepared at Wayne State University. The extracted samples were shipped with cold packs to PerkinElmer’s tech center (Oak Brook, IL). Samples were tested immediately when the shipment was delivered. The samples were retested using a different scan mode the next day.
Samples were analyzed by a PerkinElmer Axion2 TOFMS equipped with a Flexar FX15 UHPLC pump, Flexar autosampler and Flexar column oven.
The results are detailed in Figures 5-8. The qualitative identification of microcystin contaminants were verified by interlab comparison with Wayne State University.
The TOFMS was operated in (+) ESI mode.
It was interesting to note that the presence of sodiated adducts were detected in TrapPulse mode. This has the potential for investigators to monitor multiple ions per target analyte without the added cost and complexity of MS/MS.
Continuous mass calibration was achieved using a Flexar isocratic pump delivering lock mass solution at a flow rate of 1 mL/min (split 20:1). The data acquisition software was Chromera and the TOFMS system software was TOF Driver. Two operational modes of the TOFMS were evaluated: 1)
Pulse mode
2)
TrapPulse mode (expect improved S/N)
Collected from The United States, West Coast
Conclusions A comparison of 2 operational modes of TOFMS in tandem with UHPLC separations has been applied to 2 different geographical sources of surface waters It was determined that Pulse mode exceeded method requirements for the detection of microcystin analytes in authentic surface water samples. It was determined that TrapPulse mode allowed for additional sensitivity to allow for the detection of sodiated pseudo-molecular ions. This is an advantage in qualitative analysis allowing for quant/qualifier ion assignments. An inter-lab comparison determined that , for 2 split samples of authentic surface waters, TOFMS provided the same qualitative identification as MS/MS with added workflow advantages in non-targeted analysis.
Future work – Leveraging the advantages Of non-targeted analysis – Re-interrogate the data vs. Re-test the sample • A template for AxionSolo software is currently being developed to facilitate the unknown screening for >100 analytes related to cyanobacteria contamination (e.g. microcystins, anatoxins etc.) • Quantitation of specific algae bloom markers using customized isotopically labeled standards synthesised for this investigation • Identification of unique product ions from selected microcystin precursors via optimization of the CXP TOFMS parameter.
Acknowledgements The authors of this work would like to thank Mike Baylerian, Dan Rabinowitz and Stephen White for many helpful discussions. The authors of this work would also like to acknowledge Jason Kong from the Ohio Dept. of Agriculture for his administrative contributions to this work.