174
IEEE SYSTEMS JOURNAL, VOL. 3, NO. 2, JUNE 2009
Methodology for Assessing the Resilience of Networked Infrastructure Dorothy A. Reed, Kailash C. Kapur, and Richard D. Christie, Member, IEEE
Abstract—In this paper, we outline a method to characterize the behavior of networked infrastructure for natural hazard events such as hurricanes and earthquakes. Our method includes resilience and interdependency measures. Because most urban infrastructure systems rely on electric power to function properly, we focus on the contribution of power delivery systems to post-event infrastructure recovery. We provide a brief example of our calculations using power delivery and telecommunications data collected post-landfall for Hurricane Katrina. The model is an important component of a scheme to develop design strategies for increased resilience of urban infrastructure for extreme natural hazard scenarios. Index Terms—Infrastructure, networks, power system restoration, resilience, systems engineering.
I. INTRODUCTION
O
NE of the greatest challenges facing the United States today is the need for resilient and sustainable networked infrastructure [1], [2]. “Networked infrastructure” is a general term that refers to interconnected lifelines. “Lifelines” are networks that provide for the proper functioning of modern society, such as electric power delivery, transportation systems, and water supply. The present networked infrastructure evolved in an ad hoc manner through varying stages of technological innovation without consideration for the interconnected behavior. Individual aging lifelines continue to decline [3]. Diverse groups of researchers and practitioners have been involved in the analysis and design of these complex systems. This combination of interests renders the field very multi-disciplinary. In this paper, we outline a methodology for evaluation of the resilience of interdependent infrastructure systems under natural hazards such as hurricanes and earthquakes based upon a combination of results by others in the field. Then, as an example, we briefly apply the metrics of engineering resilience to wind-induced damage to the electric power delivery system in the Gulf region following
Manuscript received May 02, 2008; revised September 05, 2008. First published May 08, 2009; current version published May 22, 2009. This work was supported in part by the U.S. National Science Foundation under Grant CMMI0553063. D. A. Reed is with the Department of Civil and Environmental Engineering, University of Washington, Seattle, WA 98195-2700 USA (e-mail:
[email protected]). K. C. Kapur is with the Department of Industrial and Systems Engineering, University of Washington, Seattle, WA 98195-2650 USA (e-mail: kkapur@u. washington.edu). R. D. Christie is with the Department of Electrical Engineering, University of Washington, Seattle, WA 98195-2500 USA (e-mail:
[email protected]). Color versions of one or more of the figures in this paper are available online at http://ieeexplore.ieee.org. Digital Object Identifier 10.1109/JSYST.2009.2017396
Hurricane Katrina. We conclude that post-event in-situ data provide a snapshot of the interdependencies that come into play during extreme events. We note that the resiliency of the power delivery system will affect that of other dependent systems and a consideration of its performance and design will lead the way to an improved infrastructure overall. II. OUTLINE OF METHODOLOGY Resilience in the context of civil and industrial engineering systems is usually expressed mechanistically as the ability to “bounce back” after a major disturbance. Although broader definitions of resilience exist which incorporate socio-economic or environmental factors, (e.g., McDaniels et al. [4]) our approach is focused on engineering resilience. The engineering concept has several dimensions as defined in [5], [6] including robustness, redundancy, resourcefulness and rapidity. The terms may be applied to individual structures as well as connected structures in a networked lifeline. In our methodology we apply the engineering resilience definitions to performance data obtained for networked systems. We then combine these measures with input-output models to relate resilience to interdependency. A. Network Model Our network model is derived from the eleven-system interdependent infrastructure as postulated by Chang et al. [7] and based upon the structure derived by Rinaldi et al. [8]. The 11 systems are denoted by index values as follows. 1) Electric power delivery, with subsystems distribution, transmission, and generation. 2) Telecommunications, with subsystems of cable, cellular, Internet, landlines, and media. 3) Transportation, with subsystems air travel, roadways, fueling: gas stations, mass transit, rail, and water and port facilities. 4) Utilities, with subsystems water supply, sewage treatment, sanitation, oil delivery and natural gas delivery. 5) Building support, with subsystems HVAC, elevators, security and plumbing. 6) Business, with subsystems computer systems, hotels, insurance, gaming, manufacturing, marine-maritime, mines, restaurants and retail. 7) Emergency Services, with subsystems 911, ambulance, fire, police and shelters. 8) Financial systems, with subsystems ATM, banks, credit cards and stock exchange. 9) Food supply, with subsystems distribution, storage, preparation, and production. 10) Government, with subsystems of offices and services.
1932-8184/$25.00 © 2009 IEEE
REED et al.: METHODOLOGY FOR ASSESSING THE RESILIENCE OF NETWORKED INFRASTRUCTURE
11) Health care, with subsystems of hospitals and public health. The resilience measures of fragility and quality are combined with the input-output model of our 11-system infrastructure in order to fully characterize the total functioning of the networked infrastructure. We define these measures in the next sections. B. Resilience Measures 1) Fragility: Lifeline resilience may be explored through the use of fragilities. Fragilities are a tool commonly employed by structural engineers to characterize the probability of damage given a level of hazard demand such as wind velocity or ground acceleration. Most commonly derived for individual structures, or classes of structures such as low-rise buildings, their use was extended to pipelines by O’Rourke et al. [9] for damage per length of line for seismic hazards. Extending this concept to power delivery, Park et al. [10] used logistic regression models to fit empirically-derived fragilities for distribution lines for an urban delivery system for the Nisqually earthquake of February 2001. Reed [11] later extended Park’s concept for wind-related performance of the same distribution lines for several winter storms. Although this methodology works well for specific lines, it requires extensive geographical information (GIS) data of both the line and hazards for the areas of interest. In this investigation, we define fragility of the line as the percentage of outages relative to the total number of customers residing per the spatial distribution of parish. Expanding upon a definition used by Haimes [12], we use the term “inoperability” rather than “damage”. In equation form for the power delivery system for hurricane loading, the fragility is as follows:
where capacity of the fully functioning structural system; post-event capacity; parameter derived empirically from restoration data following the event; time in days post-event. It is convenient to divide both sides of (2) by in order to normalize the values of . For the systems under consideris fully operable and 0 is inoperation in this paper, able. Values in-between these two represent varying degrees of system operability. The parameters of the quality curve may be related to the dimensions of resilience. The ratio of to has been suggested as a measure of system robustness. The parameter “b” has been suggested as a measure of the rapidity of the recovery process. In addition, the integration of the area under the curve has been labeled Resilience R [6]. In equation form
(3) where and are the endpoints of the time interval under consideration. For the 11-system infrastructure described in section A, we for subsystem 1 from ; may evaluate resilience measures for system 2, etc.; from post-event data. We propose that the in general for a set a total subsystems is system resilience a function of the individual as follows: (4)
(1) where denotes a fragility; the 1 in refers to the power delivery system from our schema; represents the probability of “D” conditional on “e”; appropriate wind speed parameter for the hurricane (see Powell et al. [13] for details). A squared wind speed represents a dynamic wind pressure. It is noted that ranges of maximum sustained wind speeds are part of the Saffir-Simpson Hurricane classification into categories. 2) Quality: Quality is a function derived by the MCEER1 group in the paper by Bruneau et al. [5] and employed by many in the earthquake engineering community to describe structural performance over time following earthquakes. We extend this concept to wind-induced damage in this paper. In equation form, the quality is [6]
(2) 1Multidisciplinary Center for Extreme Event Research. Formerly the Multidisciplinary Center for Earthquake Engineering Research. For more information, please see http://www.mceer.org.
175
where is a function to be determined that combines the individual resilience values in a way that reflects their interdependence and connectivity. We note that the system resilience indirectly incorporates the rapidity and robustness parameters of the individual subsystems. C. Input-Output Inoperability In the systems engineering literature, Haimes [12] has derived an interdependence model between the various interconnected subsystems of the civil infrastructure based upon the Leontief input-output economic model as follows: (5) where vector of the subsystem inoperability; interdependency matrix between the various subsystems; disturbance or perturbation vector. Its units are in inoperability or reduction of functionality. take on values in the range beThe values of the matrix is related to tween 0 and 1 and one interpretation is that infrastructure conthe probability of inoperability that the infrastructure. A value of of unity means tributes to the
176
IEEE SYSTEMS JOURNAL, VOL. 3, NO. 2, JUNE 2009
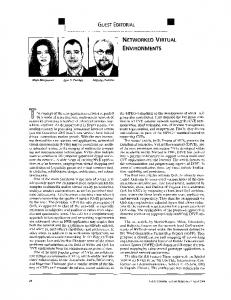
that a complete failure of the infrastructure will lead to a infrastructure. A value of of zero complete failure of the infrastructure has no effect on the means that failure of the infrastructure. The values of the vector may be interpreted as the reduction in functionality or level of inoperability induced by extreme events such as hurricanes or earthquakes. Its values are bounded represents an 80% by zero and unity. For example, reduction in lifeline 1 operability or an inoperability of 80% as denoted by due to the disruption. The values of are those of fragility introduced in (1). That is, for a given velocity pressure, the probability of inoperability is provided. This is the value for that particular storm. In addition, for hurricanes, values may be related to Saffir-Simpson Category. For earthquakes, may be related to the Instrumental Modified Mercalli Scale in terms of the peak ground acceleration. In his investigations, Haimes [12] derived values of the matrix using economic production function data pre-event. We propose a different approach. We base our A matrix upon postevent in-situ empirical data. The interconnections that come into play during and after disasters are the ones that we are concerned with in this investigation rather than those obtained under “normal operating conditions”. For example, for a two system infrastructure, we postulate that the inoperability of system 2, denoted as , is influenced but also the inoperability of not only by the event directly the system 1, denoted as . We acknowledge that various levels of uncertainty are associated with each of the subsystems. We anticipate that the calibration over many events will enable us to reduce the uncertainty in the model. For the 11-system approach, we use a causal network diagram to illustrate the relationship between power delivery—the central node—and the other systems such as telecommunications and transportation.
Fig. 1. Selected A matrix coefficients for the 11-system model.
the storm; and severe flooding resulted from torrential rains. In some regions, the rainfall was approximately 35.6 cm. Katrina’s second landfall was as a Category 3 hurricane at 6:10 AM CDT on Monday August 29th in Plaquemines Parish, Louisiana. The hurricane generated a large storm surge along the Gulf Coast. As of December 2005, the fatalities were reported as follows [15]: 1090 in Louisiana, 228 in Mississippi, two in Georgia, and two in Alabama. Peak wind gusts were reported as high as 49.3 m/s (115 mph) and rainfall as high as 43.2 cm was recorded [14]. B. Outage Data
III. EXAMPLE FOR HURRICANE KATRINA As a means to illustrate the use of our approach, we derived the fragility and quality curves for the power delivery system 1 in our model post-Hurricane Katrina landfall for the affected parishes in the state of Louisiana. Although we did not have adequate data for the fragility assessment of the telecommunications system BellSouth, we did have data for the quality, which in this paper. Because the telecommunicawe are labeling tions system uses the same distribution system poles and towers albeit with a different connectivity scheme we were confident that the restoration of system 2 was to some extent dependent upon the restoration of system 1. Indeed, for safety reasons, the power companies in the U.S. do not allow other companies to have access to the poles until the distribution system has been restored.
Data on outages were obtained from various sources. Outage and duration data for each company and parish for Louisiana were provided by the Louisiana Public Service Commission (LPSC) [16] with the exception of Entergy New Orleans (ENOI), which is regulated by the City of New Orleans. Similarly, the Florida Public Service Commission provided data for each county and company in Florida. Outage data for Alabama and Mississippi were obtained from company website reports and E-mails from company officials. Only limited information from the state utility commissions was available. Sometimes useful information was found in legal documents used to justify rate change requests. Unfortunately, despite several requests, companies did not release GIS data. However, service area maps were available at company websites.
A. Hurricane Overview
C. Outage Comparison
Hurricane Katrina was unusual in that it made two landfalls in the United States [14]. Katrina’s first landfall was as a Category 1 hurricane on August 25, 2005 at 6:30PM EDT near the Miami-Dade and Broward County Line [15]. Over 1 million power outages occurred; fourteen deaths were attributed to
Fig. 2 shows the outages for both landfalls of Katrina by state over the period of August 25 through mid-October. It can be seen that permanent outages of over 100,000 (combined) have occurred for Louisiana, Alabama, and Mississippi. In these instances, customers did not return to heavily damaged locations.
REED et al.: METHODOLOGY FOR ASSESSING THE RESILIENCE OF NETWORKED INFRASTRUCTURE
177
Qt
Fig. 4. Quality ( ) for the electric power delivery system of the state of Louisiana as a function of time for the Hurricane Katrina.
Fig. 2. State outage comparison for Hurricane Katrina.
Fig. 3. Restoration analysis with a normalized time scale.
D. Restoration Analysis Restoration of outages is critically important for the recovery of the entire infrastructure. Because of the differences in the outage durations for the hurricane data, we compare the restoration using a “normalized” time scale as shown in Fig. 3. In this figure, the timescale is the time in days for restoration divided by the total outage duration. Louisiana data are evaluated for cases in which the permanent damages in Entergy New Orleans (designated as ENOI) are included and those in which these were not included. The Puget Sound region Hanukkah Eve winter storm of 2006 [11] is provided to compare restoration for another wind event. The similarity in the curves is remarkable. E. Rapidity The rate of recovery for specific Katrina outages was investigated through the quality function. In Fig. 4, the quality of the system for the state of Louisiana including the ENOI data drops eighty percent initially, and over forty-five days pass before the recovery efforts stabilized. A permanent “deformation” of ten percent occurred since only ninety percent of the power
t
TABLE I PARAMETER “ ” COMPARISON FOR VARIOUS DATA SETS
b
delivery system was restored. From (3), we note that the resilience measure for this scenario is approximately 30%. The rate of recovery has been viewed as a societal response mechanism that is primarily affected by preparedness. The non-linear nature of the recovery function shown in Fig. 4 may be related to many factors beyond the allocation of resources for repair such as the well-documented interdependence of transportation and power lifelines for post-event restoration efforts (e.g., [17] and [18]). The quality data for Katrina allow us to estimate values reflecting the recovery. It seems appropriate to compare the values for various outage scenarios as shown in Table I as a measure of resilience in terms of the rapidity of recovery. A review of Table I shows that recovery rates are slower for the limited cases of hurricanes than for earthquakes, and that this parameter may be useful in establishing what a design target should be. That is, if emergency management personnel consider a three-day total recovery period desirable, then one could evaluate improving both the robustness and rapidity components of resiliency. For example, Le Du et al. [20] examined robustness and suggested that increased tower ductility and network redundancy be put into EDF2 design practice to increase overall resiliency following observations of power delivery failure during the French winter storms of 1999. Other means to achieve resiliency goals might include making increased human and equipment resources available for rapid deployment following extreme events. 2Electricite’de
France, a. k. a. the French Power Company.
178
IEEE SYSTEMS JOURNAL, VOL. 3, NO. 2, JUNE 2009
Fig. 5. Quality comparison for power delivery . BellSouth
Q
Q
and telecommunications
Fig. 6. Power system fragilities for Hurricane Katrina.
The rapidity values may also be obtained for other lifelines and scenarios. Only limited sources of post-event data are available for lifelines before the 1995 Kobe earthquake. Indeed, the Applied Technology Council in its pioneering report of 1985 [21] had to survey expert opinion for the prediction of earthquake-related lifeline failures due to the scarcity of empirical data. Technological advances such as outage management systems, GIS aerial surveys, and widespread environmental monitoring are providing increasing amounts of data and improved levels of data quality. These methods for assessment and control of resiliency should be designed to take advantage of these advances in data acquisition. F. Interdependency Analysis 1) Resilience Measures: In Fig. 5, the quality curves for system 1 and for system 2 are shown as a function of the values are taken from Fig. 4. Before days after landfall. The landfall, the values would be at one hundred percent or fully data were not reported to the functional. It is noted that the LPSC until six days after landfall. Therefore, a time delay for restoration is shown. For , the best-fit value is 0.09. the for the power delivery system 1 is provided The fragility in Fig. 6. The data for the percent of outages per total number of customers per parish were used to evaluate the fragility. In order to evaluate the wind speed, we superimposed geographical information system [GIS] data available through the Hurricane Research Division (HRD) [22]. The wind speed ratio is the peak sustained wind speed from HRD for the parish divided by the equivalent ASCE-7 [23] wind speed for the Louisiana coastline. In keeping with previous investigations (e.g., [10], [11]), the fragility data were best fit by a lognormal distribution. 2) Two System Interdependency: In order to assess the interdependency values, we derived a linear relationship between the and variables from the quality functions for Hurricane Katrina for affected parishes in Louisiana in Fig. 7. The trend line in the figure indicates that we can relate the inoperability of the telecommunications system to that of the
Fig. 7. Trend between x and x using Katrina data.
power delivery system through a simple linear relationship. A second-order trend may also be appropriate to consider. However, the value indicates that inoperability is not completely explained by inoperability but also depends on other factors. The linear trend line in Fig. 7 provides a value for one element . We assume that the influof the A matrix of (5), ence of on is small, say , and . Equation (5) can now be solved, yielding the steady state inoperability as follows:
(6) For a wind speed ratio squared of 0.2, Fig. 6 gives a value for of 0.5. If we simply assume the same impact on system
REED et al.: METHODOLOGY FOR ASSESSING THE RESILIENCE OF NETWORKED INFRASTRUCTURE
2, then
and we can solve to obtain and . This result is a steady state result. We note that a dynamic input-output model exists as follows [12]: (7)
where the matrix represents the relationship between and its derivative with respect to time . The derivation of the matrix would require a more extensive analysis than shown here. The model gives rise to inoperability versus time curves of the form during the recovery phase, from which resiliency R values may be estimated. Observed values of parameter such as those in Table I can be used to validate the dynamic model.
IV. DISCUSSION Our focus in this investigation is to develop strategies to improve infrastructure resilience. In order to accomplish this goal, we use simple models to evaluate the performance of the interdependent networked infrastructure for natural hazards. We are not building a complex detailed computer database to model the real-time functioning of the entire infrastructure, nor do we wish to evaluate the risk overall to a particular region. Our contribution is to capture the recovery aspects in such a manner as to identify overall trends in interconnected lifelines so as to assist others who are developing the intricate models and databases required for regional planning and evaluation. We anticipate that models resulting from our studies will be useful to McDaniel et al. [4], Liu et al. [24], MCEER researchers such as Bruneau et al. [5] and others who model the risk of regions for hurricanes and other natural disasters. The knowledge base of post-event data for power delivery performance is expanding, and models of its resiliency are becoming more accurate. Because the recovery of other subsystems is dependent—in varying degrees—on electric power for operation, we anticipate that predictions of resilience for these other systems will become more accurate as the knowledge base for power delivery expands. One difference between pre- and post-event modeling as shown in the example is the inclusion of first and second degree interdependence as defined by Chang et al. [7]. That is, the post-event data reveal that not only does the power outage itself affect the telecommunications restoration—first degree association—but the power recovery activities also affect the telecommunications recovery—a second degree association. A pre-event correlation analysis using production information alone may not have been able to make this distinction. We note that other researchers have evaluated system recovery and restoration using models that differ from the quality representation shown here [25]. Use of these alternatives may provide additional insights into the recovery process and their inclusion will be investigated in the future. As a general rule, design standards for structures are based upon providing safe and economical levels of capacity for varying degrees of demand. Failure data are important for examining the resilience of systems and using these results in
179
developing strategies to improve design. Our approach may result in better tradeoffs between e.g., greater structural ductility in towers and increased structural redundancy in connected lines. V. SUMMARY AND CONCLUSIONS We have outlined a simple methodology to evaluate engineering resilience and interdependency for subsystems of a multi-system networked infrastructure for extreme natural hazard events. The method combines the elements of MCEER-based resilience measures, input-output models and structural fragilities. We used limited data for Hurricane Katrina lifeline damage to briefly illustrate the application of the process. The initial results are promising and they suggest that strategies for improved lifeline design may be achieved using the methodology. ACKNOWLEDGMENT The authors would like to thank the reviewers for their insightful comments. The Louisiana Public Service Commission was especially helpful in providing data and background material on Hurricane Katrina. REFERENCES [1] Critical Foundations: Protecting America’s Infrastructures. Washington, DC, President’s Commission on Critical Infrastructure Protection (PCCIP), 1997. [2] Grand Challenges for Disaster Reduction, A Report of the Subcommittee on Disaster Reduction National Science and Technology Council, 2005 [Online]. Available: www.sdr.gov [3] ASCE. Report Card for America’s Infrastructure 2007 [Online]. Available: http://www.asce.org/reportcard/ [4] T. L. McDaniels, S. E. Chang, D. Cole, J. Mikawoz, and H. Longstaff, Fostering Resilience to Extreme Events within Infrastructure Systems: Characterizing Decision Contexts for Mitigation and Adaptation, Global Environmental Change 2008 [Online]. Available: www.elsevier.com/locate/gloenvcha [5] M. Bruneau, S. Chang, R. Eguchi, G. Lee, T. D. O’Rourke, A. M. Reinhorn, M. Shinozuka, K. Tierney, W. A. Wallace, and D. Von Winterfeldt, “A framework to quantitatively assess and enhance the seismic resilience of communities,” Earthquake Spectra, vol. 19, pp. 733–752, 2003. [6] T. D. O’Rourke, “Critical infrastructure, interdependencies, and resilience,” The Bridge, vol. 37, no. 1, pp. 22–29, 2007. [7] S. E. Chang, T. McDaniels, and D. A. Reed, “Mitigation of extreme events: Electric power outage and cascading effects,” in Proc. USC Center for Risk and Economic Analysis of Terrorism Events (CREATE) Symp. on the Economic Cost and Consequences of Terrorism, Los Angeles, CA, Aug. 20–21, 2004. [8] S. M. Rinaldi, J. P. Peerenboom, and T. K. Kelly, “Identifying, understanding and analyzing critical infrastructure dependencies,” IEEE Control Syst. Mag., vol. 21, no. 6, pp. 11–25, Dec. 2001. [9] T. D. O’Rourke, S. S. Jeon, R. T. Eguchi, and C. K. Huyck, Advanced GIS for Loss Estimation and Rapid Post-Earthquake Assessment of Building Damage, 2001 In: MCEER Research Progress and Accomplishments 2000–2001 2001 [Online]. Available: http://www.mceer. buffalo.edu [10] J. Park, N. Nojima, and D. A. Reed, “Nisqually earthquake electric utility analysis,” Earthquake Spectra, vol. 22, no. 2, pp. 491–509, May 2006. [11] D. A. Reed, “Electric power distribution system performance for winter storms,” J. Wind Eng. Ind. Aerodynam., Jun. 2007. [12] Y. Y. Haimes, Risk Modeling, Assessment, and Management. New York: Wiley, 2004, pp. 837–837.
180
IEEE SYSTEMS JOURNAL, VOL. 3, NO. 2, JUNE 2009
[13] M. D. Powell, S. H. Houston, and T. A. Reinhold, “Hurricane Andrew’s landfall in South Florida, part I: Standardizing measurements for documentation of surface wind fields,” Weather Forecast., vol. 11, pp. 329–349, 1996. [14] A. Graumann, T. Houston, J. Lawrimore, D. Levinson, N. Lott, S. McCown, S. Stephens, and D. Wuertz, Hurricane Katrina: A Climatological Perspective 2005, NOAA Technical Report 2005-01. [15] The Federal Response to Hurricane Katrina: Lessons Learned 2006 [Online]. Available: www.whitehouse.gov/infocus/hurricane/index.html [16] Emergency Operations Center, Daily Service Outage Reports—August 29, 2005 Through August 31, 2005, (Excel Spreadsheets for Each Day Summarizing Electric, Natural Gas, and Phone Outages) Louisiana Pubic Service Commission, 2005. [17] F. Krimgold, J. Bigger, M. Willingham, and L. Mili, Power Systems, Water, Transportation and Communications Lifeline Interdependencies Mar. 2006 [Online]. Available: www.americanlifelinesalliance.org [18] L. Mili, F. Krimgold, J. Alwang, and J. E. Bigger, “Integrating engineering, economic, and social modeling in risks of cascading failures across interdependent complex networks,” in Proc. 8th Int. Conf. Probabilistic Methods Applied to Power Systems, Ames, IA, Sep. 12–16, 2004. [19] S. E. Chang, Direct Economic Impacts, Engineering and Socioeconomic Impacts of Earthquakes: An Analysis of Electricity Lifeline Disruptions in the New Madrid Area. Buffalo, NY: MCEER: University of Buffalo, 1998, pp. 75–94. [20] M. Le Du, B. Rassineux, and P. Cochet, “The French power network facing the 1999 storms,” in Power Systems and Communication Infrastructures for the Future: Proc, CRIS Conf,, Beijing, China, Sep. 2002. [21] Applied Technology Council, ATC-13: Earthquake Damage Evaluation Data for California. Washington, DC, FEMA, 1985. [22] AOML, NOAA Hurricane Katrina, Hurricane Research Division [Online]. Available: http://www.aoml.noaa.gov/hrd/Storm_pages/katrina2005/wind.html [23] ASCE/SEI 7-05, Minimum Design Loads for Buildings and Other Structures ASCE, 2005. [24] H. Liu, R. Davidson, D. V. Rosowsky, and J. R. Stedinger, “Negative binomial regression of electric power outages in hurricanes,” J. Infrastruct. Syst., vol. 11, no. 4, pp. 258–267, 2005. [25] T. H. P. Tabucchi and R. A. Davidson, Post-Earthquake Restoration of the Los Angeles Water Supply System MCEER Publication MCEER-08-0008 [Online]. Available: www.mceer.org
Dorothy A. Reed received the B.S. degree in civil engineering from the University of South Carolina, Columbia, and the M.S.E. and Ph.D. degrees from Princeton University, Princeton, NJ. She is a Professor of Civil and Environmental Engineering at the University of Washington, Seattle. Her research interests include structural and wind engineering.
Kailash C. Kapur received the Ph.D. degree in industrial engineering from the University of California, Berkeley, in 1969. He is a Professor of Industrial Engineering at the College of Engineering, University of Washington, Seattle. He served as the Director of Industrial Engineering from 1993–1999. He was a Professor and the Director of the School of Industrial Engineering, University of Oklahoma, from 1989 to 1992. He is co-author of Reliability in Engineering Design (New York: Wiley, 1977). Dr. Kapur is a Fellow of ASQ and IIE and a Registered Professional Engineer.
Richard D. Christie (M’75) received the B.S. and M.S. degrees in electric power engineering from Rensselaer Polytechnic Institute, Troy, NY, and the Ph.D. degree from Carnegie Mellon University, Pittsburgh, PA. He is an Associate Professor of Electrical Engineering at the University of Washington, Seattle. His research interests include power system operations and reliability.