Technical Report Documentation Page. 1. Report No. ... from: National Technical Information .... These limitations support the need for developing a practical procedure for selection of .... Training courses can come in the form of onsite training.
Methodology for Selecting Microscopic Simulators: Comparative Evaluation of AIMSUN and VISSIM Final Report
Prepared by: Haifeng Xiao Ravi Ambadipudi John Hourdakis Panos Michalopoulos Department of Civil Engineering University of Minnesota
CTS 05-05
HUMAN-CENTERED TECHNOLOGY TO ENHANCE SAFETY AND MOBILITY
Technical Report Documentation Page 1. Report No.
2.
3. Recipients Accession No.
CTS 05-05 4. Title and Subtitle
5. Report Date
Methodology for Selecting Microscopic Simulators: Comparative Evaluation of AIMSUN and VISSIM
May 2005
7. Author(s)
8. Performing Organization Report No.
6.
Haifeng Xiao, Ravi Ambadipudi, John Hourdakis, Panos Michalopoulos 9. Performing Organization Name and Address
10. Project/Task/Work Unit No.
University of Minnesota Department of Civil Engineering 500 Pillsbury Drive S.E. Minneapolis, MN 55455-0116
CTS project number 2003035
12. Sponsoring Organization Name and Address
13. Type of Report and Period Covered
Intelligent Transportation Systems Institute Center for Transportation Studies University of Minnesota 511 Washington Avenue SE, Suite 200 Minneapolis, MN 55455
Final Report
11. Contract (C) or Grant (G) No.
14. Sponsoring Agency Code
15. Supplementary Notes
http://www.cts.umn.edu/pdf/CTS-05-05.pdf 16. Abstract (Limit: 200 words)
Because federal regulations require that all changes to existing traffic systems be checked for operational efficiency, simulation models are becoming popular evaluation tools. There are several highly regarded simulation models available. However, there are no guidelines for selecting a simulator that is most suitable for meeting the needs of a specific project. The authors present a simulation model selection process that takes into account quantitative and qualitative criteria. The qualitative evaluation process includes functional capabilities, input/output features, ease of use and quality of service. Quantitative evaluation considerations include accuracy, completion efforts and the parameters involved. They also present a grading scheme in order to reduce subjectivity in the evaluation process. For demonstration purposes, the authors used AIMSUN and VISSIM systems to model a real freeway section and compiled the evaluation results. 17. Document Analysis/Descriptors
18.Availability Statement
AIMSUN VISSIM Simulators
Traffic model Freeway
No restrictions. Document available from: National Technical Information Services, Springfield, Virginia 22161
19. Security Class (this report)
20. Security Class (this page)
21. No. of Pages
Unclassified
Unclassified
32
22. Price
Methodology for Selecting Microscopic Simulators: Comparative Evaluation of AIMSUN and VISSIM
Final Report
Prepared by: Haifeng Xiao Ravi Ambadipudi John Hourdakis Panos Michalopoulos Department of Civil Engineering University of Minnesota
May 2005
Intelligent Transportation Systems Institute University of Minnesota CTS 05-05
Acknowledgements The author(s) wish to recognize those who made this research possible. This study was funding by the Intelligent Transportation Systems Institute (ITS), University of Minnesota. The ITS Institute is a federally funded program administered through the Research & Innovative Technology Administration (RITA).
Table Of Contents CHAPTER 1. INTRODUCTION………………………………………………………... 1 CHAPTER 2. BACKGROUND…………………………………………………………. 2 CHAPTER 3. MODEL SELECTION PROCEDURE…………………………………... 4 3.1 Qualitative Evaluation…………………………………………………… 4 3.1.1 Functional capabilities…………………………………………………… 4 3.1.2 Input/output features……………………………………………………... 5 3.1.3 Ease of use……………………………………………………………….. 5 3.1.4 Quality of service………………………………………………………... 6 3.2 Quantitative Evaluation…………………………………………………. 6 3.2.1 Accuracy of simulators…………………………………………………... 7 3.2.2 Completion efforts……………………………………………………….. 8 3.2.3 Parameters involved……………………………………………………… 8 3.3 Grading scheme………………………………………………………….. 9 3.4 Advantages and issues…………………………………………………… 9 CHAPTER 4. IMPLEMENTATION OF THE PROCEDURE………………………….. 10 4.1 Simulator Overview……………………………………………………… 10 4.2 Test Site and Data Description…………………………………………... 11 4.3 Calibration……………………………………………………………….. 12 4.4 Results…………………………………………………………………… 13 CHAPTER 5. CONCLUSIONS…………………………………………………………. 15 REFERENCES…………………………………………………………………………... 16 APPENDIX A. Figures……………………………………………………….………………….…….A-1
List of Figures Figure 1A
Evaluation criteria framework………………………………………….A-1
Figure 1B
Evaluation criteria framework (cont.)………………………………….A-2
Figure 2:
Schematic of the test site……………………………………………….A-3
Figure 3:
Speed Contours on I-494 WB: real and simulated……………………..A-4
List of Tables Table 1:
Goodness of fit measures for I-494 mainline Volumes………………... A-5
Table 2:
Feature availability in AIMSUN and VISSIM………………………… A-6
Table 3A:
Example implementation of the procedure…………………………….. A-7
Table 3B:
Example implementation of the procedure…………………………….. A-8
Executive Summary Simulation is being used increasingly as an off-line tool for testing various controls and for selecting/evaluating alternative designs before actual implementation. Several traffic simulation models have been developed for different purposes over the years. In order to validate the simulation models as effective and appropriate tools, many studies have contributed to simulator evaluation. However, the majority of the evaluation studies were qualitative based on feature availability. This paper presents a comprehensive procedure for selecting a microscopic simulator among several alternatives. The procedure uses both qualitative and quantitative evaluation criteria and incorporates room for user’s priorities by assigning weights to each feature of evaluation. The proposed procedure was used by two different users to select a simulator of their preference based on their modeling priorities from two widely used simulators, AIMSUN and VISSIM. Although both simulators are reasonably accurate in simulating a real freeway of medium complexity it can be easily seen from the results that selection of the best option in this case is highly subjective since the simulators are the best available.
Chapter 1 - Introduction With the increase in traffic on road networks, the focus of transportation projects has shifted to improving operational efficiency of existing networks. Federal regulations require that all changes to existing systems have to be checked for operational efficiency before field implementation. Due to several limitations of the methodologies suggested in the Highway Capacity Manual (HCM) [1], simulation is being employed increasingly for such purposes. The main advantage of using simulation models in the analysis of a complex system is that the models are capable of capturing the interactive effects of different components of the system. Moreover, the period of analysis can be split into several time slices allowing the user to observe and evaluate the buildup, dissipation and duration of traffic congestion [1]. However, before proceeding to use simulation as an offline tool, one needs to select a simulator that meets the requirements of the project at hand or for adapting the most appropriate simulation model for his/her general needs. Over the past decade several simulators with varying capabilities and limitations have emerged and have been accepted by practicing engineers. However, there are no guidelines for selecting a simulator that is most suitable for meeting the needs of a specific project or user’s general requirements. This paper presents a systematic simulator evaluation procedure that can be used to evaluate different simulators. The procedure aims at assisting users to select their own simulator based on their requirements and needs. The procedure is based on a set of evaluation criteria that are classified into qualitative and quantitative criteria that are further classified into several other criteria. Each criterion is assigned a grade based on the simulator’s performance. Moreover, a weighting factor is assigned by the user for each criterion based on individual preferences. A real-life implementation of the proposed procedure is carried out at the end to illustrate its applicability for an evaluation of any number of simulators. It is demonstrated that based on individual user preferences different simulators can be selected using this procedure.
1
Chapter 2 - Background Several traffic simulation models have been developed for different purposes over the years. In order to validate the simulation models as effective and appropriate tools, many studies [2, 3, 4, 5, 6, 7, 8] have contributed to simulator evaluation. Most of these studies were qualitative and were based on feature availability. Calibration and quantitative testing is lacking except in [5, 6 and 7] which however are limited to two or three simulators. The main reason for this limitation is lack of simultaneous data both at the boundaries and intermediate points for sufficiently long sections (greater than 5 miles or so). From the aforementioned studies the most notable are only three [2, 3 and 4], as they included several simulators to identify the main aspects required for performing a comparative evaluation. This section summarizes some of the important conclusions of these studies. In 2000, University of Leeds conducted a modeling evaluation project named SMARTEST. An important contribution of the study was to identify the gaps between model capabilities and user requirements. Some of these important user requirements as identified by this project include: models should include the ability to model incidents, public transport stops, roundabouts and commercial vehicles. should be able to model the ITS functions like adaptive control, coordinated traffic signals, priority to public transport vehicles, ramp metering, variable message signs, dynamic route guidance and freeway flow control. the execution times of the models should be several times faster than real time. the models should have high-quality performance including default parameters provided, easy integration with a database, limited need for data acquisition and so on. the models should include graphical user interface for input, editing and presentation of results. The authors concluded that a good micro-simulation model in the future should be comprehensive so that it has the capabilities of not only dealing with common traffic problems but also modeling various ITS functions as well. They also pointed out that 2
there is a need to calibrate the models. Almost during the same period, Schmidt (2000) conducted a comparison of four widely-used simulation models CORSIM, AIMSUN, INTERGRATION and CONTRAM I. The outcome of the study was a set of recommendations for the use of simulation models in the future. It pointed out that the micro simulators, if properly calibrated, could be very useful in understanding the dynamic nature of traffic though they take time handling the input. The study revealed that although microscopic simulators were good in principle, they missed some important modules concerning trip planning, guidance and cruise control. A simulator evaluation study was conducted by Boxill et al (2000) in order to determine whether existing simulation models were suitable to effectively model ITS applications. Nine models with credible theories and those that incorporated at least one ITS feature were evaluated. The author concluded that the models have limitations when it comes to modeling the effects of the ITS applications such as real-time control, traffic management operations and travel information systems The studies mentioned above and most of the other studies conducted to date do not provide a procedure that can be used to evaluate different simulators. Most studies just provide an answer “available or not” for several subjective features of the evaluation. These limitations support the need for developing a practical procedure for selection of appropriate simulators.
3
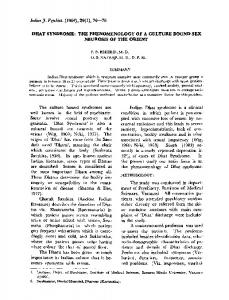
Chapter 3 – Model Selection Procedure In order to select a model that is the most desirable, the user has to set up a list of selection criteria. These selection criteria can be classified into two categories: qualitative and quantitative. In general, qualitative criteria are used to evaluate various features of a simulator whereas quantitative criteria are used to evaluate the time required to setup a particular scenario and the accuracy. In addition to the qualitative and quantitative criteria, the cost and maintenance fee for a simulator should also be considered. Figures 1A and 1B show an evaluation framework which will be described in the following sections.
3.1 Qualitative Evaluation To conduct qualitative evaluation, it is necessary to gather and read through all the information regarding the simulators of interest, including their manuals, publications, users’ comments, and so on. This enables a user not only to identify all the features that a simulator is capable of incorporating but also the ease of implementing them using it. In general the qualitative features for a simulator can be classified as functional capabilities, input/output features, ease of use and quality of service provided by the developers.
3.1.1 Functional Capabilities Functional capabilities should include all the features that the user wants the simulator to incorporate. The functional capabilities can be classified into general criteria like geometrics, demand options, traffic control, transit applications, incident management and others, each of which can be further classified into specific selection criteria. Except Collector-Distributor (C-D) roads in geometrics criteria, external interface timing plan in traffic control and shoulder usage in transit applications category all the other specific selection criteria listed in figures 1A and 1B are self explanatory. Collector-Distributor roads (C-D roads) are roadways usually designed to remove weaving on freeway mainlines. Drivers exit from the freeway onto a C-D road which runs parallel to the freeway mainline, and then decide which direction to take. 4
External interface timing plans implies the ability of a simulator to incorporate user-designed signal timing plans using an external program. In some places, transit vehicles can use the shoulders on a freeway. The shoulder usage in Table 1 reflects whether or not such usage is possible in the simulator. For evaluation of functional capabilities, we are mostly concerned about their availability and efficiency in the simulators, in the sense we need to evaluate how well the simulators can realize such a capability. If a simulator can fulfill a specific capability more easily, it means that it performs better with respect to this capability. As different users usually have different requirements for simulator capabilities, it is more practical for users to make a wish list that contains all the specific capabilities of their interest for evaluation.
3.1.2 Input/Output Features For evaluation of input/output features, we are mainly concerned about the complexity of the format of input data required for simulation as well as availability and flexibility of various output characteristics. Input data for simulation usually includes four categories: geometry, demand, control plan, and public transportation data. If a simulator requires this data in a less complex format, it performs better with respect to that data category. Similarly, output characteristics can be categorized into output file formats (text files, data base etc.,), animation of results, traffic-related measures and environmental measures. If a simulator has a more flexible output characteristic, it performs better with respect to such characteristic. As the output requirements vary, the users may prepare a list that reflects their specific interests.
3.1.3 Ease of Use For evaluation of ease of use, we use input efforts, software related characteristics and learning curve as criteria. The efforts required for data entry depend on factors like the format of input requirements and availability of user interface. In most of the cases data that comes from the field is not in a format required by the simulator. When working with large networks, the data entry process takes a lot of time and is sometime prone to
5
errors if the data is entered manually. If a simulator requires less effort for entering some data, it performs better with respect to that data category. Most simulation models do not provide users with an application tool that converts the data that comes from field into the format required by them. If such a tool is available it requires less effort from the user to enter input data and the modeling process will be free of input errors. The availability of such tools and the simulation environment are included in the criteria “software related characteristics.” If a simulator provides more flexible interfaces for users to develop applications, it performs better with respect to this criterion. From ease of use point of view, a simulator with an integrated simulation environment performs better than one with a simulation environment composed of separate components. A user’s learning curve may also reflect the ease-of-use of simulators. A simulator performs better with respect to this criterion if it takes the user less time to learn how to use it.
3.1.4 Quality of Service For evaluation of quality of service, we are mainly concerned about the availability and quality of various services provided by the developers or its distributors. The common services include resource materials, training courses, user support, and so on. Resource materials include detailed user manuals both for the model and any tools that are made available to the user. Training courses can come in the form of onsite training or training at developer specified location. Obviously, a simulator performs better with respect to this criterion if its developer provides better services.
3.2 Quantitative Evaluation The quantitative evaluation of a model cannot be accomplished without calibrating the model parameters. In most of the modeling projects, calibration of the model requires a lot of effort and consumes a lot of time. The calibrated model should be used to test the model with different demand patterns. Subsequently, appropriate goodness-of-fit measures and completion efforts for calibration can be obtained as quantitative criteria. A review of literature suggests the existence of several calibration methodologies, mostly different methods for different models [9]. Due to this reason users often face the problem of selecting an appropriate procedure that meets their data
6
requirements. This highlights the need for a calibration procedure that takes into account typical data available and is consistent with traffic engineering practices.
3.2.1 Accuracy of Simulators While performing calibration it is essential to use some goodness-of-fit statistics which reflect a mode’ls ability to replicate reality. When measuring accuracy some goodness-of-fit statistics are usually used for volume comparison. These statistics can include correlation coefficient, root mean square errors etc. The correlation coefficient is a number between -1 and 1 that measures the degree to which two variables are linearly related. If the two series of volumes, actual and simulated respectively in this study, match perfectly, the correlation coefficient has the value of 1. Any discrepancies between the two data sets may result in the correlation different from 1. This number measures to some extent how strong the simulated data has linear association with actual volumes. It is calculated according to the formula: __
Equation 1
__
1 n ( xi − x )( yi − y ) r= ∑ n − 1 i =1 SxS y
Where r is the correlation coefficient,
x : the mean of the simulated volumes at a station y : the mean of the actual volumes at a station s x : the standard deviation of the simulated volumes at a station
s y : the standard deviation of the actual volumes at a station n : the number of intervals for each station at a station
For volume-based calibration, we expect two data sets to match perfectly in each interval. In practice, however, discrepancies between simulated data set and actual data set are unavoidable and larger discrepancies mean less goodness-of-fit of the simulated data set. Correlation coefficients cannot reveal those relative errors that continuously exist between two data sets. Therefore, an additional goodness-of-fit measure for error is necessary in order to completely evaluate calibration results. There are many different measures that could be used for measuring errors, based on different application 7
purposes. As absolute errors do not provide a clear insight as to the extent of the error, Root Mean Squared Percent Error (RMSP), a typical relative error measure for data set comparison in time series is used in this study. The formula for computation of RMSP is given by: Equation 2
RMSP =
1 n xi − yi 2 ∑ ( y ) × 100 % n i =1 i
x i is the simulated volume at time interval i; y i is the actual volume at time interval i; n : the number of observed intervals at a station.
Apart from the goodness-of-fit statistics it is essential to compare speed contours which reflect the ability of the models to capture bottlenecks in the system. Obviously, a simulator performs better with respect to this criterion if it obtains more accurate measures. When comparing multiple simulators it is essential to spend an equal amount of time on all the models for calibration, as accuracy of a particular model can be usually improved by spending more time with it.
3.2.2 Completion Efforts For evaluation of the completion efforts, the time spent on the calibration and testing of the simulators can be used as criteria. The time required for calibration usually includes the time taken to enter data in the form of geometrics, demands, signal control and the time required to extract the required output and compute the goodness-of-fit statistics. Similarly the time required for validating a calibrated model includes the time required to change the demand patterns and the time required to extract output for computing the goodness-of-fit statistics. A simulator performs better if it takes less time to calibrate it to an acceptable level.
3.2.3 Parameters Involved For evaluation of parameters involved in calibration, we are mainly concerned about the number of parameters involved in the process. Typically a microscopic simulator has several model parameters in the form of car-following, lane changing,
8
driver behavior and vehicle parameters. Usually, the more parameters a simulator have, more time required to calibrate the model to obtain a desired level of accuracy.
3.3 Grading Scheme A grading method is used for evaluating simulators so that the degree of subjectivity in the selection process is reduced. According to this method, the evaluation can be fulfilled by assigning scores to features of interest on a scale of zero to ten based on predetermined criteria. Grading is a two-step process: Assign weighting factors to each of the features based on their levels of importance to users. Assign grade/score to each of the feature of evaluation. A user can assign a weighting factor between zero and ten based on his/her priorities. A weighting factor of ten for a feature implies that the feature is of highest priority to the user. Similarly a weighting factor of zero implies that the feature is not useful. While assigning scores to each feature of interest, one has to take into account both the availability of the feature in the simulator and the ease of incorporating it. A score of ten implies that a feature is directly available in the simulator and it is easy to incorporate that into the model. A value between zero and ten can be assigned as a score if a feature is not directly available in the simulator although it can realize that feature in an indirect method. Once again the accuracy of the indirect method and the difficulty of incorporating it guide the scores. The evaluation result for a particular category can be determined by taking the weighted sum of the grades for that category.
3.4 Advantages and issues The advantage of using the procedure described above when it comes to selection of a simulator is that while being comprehensive the procedure allows for consideration of the user’s priorities. Moreover, users can reach a deterministic decision for selecting simulators that meet their needs. Although the simulator selection is deterministic, the procedure is still subjective in the sense that different users may assign different grades and weights to the same feature.
9
Chapter 4 – Implementation of the Procedure The procedure described in the earlier section was used by two different users to select their desired simulator. Two of the best regarded simulators, AIMSUN and VISSIM were used to model a real freeway section and the evaluation results were later compiled in a table to demonstrate the fact that different users can select different simulator based on their priorities. The rest of this section describes the details of this implementation and also identifies some of the reasons as to why the two users selected different simulators.
4.1 Simulator Overview AIMSUN (Advanced Interactive Microscopic Simulator for Urban and Non-urban Networks), developed at the Department of Statistics and Operational Research, Universitat Poletecnica de Catalunya, Barcelona, Spain, is a microscopic simulator that can reproduce real traffic conditions of different traffic networks on a computer [10]. In the model, the behavior of every single vehicle is continuously modeled throughout the simulation period, according to several driver behavior models such as car following, lane changing and gap-acceptance models. AIMSUN is embedded in GETRAM, a simulation environment composed of a traffic network editor (TEDI), a network database, a module for performing simulation and an Application Programming Interface which aims at interfacing to other simulation or assignment models. Through an additional library of DLL functions, the GETRAM extensions, the model is capable of communicating with external user-defined applications such as real-time control logic. The model provides very detailed capabilities of modeling traffic network: it can distinguish between different types of vehicles; it can model traffic demands based on traffic flows and turning proportions or origin-destination (OD) matrices and route selection models; it can deal with a wide range of roadway types in arterial and freeway systems; it can model different traffic control types including not only fixed time control but also actuated and adaptive control through the use of the extension applications; it can also model impact of incidents and Variable Message Signs (VMS). Due to its detailed vehicle modeling, AIMSUN can replicate any kind of traffic detector to collect the basic measurements such as vehicle counts, occupancy, presence, speed and density at any 10
aggregation level defined by users. AIMSUN version 4.1.3 was used in this study by the users. VISSIM, a German acronym for “traffic in towns – simulation,” is a stochastic microscopic simulation model developed by Planung Transport Verkher (PTV), a German company [11]. It is a time-step and behavior-based simulation model developed to model urban traffic and public transit operations. The model consists internally of two components that communicate through an interface. The first one is the traffic simulator, which is a microscopic traffic flow model that simulates the movement of vehicles and generates the corresponding output. The second component, named as the signal state generator, updates the signal status for the following simulation step. It determines the signal status using the detector information from the traffic simulator on a discrete timestep basis (It varies from 1 to 10 steps per second), and passes the status back to the traffic simulator. The inputs in VISSIM include lane assignments and geometries, demands based on OD matrices or flow rates and turning percentages by different vehicle types, distributions of vehicle speeds, acceleration and deceleration, and signal control timing plans. Signal control can be fixed, actuated or adaptive control using VAP. The model is capable of producing measures of effectiveness commonly used in the traffic engineering profession like total delay, stopped-time delay, stops, queue lengths, fuel emissions, and fuel consumption. The model has been successfully applied as a useful tool in a variety of transportation projects such as development and evaluation of transit signal priority logic, the evaluation and optimization of traffic operations in a combined network of coordinated and actuated traffic signals, analysis of slow speed weaving and merging areas, and so on. VISSIM version 3.61 was used in this study.
4.2 Test Site and Data Description The test site used by the two users is an 8-mile section of I-494 between East Bush lake road and 34th avenue in both the directions. I-494 is the southern half of a circumferential route around the Twin Cities, and serves as a collector/distribution facility for other metropolitan area highways, as well as an urban bypass for interstate or interregional trips. Figure 2 shows a schematic representation of the test site. Most parts
11
of the mainline section on this freeway consist of three lanes with 12 weaving sections. It has 29 entrance ramps, all of which are metered during peak hour periods. The metered ramps include one High Occupancy Vehicle (HOV) bypass and two freeway to freeway ramps from I-35W. To accurately code roadway geometry in the simulators AIMSUN and VISSIM, some background maps are usually needed. Smaller background maps are required so that the basic geometric elements including the number of lanes, the start/end points of ramps and weaving sections and stop lines are distinguishable. Aerial photographs obtained from the Metro Council of the Twin Cities, Minnesota, meet such requirements, and thus were used by the users. Demand data in the form of 15-miute loop detector counts for two different days obtained from MnDOT were used for the calibration and validation of the models. Vehicles were classified into three categories cars, trucks and semi-trailers. The demand data was from the “metering shut down study” period of November 2000. Therefore, no ramp meters were used to control the traffic entering the freeway.
4.3 Calibration Simulator calibration is an iterative process in which appropriate simulator parameters are adjusted in order to get an acceptable match between simulated results and the corresponding field data given that they have the same boundary conditions. Based on the available loop detector data and existing freeway geometry, the calibration of both models was accomplished in two trial and error stages, namely volume-based and speedbased calibration as suggested in [12] by the users. The reasons for selecting this procedure was that it was successfully implemented for calibrating and validating AIMSUN in earlier studies [12, 13] and is also consistent with the data available for Twin Cities networks. According to this method, the volume-based calibration aims to obtain simulated mainline station volumes as close as possible to the actual mainline station volumes. The volume calibration mainly involves the adjustment of global parameters like simulation step and reaction time, parameters related to traffic flow models, and vehicle parameters such as desired acceleration rates, speeds and so on. The objective of speed-based calibration is to obtain simulated mainline station speeds as close as possible
12
to the actual mainline speeds and identify the bottleneck locations along the road as well. The major tasks involved in this stage include calibrating local parameters such as speed limit for each section, speed reduced areas, grades and lane change parameters. Two main goodness of fit statistical measures mentioned earlier, RMSEP (Root Mean Squared Error Percent) and correlation coefficient were used for judging the effectiveness of calibration to replicate the observed volumes at different mainline stations. Apart from the statistics mentioned above, speed contours along the mainline of the freeway, actual and simulated, were compared during the speed calibration.
4.4 Results Table 1 shows the average value of these measures from different freeway mainline detector stations before and after the calibration for volume comparisons. Also shown in Table 1 below the average values in parenthesis is the range of the observed values over different mainline stations. The values of the observed goodness of fit measures suggest that the errors prior to calibration are unacceptably high indicating the need for calibration. It can also be seen that the accuracy for both simulators is similar both before and after the calibration. The improvement in accuracy is substantial after the first stage of calibration whereas the improvement after the second stage is not significant. When checking the contour maps in the speed calibration, the actual speed contour indicated that the upstream of the Eastbound (EB) direction was congested during most of the simulation period while the Westbound (WB) was not congested. The discrepancy between real and simulation speed contours on the EB was caused by the fact that simulators are not capable of capturing congestion patterns at boundaries. Therefore the users used only the WB results which were satisfactory for both the simulators. Speed contours for the westbound direction are shown in figure 3 which indicates a reasonable match between observed and simulated speeds along the mainline stations for both the simulators. Demand data from a different date was employed to test the validity of the calibrated models. The validation results are also presented in Table 1 which includes the average values of the two measures of effectiveness used. The values suggest that the
13
simulators are capable of replicating volumes observed in reality. Plots of speed contours suggested that both simulators are capable of replicating observed speeds to a satisfactory level. Table 2 shows a comparison of the qualitative features of the two simulators. The table indicates whether or not a particular feature is directly available in the simulators AIMSUN and VISSIM and suggests that most of the standard traffic modeling requirements can be modeled with both the simulators. Tables 3A and 3B summarize the grades and weights for each simulator by both users. The results indicate that different users usually have different preferences and therefore select different simulators although there are only some minor differences in the features and accuracy of the models. These preferences in general are dictated by the user’s modeling requirements and time availability. From tables 3A and 3B it is evident that user 1 places a higher priority on freeway modeling as suggested by his use of higher weights for features related to that, and lower stress on the public transportation which is reflected in his use of lower weights for features related to public transportation. In contrast user 2, places higher priority on transit applications as reflected by his use of higher weights for that feature.
14
Chapter 5 – Conclusions This paper presented a comprehensive procedure for selecting a microscopic simulator among several alternatives. The procedure uses both qualitative and quantitative evaluation criteria and incorporates room for the user’s priorities by assigning weights to each feature of evaluation. A real-life implementation of the proposed procedure was carried out to illustrate its applicability. Two users employed this procedure to select their preferred simulator from two of the widely used simulators AIMSUN and VISSIM. It was found that both simulators are capable of incorporating most of the standard features used in traffic modeling. The accuracy of both simulators was found to be similar. It was observed during this study that data entry for large networks is a time-consuming process. There is a need for the developers of simulation models to provide users with application tools capable of converting standard traffic data available into the formats required by the models. It was also observed that several calibration methodologies exist for different models. This highlights the need for a calibration procedure that takes into account typical data available and is consistent with traffic engineering practices. The illustrated scenario deals primarily with freeways but the methodology can be employed as well for selecting a simulator for urban projects. Although the evaluation procedure was used for selecting a simulator from two options, it is general and applicable for selecting any simulator among several alternatives. The selection of a simulator by different users even for the same site may lead to the selection of different simulators. The reasons are twofold. On the one hand, the evaluation process is subjective which affects the grades of all criteria. On the other hand, different needs dictate different weights by the users further differentiating the simulators. Both contribute toward the selection of the most appropriate simulator for a particular situation and/or user.
15
REFERENCES 1. Traffic Analysis Tools Primer, 2003, FHWA 2. University of Leeds (2000), Final Report for Publication, SMARTEST Project Report, http://www.its.leeds.ac.uk/projects/smartest 3. Schmidt, K., (2000) Dynamic Traffic Simulation Testing, Traffic Technology International, January 2000. 4. Boxill, S.A., Yu, L., (2000) An Evaluation of Traffic Simulator Models for Supporting ITS Development, Center for Transportation Training and Research, Texas Southern University, October 2000. 5. Moen, B., Fitts, J., Carter, D., Ouyang, Y., (2000) A Comparison of the VISSIM Model to Other Widely Used Traffic Simulation and Analysis Programs. http://www.itc-world.com/library.htm 6. Sommers, K.M., (1996) Comparative Evaluation of Freeway Simulation Models, MS thesis, University of Minnesota, November 1996. 7. Bloomberg, L., Dale, J., (2000) A comparison of the VISSIM and CORSIM Traffic Simulation Models on a Congested Network, 79th annual meeting of the Transportation Research Board, Paper # 00-1536 8. Prevedouros, P., D., Wang, Y., (1999) Simulation of Large Freeway and Arterial Network with CORSIM, INTEGRATATION, and WATSim, 1678 pp197-207, TRR, 1999. 9. AIMSUN user manual, V4.1.3 , 2003. 10. Planung Transport Verkehr AG, 2002 “Vissim User Manual, V3.61”, Germany. 11. Kottommannil, J.V., (2002) Development of Practical Methodologies For Streamlining the Traffic Simulation Process, MS thesis, University of Minnesota 12. Hourdakis, J., Michalopoulos, P.G. (2002) Evaluation of Ramp Control Effectiveness in Two Cities Freeways, Transportation Research Board 2002 Annual Meeting, January 2002. 13. Hourdakis, J., Michalopoulos, P.G. Kottommannil, J.V (2003) “A Practical Procedure For Calibrating Microscopic Simulation Models”, Transportation Research Board 2002 Annual Meeting, January 2003.
16
Evaluation criteria
Qualitative
Functional capabilities
Input/output features
Geometrics Demand options Traffic control Transit applications Incident management Other Input requirements Output Characteristics
Geometrics 1. Auxiliary lanes (F)* 2. Weaving sections (F) 3. Major fork areas (F) 4. Cloverleaf interchanges (F) 5. Roundabouts (A) 6. U-turns (A) 7. HOV lanes (C) 8. Diamond interchanges (C) 9. Single point interchanges (C) 10. C-D roads (C)
Demand options
Transit applications 1. Bus routes 2. Bus stops 3. Stop times 4. Shoulder use applications
Other 1. Max. simulation period 2. Max. network size 3. Error message effectiveness 4. Background mapping formats 5. Max. num. of lanes**
1. Pre-timed signal 2. Actuated/Semi-actuated 3. Adaptive control signals 4. External interface timing plan 5. Basic ramp metering 6. Ramp metering algorithms 7. Stop/Yield signs
Incident management 1. Lane blocking 2. Capacity reduction
1. Output file formats 2. Animation of results 3. Traffic related MOE’s 4. Environmental MOE’s Specific
1. Geometry data 2. Traffic demand data 3. Control data 4. Public transportation data
Note: * F: Freeway; A: Arterials; C: Common ** In one direction
1. Flow rate and turning data 2. Origin destination data
Figure 1A Evaluation criteria framework A-1
General
Output characteristics
Output characteristics
Traffic control
Major
Evaluation criteria
Quantitative
Qualitative
Ease of use
Quality of service
Major
Calibration performance
General Input Effort Software related Learning curve
Input effort
Software related
1.Geometrics 1.Tools/aids availability 2.Traffic demand 2.Software environment 3.Signal control 4.Transit application
Level of service
Parameters
1.Resource materials 2.Training course 3.User group support 4.Technical support
Parameters
Completion time
Completion time
Accuracy
Accuracy
1. Global parameters 1. Data preparation 1.Volume statistics 2. Local parameters 2. Calibration 2.Speed contour figures /Validation 3. Vehicle parameters 3. Execution time
Figure 1B Evaluation criteria framework (cont.) A-2
Specific
Figure 2: Schematic of the test site
A-3
Figure 3: Speed Contours on I-494 WB: real and simulated Figure 3: Speed Contours on I-494 WB: real and simulated Figure 3: Speed Contours on I-494 WB: real and simulated
Figure 3: Speed Contours on I-494 WB: real and simulated
A-4
Simulator
Before Calibration
After Volume Calibration
After Speed Calibration Percent Improvement
Root Mean Square Error Correlation Coefficient Percent East Bound
West Bound East Bound
West Bound
AIMSUN
0.12 (0.02, 0.19)* 0.13 (0.06, 0.20) 0.04 (0.00, 0.08) 0.05 (0.00, 0.08) 0.04 (0.01, 0.07) 0.04 (0.01, 0.08) 66%
0.17 (0.10, 0.24) 0.22 (0.13, 0.26) 0.07 (0.00, 0.10) 0.08 (0.01, 0.12) 0.06 (0.00, 0.09) 0.06 (0.01, 0.09) 76%
0.74 (0.34, 0.98) 0.73 (0.30, 0.96) 0.95 (0.87, 1.00) 0.94 (0.84, 1.00) 0.96 (0.90, 1.00) 0.95 (0.84, 1.00) 15%
0.52 (0.30, 0.81) 0.43 (0.83, 1.00) 0.94 (0.73, 1.00) 0.86 (0.73, 1.00) 0.95 (0.88, 1.00) 0.93 (0.82, 1.00) 82%
VISSIM
69%
81%
21%
116%
AIMSUN
0.04 (0.00, 0.08)
0.06 (0.01, 0.08)
0.97 (0.88, 1.00)
0.97 (0.89, 1.00)
VISSIM
0.04 (0.00, 0.08)
0.05 (0.01, 0.07)
0.97 (0.87, 1.00)
0.96 (0.88, 1.00)
AIMSUN VISSIM AIMSUN VISSIM AIMSUN VISSIM
Validation
*observed range of statistic Table 1: Goodness of fit measures for I-494 mainline Volumes
A-5
Category
Major criteria
General criteria
Specific criteria
Auxiliary lanes (F)* Weaving sections (F) Major fork areas (F) Cloverleaf interchanges (F) Roundabouts (A) Geometrics U-turns (A) HOV lanes (C) Diamond interchanges (C) Single point interchanges (C) C-D roads (C) Flow rate and turning data Demand options Functional capabilities Origin destination data Pre-timed signal Actuated/Semi-actuated ♦Qualitative Traffic control External interface timing plan Basic ramp metering Stop/Yield signs Bus routes Bus stops Transit applications Stop times Shoulder use applications Lane blocking Incident management Capacity reduction
Quality of service
Quality of service
Resource materials Training course User group support Technical support
Note F: Freeways; A: Arterials; C: Common ♦: Directly available; Ο: Indirectly available.
Table 2: Feature availability in AIMSUN and VISSIM
A-6
AIMSUN VISSIM ♦* ♦ ♦ ♦ ♦ ♦ ♦ ♦ ♦ ♦ ♦ ♦ ♦ ♦ ♦ ♦ ♦ ♦ ♦ ♦ Ο Ο Ο ♦ ♦ ♦ ♦
♦ ♦ ♦ ♦ ♦ ♦ ♦ ♦ ♦ ♦ ♦ ♦ ♦ ♦ ♦ Ο ♦ ♦ ♦ ♦ Ο Ο Ο ♦ ♦ ♦ ♦
Category Major criteria
General criteria
Geometrics
Demand Options
Qualitative
Functional Capabilities
Traffic Control
Transit Applications Incident Management
Other
Specific criteria Auxiliary lanes (F)* Weaving sections (F) Major fork areas (F) Cloverleaf interchanges (F) Roundabouts (A) U-turns (A) HOV lanes (C) Diamond interchanges (C) Single point interchanges (C) C-D roads (C) Flow rate and turning data Origin destination data Pre-timed signal Actuated/Semi-actuated Adaptive control signals External interface timing plan Basic ramp metering Ramp metering algorithms Stop/Yield signs Bus routes Bus stops Stop times Shoulder use applications Lane blocking Capacity reduction Background mapping formats Max. num. of lanes**
W
8 10 10 10 4 4 10 8 8 10 10 10 10 10 10 10 10 10 10 6 6 6 6 10 10 8 10 10 Max. simulation period 10 Max. network size Error message effectiveness 10
User 1 Score A V 9 9 10 10 10 10 10 10 9 8 10 10 9 9 10 9 10 8 10 10 8 8 10 10 10 10 9 8 9 9 9 8 9 4 9 7 10 7 10 10 10 10 8 9 9 9 8 5 8 8 10 8 10 10 10 10 9 9 8 7 2460 2262
Note F: Freeways; A: Arterials; C: Common Table 3A: Example implementation of the procedure
A-7
W 8 10 10 10 6 8 10 10 10 10 10 10 10 10 10 10 10 5 10 10 10 10 10 5 5 5 8 8 8 8
User 2 Score A V 9 9 10 10 10 10 10 10 9 9 10 10 9 9 10 10 9 9 10 10 9 9 10 10 10 10 9 9 9 9 9 9 9 9 9 9 10 10 10 10 10 10 7 10 9 9 10 9 8 8 10 10 10 10 10 10 9 9 8 8 2477 2502
Category
Major criteria
Input/output Features
User 1 Score A V 9 8 7 8 9 9 9 8
General criteria
Specific criteria
Input Requirements
Geometry data Traffic demand data Control data Public transportation data
Output Characteristics
Output file formats Animation of results Traffic related MOE’s Environmental MOE’s
10 10 10 6 10 10 8 8 10 7 3 10
Geometrics Traffic demand Signal control Transit application Tools/aids availability Software environment Learning curve
10 10 10 6 10 4 10
W
562
Input Effort
Qualitative Ease of Use
Software Related Characteristics Learning Curve
7 7 8 8 7 9 9 464
Quality of Service
Quality of Service
Resource materials Training course User group support Technical support
10 9 4 9 9 10 10 10 316
Involved Parameters Calibration Quantitative Testing
Completion Effort Accuracy
Global parameters Local parameters Vehicle parameters Data preparation Calibration/Validation Execution time Volume statistics Speed contour figures
9
10 10 10 10 10 10 10 10
8
8 8
9 10
9 9 700
Table 3B: Example implementation of the procedure
A-8
7 9 5 8 520 9 7 8 9 7 10 9 494 8 9 10 10 306 6 6 8 8 8 9 9 9 630
10 10 10 10 8 10 8 3
User 2 Score A V 9 9 9 9 9 9 7 9 10 9 7 9 5 5 9 9 557 9 8 9 9 8 8 9
589
10 10 10 10 10 10 10
620
10 10 10 10
600 9 9 10 10
380
10 10 10 10 10 6 10 10
380 8 8 8 8 8 10 9 9 640
660
W
9 8 9 9 8 10 9 9 9 10 10 9 9 8 8 8 10 9 9