Research
Methods
Blackwell Publishing, Ltd.
Three-dimensional modelling of wheat endosperm development Eva Wegel1, Emma Pilling1, Grant Calder, Sinéad Drea, John Doonan, Liam Dolan and Peter Shaw Department of Cell and Developmental Biology, John Innes Centre, Norwich Research Park, Colney Lane, Norwich NR4 7UH, UK; 1These authors contributed equally to the publication
Summary Author for correspondence: Peter Shaw Tel: +44 1603 450330 Fax: +44 1603 450022 Email:
[email protected] Received: 29 March 2005 Accepted: 24 May 2005
• We have developed methods, based on confocal microscopy and three-dimensional (3D) modelling, for the analysis of complex tissues and individual nuclei. These methods were used to study the development of early wheat (Triticum aestivum) endosperm as a whole and of endosperm nuclei undergoing polyploidization. • Fixed sections of immature caryopses were either stained with SYTOX Green or used for fluorescence in situ hybridization (FISH) to visualize centromeres, telomeres and a rye chromosome arm substitution. Each section was imaged as a confocal image stack. By using AMIRA 3.0 for computer image processing, rendered models were produced of the whole endosperm and of individual nuclei. • We followed endosperm development up to the formation of a complete syncytium, which develops via a dorsal and a ventral plate of nuclei in the central cell. Modelling of nuclei showed that wheat chromosomes are not anchored to the nuclear membrane and become more randomly positioned in endoreduplicated nuclei. • This analysis produced a precise description of the positioning of nuclei throughout the developing endosperm and of chromosomal domains in single nuclei. Key words: 3D modelling, centromere, endosperm, telomere, wheat (Triticum aestivum). New Phytologist (2005) 168: 253–262 © New Phytologist (2005) doi: 10.1111/j.1469-8137.2005.01503.x
Introduction The endosperm of wheat (Triticum aestivum) originates from the fusion of the two haploid polar nuclei of the central cell in the embryo sac with one haploid sperm nucleus. The first division of the resulting triploid nucleus occurs c. 5 h after pollination (Bennett et al., 1973). From then on, synchronous nuclear divisions without the formation of cell walls lead to a syncytium lining the walls of the central cell (Brenchley, 1909; Percival, 1921; Bennett et al., 1973; Mares et al., 1975; Huber & Grabe, 1987a). For the bulk of the endosperm, cell wall formation starts from the periphery on day 4 after pollination, via the formation of open-ended alveoli that grow towards the centre of the endosperm, and is completed by day 7 (van Lammeren,
www.newphytologist.org
1988). Cell divisions continue until 12–14 d post-anthesis (dpa) (Huber & Grabe, 1987b). This so-called nuclear type of endosperm development, which is characterized by a limited or permanent phase of free-nuclear division, is found in cereals and Arabidopsis (Olsen et al., 1992; Olsen, 2004), as well in other plants. Other than in maize, no detailed cytological analysis has been undertaken to understand the steps leading to the development of the complete syncytium in cereals and even there the available evidence is based on single thin sections through the endosperm (Randolph, 1936). For Arabidopsis, whole-mount techniques have been developed to analyse endosperm development (Boisnard-Lorig et al., 2001; Brown et al., 2003; Garcia et al., 2005). Cereal endosperm, however, is too large and too
253
254 Research
Methods
deeply embedded in a complex caryopsis for a similar approach. To fully understand the development of cereal endosperm, and ultimately the genes controlling it, we have developed methods that allow a detailed analysis of this tissue at the cellular level by using confocal microscopy and computer-aided threedimensional (3D) modelling. From studies of the early stages of wheat endosperm development, we conclude that endosperm nuclei first form a dorsal and a ventral plate in the periphery of the central cell. By 2 dpa, synchronous divisions connect the plates to form a complete syncytium by 4 dpa. After cellularization, some nuclei in the central starchy endosperm undergo two or three rounds of DNA replication, taking the DNA content up to 12C or 24C. This leads to increases in the number of chromosome arms (polyteny) and of complete chromosome sets (polyploidy) (Brunori et al., 1989; Wegel & Shaw, 2005). Chromosome arms in wheat nuclei are arranged in a Rabl configuration, spanning the nucleus with telomeres and centromeres at opposite poles (Abranches et al., 1998; Martínez-Pérez et al., 1999; 2001; Wegel & Shaw, 2005). In situ hybridization and confocal imaging, combined with 3D modelling, allowed us to track changes in nuclear shape and chromosome positioning during endosperm development, which were not detected without the modelling step.
Materials and Methods Plant material Wheat (T. aestivum L. cv. Savannah) was used for the analysis of endosperm development. Plants were grown from seed in a controlled-environment room under the following conditions: 16-h light : 8-h darkness, 18°C temperature and 70% relative humidity. After 4–5 wk, seedlings were vernalized for 6 –8 wk at 10°C, with an 8-h photoperiod, and then returned to the controlled-environment room. For the in situ hybridization experiments, cv. Pro INTA Federal with a 1RS (Secale cereale) chromosome arm substitution for the 1BS wheat chromosome arm (1Bl/1Rs) was used. Plants were grown under the same conditions as Savannah, but without vernalization. Seed sections To maximize reproducibility, only the outer caryopses in spikes in the centre of the ear were used, as these develop earliest and become the biggest ones in the spike. Individual flowers were checked twice daily for anthesis. Flowers and immature caryopses were harvested before anthesis, at 0.5, 1, 2, 3 and 4 dpa for the study of whole endosperm development, and at 7 and 16 dpa for the analysis of individual nuclei. The material was fixed for 6 h or overnight in 4% (w/v) formaldehyde, freshly made from paraformaldehyde, in PEM (50 mM PIPES, 5 mM EGTA, 5 mM MgSO4, pH 6.9), with or without 5% (v/v) dimethylsulfoxide (DMSO). Fixed seeds were dehydrated through an ethanol : water series (10%, 20%, 40%, 60%, 80% and 100% for 4–
New Phytologist (2005) 168: 253–262
12 h per step) and stored in 100% (v/v) ethanol at 4°C. Sections of 100 and 200 µm for in situ hybridization and endosperm modelling, respectively, were prepared under 100% (v/v) ethanol by using a Vibratome Series 1000plus (TAAB Laboratories Equipment Ltd, Aldermarston, UK) and rehydrated in water. Consecutive sections were allowed to dry on poly lysine-coated slides (BDH, Poole, UK). In initial studies, seeds were waxembedded before sectioning, but the wax could not be completely removed from the sections, which hampered subsequent staining and labelling. We observed no differences in structural preservation between wax-embedded and nonembedded material. Nuclear staining for endosperm modelling Slides were treated with RNase A (10 mg ml−1; Sigma, Poole, UK) for 2 h at 37°C, washed in water and stained with 5 nM SYTOX Green (Molecular Probes, Leiden, the Netherlands) for 20 min. After a further wash in water, they were mounted in Vectashield (Vector Laboratories, Burlingame, CA, USA) and stored at 4°C. Pretreatments for in situ hybridization Sections were incubated, for 1 h at room temperature, with 1% (w/v) driselase (Sigma), 0.5% (w/v) Onozuka R10 cellulase (Yakult Pharmaceutical Ind. Co. Ltd, Tokyo, Japan) and 0.025% (w/v) pectolyase Y23 (Kikkoman, Tokyo, Japan), in phosphatebuffered saline (PBS) (1.6 mM NaH2PO4, 15 mM Na2HPO4, 150 mM NaCl, pH 7.4), and then washed in Tris-buffered saline (TBS) (10 mM Tris, 140 mM NaCl, pH 7.4) for 10 min. They were then treated with RNase A [100 µg ml−1 in 2 × SSC (SSC: 300 mM NaCl, 30 mM sodium citrate, pH 7.0); Sigma] for 1 h at 37°C, washed in TBS for 10 min, dehydrated in an ethanol : water series (70% and then 100% ethanol) and air-dried. Probes and in situ hybridization Total rye genomic DNA was partly digested with TaqI and the fragments were then labelled with biotin-16-dUTP (Roche Diagnostics Ltd, Lewes, UK) by nick translation. Telomeric probes labelled with biotin-16-dUTP (Roche) were prepared according to Cox et al. (1993). Centromeric probes labelled with digoxigenin-11-dUTP (Roche) were prepared according to Aragón-Alcaide et al. (1996), using the following primers for the CCS1 repeat fragment: 5′-CGCAATATCTTGATTGCATCTATATTC-3′ (positions 17–43) and 5′-GCTGGTAGTGAAAAGGTGCCCGATCTT-3′ (positions 249–223). Sections were first treated with the avidin/biotin blocking kit (Vector Laboratories), according to the manufacturer’s instructions, by using a biotin-blocking step followed by avidin and biotin, respectively, to block biotin-binding sites in the tissue. After a final wash in PBS, fluorescence in situ hybridization (FISH) was performed according to a a slightly modified version of that described by Abranches et al. (2000), using 200 ng of
www.newphytologist.org © New Phytologist (2005)
Methods
each probe in a total volume of 30 µl per slide in a hybridization buffer containing excess (×20) salmon-sperm DNA in 50% (v/v) formamide, 10% (w/v) dextran sulfate, 2 × SSC and 0.1% (v/v) sodium dodecyl sulfate (SDS). The probe was denatured in the hybridization mixture for 5 min at 95°C. Sections were denatured at 75°C for 8 min in a modified thermocycler (Omnislide; Hybaid, Ashford, UK), and hybridization was carried out overnight at 37°C. Posthybridization washes were carried out at 42°C in 0.1 × SSC containing 20% (v/v) formamide. Immunodetection Biotin-labelled probes were detected with Extravidin-Cy3 (Sigma). Probe labelled with digoxigenin was detected by using a mouse anti-digoxin immunoglobulin (Sigma) followed by a secondary goat anti-mouse immunoglobulin conjugated to Alexa Fluor® 488 (Molecular Probes). Antibodies were diluted in 4 × SSC containing 0.2% (v/v) Tween 20, according to the manufacturer’s instructions. Antibody incubation was performed in a humid chamber for 1 h at 37°C followed by 3 × 5-min washes at room temperature in 4 × SSC containing 0.2% (v/v) Tween 20. Sections were counterstained in 1 µg ml−1 DAPI (4′,6-diamidino-2-phenylindole) for 10 min. Slides were mounted in Vectashield (Vector Laboratories). Image acquisition and analysis Sections were imaged on a Leica TCS SP2 confocal microscope (Leica Microsystems GmbH, Heidelberg, Germany). DAPI was excited with the 363- and 351-nm lines from a high-powered Argon ion laser in early experiments. Later, this was replaced with a blue diode laser (405 nm). Alexa-488 and SYTOX Green were excited at 488 nm from an Argon ion laser, and Cy3 was excited at 543 nm from a Helium/Neon laser. SYTOX Green fluorescence was collected by using a ×10/0.4 Imm objective, which allowed us to focus through tissue with a thickness of 200 µm. Triple fluorescent images of nuclei after in situ hybridization were collected by using a ×40/1.25 oil objective with a working distance of c. 100 µm. For the in situ hybridization experiments, confocal sections were collected at increments of 0.6 µm. For endosperm modelling, confocal sections were collected at increments of 5 µm, which ensured that every nucleus was visible in at least two consecutive sections. For endosperm modelling, each vibratome section was scanned through from top to bottom as one stack or, where the whole endosperm did not fit in the field of view, as multiple stacks overlapping in x and y with identical z positions. The overlapping stacks were combined and aligned in x and y by using the merge tool of the Leica confocal software to create a single stack encompassing all the endosperm and surrounding cells. This process was repeated for as many consecutive vibratome sections as were needed to cover the entire depth of the endosperm. All the confocal stacks for the entire endosperm were then combined in one file and exported as a single multiple-
© New Phytologist (2005) www.newphytologist.org
Research
image (export volume) TIFF file. The confocal sections from different physical vibratome sections were not aligned with each other at this stage, and a final alignment of all slices of the stack in x and y was carried out by using the ALIGNSLICES module of AMIRA 3.0. An aligned data set of a 4 dpa central cell comprised 1701 × 1134 × 97 pixels and 150–200 Mb. The LABELVOXEL module in AMIRA was used to determine the threshold nuclear fluorescence. In the image segmentation editor, different tissues – seed coat, endosperm, embryo and antipodals – were defined and colour-coded by outlining the nuclei (endosperm, embryo, antipodals) or the whole tissue (seed coat). Surfaces for each nucleus were generated by resampling and triangulation (SURFACEGEN module in AMIRA). For the analysis of individual nuclei, confocal stacks were cropped to single nuclei and the channels were aligned in z in IMAGEJ (a public domain program of W. Rasband available from http://rsb.info.nih.gov/ij/). It was necessary to determine z alignment between the ultraviolet (UV)/far blue and visible green/red channels owing to the chromatic aberration inherent in the objective used for this study, and the z alignment was carried out by adding or removing sections at the beginning and end of each stack. In the AMIRA 3.0 software, channels were combined in a MultiChannelField and displayed by using the Voltex module. The positions of centromeres and telomeres were analysed in orthogonal sections through nuclei by using the ORTHOSLICE module. C-values were estimated for individual nuclei from nuclear volume measurements by using the TISSUESTATISTICS module after thresholding in the LABELVOXEL module. Figures were composed by using Adobe Photoshop 7.0 (Adobe Systems Inc., Mountain View, CA, USA).
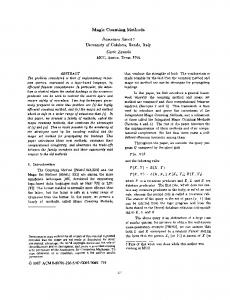
Results 3D modelling of early endosperm development We analysed 157 seeds aged from just before anthesis to 4 dpa. Figure 1 shows the plane of sectioning through the embryo sac and defines the terms used for spatial orientation in the following description. At the stages analysed, the tissue of interest comprised three to five physical sections, each of 200-µm thickness. For the earliest stages of endosperm development, the confocal
Fig. 1 Diagram of a young embryo sac with a plane of sectioning. a, antipodals; cc, central cell; e, embryo.
New Phytologist (2005) 168: 253–262
255
256 Research
Methods
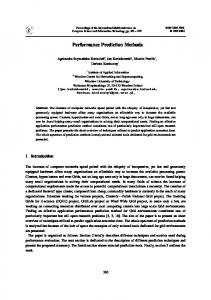
Fig. 2 Nuclear plate formation in early endosperm development. Projections of serial optical sections through immature seeds are shown after staining with SYTOX Green. All sections are shown with the chalaza at the top and the micropyle at the bottom. (a)–(d) One day postanthesis (dpa); (e) and (f) 2 dpa. (a) Two large nuclei are visible at the micropylar end (arrow head), presumably the zygote and one of the disintegrating synergids. (b) Two endosperm nuclei are seen in the centre of the section and two at the micropylar end (arrow head). (c) A stem of nuclei is formed around the zygote at the micropylar end and a small dorsal plate is attached to it. (d) In the same caryopsis, the first nuclei of the ventral plate (arrow heads) are seen near the antipodals. (e) Caryopsis with a larger dorsal plate than in (c), but without endosperm nuclei near the antipodals (f). a, antipodals; cc, central cell; en, endosperm nuclei; i, integuments; n, nucellus; p, pericarp. Bar, 250 µm.
stacks were easy to interpret as 3D images. At later stages, the tissue became more complex and it was therefore necessary to make 3D models of the nuclei. Because we scored anthesis as the emergence of the anthers from the flower, and pollination would have occurred earlier (i.e. after the release of pollen from anthers but before emergence of anthers from the flower), the timings given as dpa are only approximations for the times of fertilization. Before or just after anthesis, in addition to the antipodals the egg sac contained up to four large, weakly staining, nuclei at the micropylar end. These corresponded to the egg cell, the two synergids and the central cell (Fig. 2a). Endosperm nuclei were identified by their
New Phytologist (2005) 168: 253–262
elongated shape and were first seen at 1 dpa. At the earliest stage we observed three different populations of endosperm nuclei in different sections. These were found in three locations: a group of nuclei were located near the zygote; a further group of nuclei were located in the dorsal region of the egg sac; and another group of nuclei were found in the ventral region (Figs 2b and 3a). The zygote-associated nuclei formed a stemlike structure that connected this population with the dorsal nuclei, but not with the ventral nuclei (Fig. 2c,e). These groups may correspond to three distinct populations that are present within a single developing endosperm or they may illustrate variability in the spatial distribution of nuclei during early
www.newphytologist.org © New Phytologist (2005)
Methods
Research
Fig. 3 Coordinated nuclear divisions during syncytium formation. Projections of serial optical sections through immature caryopses after staining with SYTOX Green. Sections are shown with the chalaza at the top right corner and the micropyle at the bottom left corner. (a) One day postanthesis (dpa), eight endosperm nuclei, the products of the first three nuclear divisions, are found in the centre (arrow heads). (b) On 2 dpa, metaphases (star) and telophases (arrow head) are found towards the chalazal end of the central cell and no nuclear divisions are seen around the embryo at the micropylar end (arrow). a, antipodals; n, nucellus; p, pericarp. Bar, 500 µm.
endosperm development. At this 1-dpa stage, mitoses were observed in two specimens. In these examples, all endosperm nuclei had just undergone nuclear division and formed pairs of small nuclei, suggesting that mitosis is synchronized at this early stage of endosperm development (Fig. 3a). Only nuclei near the antipodals were observed in these specimens. The dorsal and ventral groups of nuclei developed into plates of nuclei (Fig. 2c,e). Where early dorsal and ventral plates were seen in the same caryopsis, the dorsal plates were generally more developed than the ventral plates, but dorsal plates without ventral plates were occasionally also found. It is possible that some material was lost during sectioning. In particular, we observed occasional loss of the inner dorsal seed coat and nucellus layers and of the adhering walls and cytoplasm of the central cell and the zygote. In embryo sacs with dorsal plates without the stem nuclei, which connect the dorsal plate to the zygote, neither zygote nor embryo was seen. This may indicate that material was lost during tissue processing. At the ventral side, the presence of antipodal nuclei was a good indicator that this part of the central cell was complete, as endosperm nuclei first appeared on either side of the antipodals (Fig. 2d,f). At 1 dpa, the complete dorsal plates plus stem contained, on average, 91 nuclei in central cells without the ventral plate [counts from four central cells, standard deviation (SD) = 4]. In central cells, with both dorsal and ventral plates, similar numbers of total endosperm nuclei were found (83, counts from four central cells, SD = 7). By 2 dpa, both dorsal and ventral plates of the nuclei were visible in the same central cell and the dorsal plate was connected to the embryo by a stem of nuclei. By this stage, dorsal and ventral plates were beginning to coalesce and nuclear divisions were largely synchronous in all regions except near the embryo, where few divisions were observed (Fig. 3b). The overall pattern of nuclei remained similar at 3 dpa (Fig. 4a). At 2–3 dpa, central cells contained between 200 and 400 nuclei. At 4 dpa, the entire periphery of the central cell was
© New Phytologist (2005) www.newphytologist.org
surrounded by a layer of nuclei, making the syncytium complete, and no cell divisions were observed (Fig. 4c). Complete syncytia contained c. 1000 nuclei. Movies of the models of both of these stages can be viewed as supplementary data. We conclude that syncytium formation starts generally with a dorsal plate of nuclei which is connected to the zygote. This is followed by, or in some cases preceded by, the formation of a ventral plate on either side of the antipodals. By 2 dpa, further synchronous divisions connect the plates to form a complete syncytium by 4 dpa, where no nuclear divisions are visible. 3D modelling of changes in chromosome organization related to increased C content in endosperm nuclei After cellularization, polyploidization occurs in some endosperm nuclei. 3D modelling of nuclei with DNA contents of 3C, 6C and 12C allowed us to visualize changes in nuclear shape and chromosome positioning in developing endosperm. With increasing C content, nuclear volumes increase predominantly in two directions, thereby changing the shape of the nuclei (Fig. 5) into disc-like structures. To determine whether the disc-shaped nuclei were artefacts of our fixation, sectioning, drying or imaging conditions, we compared the shapes of nucleoli, in nuclei lying at various angles to the focal plane and found no evidence of distortion (Fig. 6). In the majority of 3C and 6C nuclei, and in all 12C nuclei, centromeres and telomeres were located on opposite, flat sides (Fig. 5, Table 1). Movies of 3D reconstructions of nuclei with centromere and telomere labelling can be viewed as supplementary data. Orthogonal slices through 3D reconstructions showed that the majority of centromeres and telomeres are arranged at or close to the nuclear surface; crossovers to the other side were found to be rare (Fig. 7d), but some centromeres and telomeres were also found in the nuclear interior (Fig. 5g). This means that centromeres and telomeres are either not, or only transiently, anchored to the nuclear membrane.
New Phytologist (2005) 168: 253–262
257
258 Research
Methods
Fig. 4 Models of syncytia at 3 and 4 d postanthesis (dpa). (a) Incomplete syncytium with coordinated nuclear divisions at 3 dpa. (b –d) Tissue layers in complete syncytium and seed coat at 4 dpa.
Changes in chromosome structure during polyploidization were revealed when we labelled the rye arm substitution: chromosomes were aligned in 3C nuclei and were positioned more randomly in nuclei of higher ploidy. Reconstructions of nuclei in which the rye chromosome arms were labelled showed that in most 3C nuclei, the chromosome arms stretched from one flat side to the other (i.e. along the short axis of the nucleus). In a minority of nuclei, the rye arms were aligned along the long axis of the nucleus (Fig. 7a,c, Table 1). In 12C nuclei, while the position of the heterochromatic knobs indicated preservation of the Rabl conformation, rye chromosome arms often lay diagonally or perpendicular to the general direction of the telomere/centromere axis (Fig. 7b,d). The organization of
New Phytologist (2005) 168: 253–262
Table 1 Centromere/telomere and rye arm distribution along the long and short axes of endosperm nuclei
The positions of either centromeres and telomeres or rye arms were determined in three-dimensional (3D) reconstructions, and the DNA content was estimated based on nuclear volume in combination with centromere number or number of rye chromatids. C, carbon.
www.newphytologist.org © New Phytologist (2005)
Methods
Research
Fig. 5 Centromere and telomere organization in nuclei with increasing C content. (a), (b), (c) 3C nucleus, 7 d postanthesis (dpa); (d), (e), (f), (g) 6C nucleus, 16 dpa; and (h), (i), (j) 12C nucleus, 16 dpa. (a), (d), (h) Three-dimensional (3D) reconstructions of nuclei with centromeres in green, telomeres in red and chromatin counterstained with DAPI (blue) in frontal view. (b), (e), (i) The same view without DAPI (xy) and turned 90° (yz), showing separation of telomere and centromere signals along the z axis of the nuclei. (c), (f), (j) Side view of the nuclei showing DAPI staining only. With increasing C content, nuclear volumes increase predominantly in two directions, and telomeres and centromeres are arranged on the flat sides. While the majority of telomeres and centromeres are close to the nuclear membrane, some are found in the interior of the nucleus towards the opposite side, as shown in two orthogonal sections (g, arrow heads). Bar, 10 µm.
chromosomes in 6C nuclei was intermediate between that found in 3C and 12C nuclei. Movies of nuclei with rye chromosome arm labelling can be viewed as supplementary data. A combination of calcofluor and DAPI staining of 16 dpa endosperm sections showed that in the majority of nuclei,
© New Phytologist (2005) www.newphytologist.org
only part of the nuclear surface is pressed against the cell wall, while the rest extends into the cell lumen, which is filled with starch. Being less rigid than starch, nuclei at this stage are mostly flattened between starch granules, and the direction in which the nucleus is squashed is perpendicular to the centromere/ telomere axis (data not shown).
New Phytologist (2005) 168: 253–262
259
260 Research
Methods
Discussion Modelling of endosperm development
Fig. 6 Orthogonal slices through a DAPI-stained nucleus, showing no distortion of the nucleolus after confocal imaging.
In this article we have presented a new method for the histological analysis of the development of complex tissues. Precise description of development requires precise mapping of cells and nuclei. In large, complex structures, such as cereal endosperm, this presents severe technical challenges. In the past, complex tissues have been studied by making thin microtome sections, but this procedure necessarily only visualizes a small part of the tissue and loses 3D information. Reconstruction of serial thin sections is possible in principle, but in practice becomes impossibly time-consuming and is therefore rarely used. Confocal microscopy offers a solution to the problem of 3D optical imaging, and the method we have developed combines confocal imaging with sectioning of unembedded plant material into a series of sections, each 200 µm in thickness. The 3D stacks from each of the physical sections are then combined and aligned to form a complete 3D image, encompassing a greater thickness than confocal microscopy alone could achieve. In the early stages of endosperm development, this 3D image can be interpreted and displayed directly. At stages older than 2 dpa, the endosperm organization is too complex to visualize through confocal sections alone and we therefore modelled the positions of nuclei and nuclear divisions in 3D to analyse endosperm development until the mature syncytial stage (4 dpa). As an indication of the time involved, fixation and dehydration take 2–3 d, and 15 seeds can be sectioned and scanned on the confocal microscope in 2 d. The segmentation
Fig. 7 Rye chromosome arm organization. Three-dimensional (3D) reconstructions of two nuclei with rye chromosome arms in white and chromatin counterstained with DAPI. A prominent subtelomeric knob identifies the telomeric end of the chromosome arms. (a), (b) 3C nucleus, 7 d postanthesis (dpa), in frontal view and tilted; (c), (d) 12C nucleus, 16 dpa, in frontal view and tilted. Rye chromosome arms traverse the 3C nucleus, but in 12C nuclei they can be arranged almost horizontally (stars), or even flip over to the other side (arrow heads). Bar, 10 µm.
New Phytologist (2005) 168: 253–262
www.newphytologist.org © New Phytologist (2005)
Methods
analysis is the most time-consuming part and takes half a day to 1 d per seed. AMIRA was the only program we found that was capable of easily aligning the data within the composite stacks, which was vital because the stacks came from serial physical sections that could only be approximately aligned prior to confocal data collection. 3D imaging and modelling works best for objects with clearly defined surface boundaries. We used SYTOX Green as a nucleic acid stain for endosperm reconstructions because of its good penetration and defined fluorescent signal. In our context it proved superior to DAPI and other SYTOX stains. The differences in fluorescence intensity, shape and distribution density of endosperm, antipodal, embryo and seed coat nuclei enabled us to identify different tissues. The program has tools to aid segmentation, but most of the segmentation still has to be carried out manually depending on how well defined different tissues are and how much they overlap within a section. 3D analysis of individual nuclei We have shown here that the method we developed for the analysis and 3D reconstruction of complex tissues is equally applicable for the modelling of FISH signals in individual nuclei. Because of the diffuse distribution of chromatin in the interphase nucleus, clearly defined signals are difficult to obtain with FISH. However, reconstructions in AMIRA provided good positional information for rye chromosome arms, centromeres and telomeres. 3D models of individual nuclei were also made in IMAGEJ by using a simpler volume-projection algorithm. However, the results were not as easily interpreted and it was not possible to display several channels together or to rotate the reconstructions in arbitrary directions – a capability that is important when analysing these large and asymmetric nuclei. Counting of centromere and telomere numbers in a nucleus, on the other hand, was best performed in IMAGEJ on raw data because signal thresholding in AMIRA, to reduce background throughout the nucleus, may lead to signal loss. In general, it should be noted that the closer a fluorescent signal gets to the resolution limit of the microscope, the more difficult accurate modelling will be. We also made reconstructions of nuclei with large transgene loci after FISH of both the loci and their nascent transcript, but found that the differentiation between actively transcribing and silent regions of the transgene locus (i.e. between regions that were associated with a transcript and those that were not), was much clearer in overlays of several confocal sections of both channels in Photoshop. Early development of cereal endosperm In this article we have described the early steps in wheat endosperm development. We were not able to identify the position of the initial endosperm nuclei. However, Huber & Grabe (1987a) showed the the first two endosperm nuclei are located next to the zygote in the embryo sac. Both Brenchley (1909)
© New Phytologist (2005) www.newphytologist.org
Research
and Huber & Grabe (1987a) reported the formation of a syncytium, but gave no details. In the present study, we observed the formation of a stem-like group of nuclei close to the zygote and joined to a dorsal plate, which then merged with a ventral plate. In most, but not all, cases, nuclei started filling the dorsal plate before the ventral plate. The endosperm nuclei at the embryo interface were the earliest to stop dividing, at 2 dpa (Figs 3b and 4a), and to cellularize (Huber & Grabe, 1987a), while synchronous mitoses in other parts continued until the syncytium was complete. Maize is the only other cereal where syncytium development has been studied in any detail. There, the first three endosperm cell divisions occur close to the zygote (Randolph, 1936). The products of these divisions are located at the cell periphery and, concomitant with further, largely synchronous nuclear divisions, endosperm nuclei migrate to the opposite pole of the embryo sac, resulting in the formation of a complete syncytium. Further studies of wheat should now address the exact mode of cell wall development at the embryo end and later in the rest of the central cell. For studies of caryopses older than 4 dpa, this will require a motorized stage so that multiple images can be stitched together quickly and easily to visualize regions substantially larger than the field of view. In summary, we have shown that 3D modelling allows accurate descriptions of nuclear structure and position during endosperm development. The method we have developed for large tissues makes use of the increased depth resolution in confocal microscopy in combination with serial physical sections. Finally, the information in the sections is simplified and condensed into 3D reconstructions, which can be rotated, assembled and disassembled on screen.
Acknowledgements This work was supported by funding from the UK Biotechnology and Biological Science Research Council (BBSRC) and from Syngenta plc.
References Abranches R, Beven AF, Aragón-Alcaide L, Shaw PJ. 1998. Transcription sites are not correlated with chromosome territories in wheat nuclei. Journal of Cell Biology 143: 5–12. Abranches R, Santos AP, Wegel E, Williams S, Castilho A, Christou P, Shaw P, Stoger E. 2000. Widely separated multiple transgene integration sites in wheat chromosomes are brought together at interphase. Plant Journal 24: 713–723. Aragón-Alcaide L, Miller T, Schwarzacher T, Reader S, Moore G. 1996. A cereal centromeric sequence. Chromosoma 105: 261–268. Bennett MD, Rao MK, Smith JB, Bayliss MW. 1973. Cell development in the anther, the ovule, and the young seed of Triticum aestivum L. var. Chinese Spring. Philosophical Transactions and Proceedings of the Royal Society 266: 39–81. Boisnard-Lorig C, Colon-Carmona A, Bauch M, Hodge S, Doerner P, Bancharel E, Dumas C, Haseloff J, Berger F. 2001. Dynamic analyses of the expression of the HISTONE::YFP fusion protein in arabidopsis show that syncytial endosperm is divided in mitotic domains. Plant Cell 13: 495–509.
New Phytologist (2005) 168: 253–262
261
262 Research
Methods
Brenchley WE. 1909. On the strength and development of the grain of wheat (Triticum vulgare). Annals of Botany 23: 117–142. Brown RC, Lemmon BE, Nguyen H. 2003. Events during the first four rounds of mitosis establish three developmental domains in the syncytial endosperm of Arabidopsis thaliana. Protoplasma 222: 167–174. Brunori A, Forino LMC, Frediani M. 1989. Polyploid DNA contents in the starchy endosperm nuclei and seed weight in Triticum aestivum. Journal of Genetics and Breeding 43: 131–134. Cox AV, Bennett ST, Parokonny AS, Kenton A, Callimassia MA, Bennett MD. 1993. Comparison of plant telomere locations using a PCR-generated synthetic probe. Annals of Botany 72: 239–247. Garcia D, Fitz Gerald JN, Berger F. 2005. Maternal control of integument cell elongation and zygotic control of endosperm growth are coordinated to determine seed size in arabidopsis. Plant Cell 17: 52– 60. Huber AG, Grabe DF. 1987a. Endosperm morphogenesis in wheat: transfer of nutrients from the antipodals to the lower endosperm. Crop Science 27: 1248–1252. Huber AG, Grabe DF. 1987b. Endosperm morphogenesis in wheat: termination of nuclear division. Crop Science 27: 1252–1256. van Lammeren AAM. 1988. Structure and function of the microtubular cytoskeleton during endosperm development in wheat: an immunofluorescence study. Protoplasma 146: 18 –27. Mares DJ, Norstog K, Stone BA. 1975. Early stages in the development of wheat endosperm. I. The change from free nuclear to cellular endosperm. Australian Journal of Botany 23: 311–326. Martínez-Pérez E, Shaw P, Reader S, Aragón-Alcaide L, Miller T, Moore G. 1999. Homologous chromosome pairing in wheat. Journal of Cell Science 112: 1761–1769. Martínez-Pérez E, Shaw P, Moore G. 2001. The Ph1 locus is needed to ensure specific somatic and meiotic centromere association. Nature 411: 204–207.
Olsen OA. 2004. Nuclear endosperm development in cereals and Arabidopsis thaliana. Plant Cell 16: S214–S227. Olsen OA, Potter RH, Kalla R. 1992. Histo-differentiation and molecular biology of developing cereal endosperm. Seed Science Research 2: 117–131. Percival J. 1921. The Wheat Plant. London, UK: Duckworth. Randolph LF. 1936. Developmental morphology of the caryopsis in maize. Journal of Agricultural Research 53: 881–916. Wegel E, Shaw PJ. 2005. Chromosome organization in wheat endosperm and embryo. Cytogenetic and Genome Research 109: 175–180.
Supplementary material Supplementary movies for Figs 4, 5, 6 and 8 are available through the following links. http://jicbio.bbsrc.ac.uk/fig4.mpg (40 MB) http://jicbio.bbsrc.ac.uk/fig4small.avi (7 MB) http://jicbio.bbsrc.ac.uk/fig5.mpg (70 MB) http://jicbio.bbsrc.ac.uk/fig5small.avi (8 MB) http://jicbio.bbsrc.ac.uk/fig6a.mpg (2–3 MB) http://jicbio.bbsrc.ac.uk/fig6b.mpg (2–3 MB) http://jicbio.bbsrc.ac.uk/fig6d.mpg (2–3 MB) http://jicbio.bbsrc.ac.uk/fig6e.mpg (2–3 MB) http://jicbio.bbsrc.ac.uk/fig6h.mpg (2–3 MB) http://jicbio.bbsrc.ac.uk/fig6i.mpg (2–3 MB) http://jicbio.bbsrc.ac.uk/fig8a.mpg (2–3 MB) http://jicbio.bbsrc.ac.uk/fig8c.mpg (2–3 MB)
About New Phytologist • New Phytologist is owned by a non-profit-making charitable trust dedicated to the promotion of plant science, facilitating projects from symposia to open access for our Tansley reviews. Complete information is available at www.newphytologist.org. • Regular papers, Letters, Research reviews, Rapid reports and both Modelling/Theory and Methods papers are encouraged. We are committed to rapid processing, from online submission through to publication ‘as-ready’ via OnlineEarly – the 2004 average submission to decision time was just 30 days. Online-only colour is free, and essential print colour costs will be met if necessary. We also provide 25 offprints as well as a PDF for each article. • For online summaries and ToC alerts, go to the website and click on ‘Journal online’. You can take out a personal subscription to the journal for a fraction of the institutional price. Rates start at £109 in Europe/$202 in the USA & Canada for the online edition (click on ‘Subscribe’ at the website). • If you have any questions, do get in touch with Central Office (
[email protected]; tel +44 1524 594691) or, for a local contact in North America, the US Office (
[email protected]; tel +1 865 576 5261).
New Phytologist (2005) 168: 253–262
www.newphytologist.org © New Phytologist (2005)