Sep 15, 2014 - At the end of my PhD journey, I would like to take this opportunity to thank all of the people who ..... 9 Comparison of test methodologies on assessing visual discomfort in 3DTV141 ...... [86] H-C. Li, J. Seo, K. Kham, and S. Lee.
Methods for assessment and prediction of QoE, preference and visual discomfort in multimedia application with focus on S-3DTV Jing Li
To cite this version: Jing Li. Methods for assessment and prediction of QoE, preference and visual discomfort in multimedia application with focus on S-3DTV. Signal and Image Processing. Universit´e de Nantes, 2013. English.
HAL Id: tel-01061107 https://tel.archives-ouvertes.fr/tel-01061107 Submitted on 15 Sep 2014
HAL is a multi-disciplinary open access archive for the deposit and dissemination of scientific research documents, whether they are published or not. The documents may come from teaching and research institutions in France or abroad, or from public or private research centers.
L’archive ouverte pluridisciplinaire HAL, est destin´ee au d´epˆot et `a la diffusion de documents scientifiques de niveau recherche, publi´es ou non, ´emanant des ´etablissements d’enseignement et de recherche fran¸cais ou ´etrangers, des laboratoires publics ou priv´es.
Thèse de Doctorat
Jing LI Mémoire présenté en vue de l’obtention du grade de Docteur de l’Université de Nantes sous le label de l’Université de Nantes Angers Le Mans Discipline : Informatique et applications Spécialité : Informatique Laboratoire : Institut de Recherche en Communications et Cybernétique de Nantes (IRCCyN) Soutenue le 6 décembre 2013 École doctorale : 503 (STIM) Thèse n°: ED 503-211
Methods for assessment and prediction of QoE, preference and visual discomfort in multimedia application with focus on S-3DTV
Méthodes pour l’évaluation et la prédiction de la Qualité d’expérience, la préférence et l’inconfort visuel dans les applications multimédia. Focus sur la TV 3D stéréoscopique
JURY
Rapporteurs :
M. Sanghoon L EE, Professeur, Yonsei University M. Gilles C OPPIN, Professeur, Telecom Bretagne
Examinateurs :
Mme Luce M ORIN, Professeur, Institut National des Sciences Appliquées Mme Anne G UÉRIN D UGUÉ, Professeur, Université Joseph Fourier
Directeur de thèse :
M. Patrick L E C ALLET, Professeur, Université de Nantes
Co-encadrant de thèse :
M. Marcus BARKOWSKY, Maître de conférences, Université de Nantes
Acknowledgment At the end of my PhD journey, I would like to take this opportunity to thank all of the people who have helped me and supported me during the three years of my PhD in France. Firstly, I would like to express my deepest gratitude to my supervisors Prof. Patrick Le Callet and Marcus Barkowsky for offering me the opportunity to be a PhD student under their supervision. During these years, they have taught me how to do a research scientifically, systematically and rigorously with their professional expertise. I also want to thank them for their helps when I encounter any problems during my daily life in France. They are nice, patient, intelligent, professional, and with charming personality. It is very lucky for me to be a PhD student of them. I would also like to express my great appreciation to my colleagues Romain Cousseau and Romuald Pépion, who helped me a lot in all of the subjective experiments of my thesis. I would like to say without their efforts, my research work would not be so productive. Many thanks also go to Matthieu Urvoy for our enjoyable collaborations on the psychophysical studies and an output of a book chapter on visual discomfort. I also want to thank the team members of the first Qualinet Summer school in Ilmenau, they are Francesca De Simone from Telecom ParisTech, Ondˆrej Kaller from Brno University of Technology, Jussi Hakala from Aalto University School of Science and Dawid Juszka from AGH-University of Science and Technology. I enjoyed the collaboration work in the summer school very much. I learned a lot from them. Many thanks also goes to Jesús Gutiérrez from Universidad Politécnica de Madrid. We helped and supported each other to get through the most difficult period of our collaboration research work. I would also like to thank all the co-authors of my i
ii research work, Dr. Fernando Jaureguizar, Prof. Julián Cabrera, and Prof. Narciso García from Universidad Politécnica de Madrid, Prof. Kjell Brunnström and Kun Wang from Department of Netlab in Acreo AB and Mid Sweden University, Taehwan Han, Sungwook Youn, Jiheon Ok, Chulhee Lee from Yonsei University, and Christer Hedberg, Indirajith Vijai Ananth from Department of Netlab in Acreo AB. Furthermore, I feel very honored to have such highly renowned and competent experts in my Ph.D committee. Many thanks to them to review my thesis and provide me with very valuable comments. My great appreciation goes to Prof. Sanghoon Lee from Yonsei University, Prof. Gilles Coppin from Telecom Bretagne, Prof. Luce Morin from INSA and Prof. Anne Guérin Dugué from Université Joseph Fourier. Finally, I would express my appreciation to all of my friends and my family for their helps and supports during the three years of my stay in France. My dear father and mother, thanks for your understanding. Many thanks to my dear friends Emilie, Sofiane(XiaoPang), Bangge, Xiaoyi, Kunshu, Wenzi, Zhujie, Fengjie, BaoBao, Yuwei, Jiazi, Haiyang, Zhaolei, Zhangyu, Dingbo, Chuanlin, Zeeshan, Pierre and so on. Last but not the least, I would like to express my great appreciation to my dear husband Junle Wang for his support and understanding to a PhD wife.
Contents 1
2
Introduction
1
1.1
Context . . . . . . . . . . . . . . . . . . . . . . . . . . . . . . . .
1
1.2
Motivations . . . . . . . . . . . . . . . . . . . . . . . . . . . . . .
2
1.3
Thesis overview . . . . . . . . . . . . . . . . . . . . . . . . . . . .
4
Quality of Experience (QoE) in 3DTV 2.1
2.2
2.3
2.4
2.5
I
9
Stereoscopic perception . . . . . . . . . . . . . . . . . . . . . . . . 10 2.1.1
Monocular depth cues . . . . . . . . . . . . . . . . . . . . 10
2.1.2
Binocular depth cues . . . . . . . . . . . . . . . . . . . . . 12
3D displays . . . . . . . . . . . . . . . . . . . . . . . . . . . . . . 13 2.2.1
3D display classification . . . . . . . . . . . . . . . . . . . 13
2.2.2
Definition of binocular disparity for 3D display . . . . . . . 14
3D Quality of Experience . . . . . . . . . . . . . . . . . . . . . . . 15 2.3.1
Multidimensional perceptual scales for 3D QoE . . . . . . . 16
2.3.2
Influence factors of 3D QoE . . . . . . . . . . . . . . . . . 18
Subjective assessment for QoE in 3DTV . . . . . . . . . . . . . . . 21 2.4.1
Observer context dependency . . . . . . . . . . . . . . . . 21
2.4.2
Multi-scale assessment methodologies . . . . . . . . . . . . 23
2.4.3
Attribute selection . . . . . . . . . . . . . . . . . . . . . . 24
2.4.4
A possible solution: Paired Comparison . . . . . . . . . . . 25
Conclusions . . . . . . . . . . . . . . . . . . . . . . . . . . . . . . 26
Paired comparison methodology: Optimization, evaluation iii
iv
CONTENTS
and application
27
3
29
Subjective assessment methodology in 3DTV: Paired comparison 3.1
Introduction . . . . . . . . . . . . . . . . . . . . . . . . . . . . . . 29
3.2
Standardized Pair Comparison method . . . . . . . . . . . . . . . . 31
3.3
3.4
3.5 4
3.2.1
Definitions . . . . . . . . . . . . . . . . . . . . . . . . . . 31
3.2.2
Comparison with other test methodologies . . . . . . . . . 32
3.2.3
Disadvantages of FPC method . . . . . . . . . . . . . . . . 33
Paired comparison designs: the state of the art . . . . . . . . . . . . 33 3.3.1
Randomised pair comparison design . . . . . . . . . . . . . 34
3.3.2
Sorting algorithm based design . . . . . . . . . . . . . . . . 35
3.3.3
Balanced sub-set design . . . . . . . . . . . . . . . . . . . 36
Pair comparison models . . . . . . . . . . . . . . . . . . . . . . . . 38 3.4.1
Thurstone model . . . . . . . . . . . . . . . . . . . . . . . 39
3.4.2
Bradley-Terry model . . . . . . . . . . . . . . . . . . . . . 42
3.4.3
EBA model . . . . . . . . . . . . . . . . . . . . . . . . . . 43
3.4.4
Goodness of model fit . . . . . . . . . . . . . . . . . . . . 44
Conclusions . . . . . . . . . . . . . . . . . . . . . . . . . . . . . . 44
Boosting paired comparison methodology: optimization on the balanced sub-set designs 45 4.1
Introduction . . . . . . . . . . . . . . . . . . . . . . . . . . . . . . 45
4.2
Analysis on the selection of test pairs . . . . . . . . . . . . . . . . . 46
4.3
4.4
4.5
4.6
4.2.1
Observer selection errors . . . . . . . . . . . . . . . . . . . 47
4.2.2
Sample size induced errors . . . . . . . . . . . . . . . . . . 48
Optimization on the Balanced Sub-set Designs . . . . . . . . . . . . 50 4.3.1
Optimized Rectangular Design (ORD) . . . . . . . . . . . . 50
4.3.2
Adaptive Rectangular Design (ARD) . . . . . . . . . . . . 52
Monte Carlo simulation experiments . . . . . . . . . . . . . . . . . 54 4.4.1
Evaluation of the ARD method . . . . . . . . . . . . . . . . 54
4.4.2
Evaluation of the ORD method . . . . . . . . . . . . . . . . 55
4.4.3
Performance analysis under different numbers of test stimuli 63
Constraints on Pair Comparison test . . . . . . . . . . . . . . . . . 64 4.5.1
Number of observers . . . . . . . . . . . . . . . . . . . . . 64
4.5.2
Number of stimuli . . . . . . . . . . . . . . . . . . . . . . 65
4.5.3
Presentation order of the stimuli . . . . . . . . . . . . . . . 65
Statistical test on preference . . . . . . . . . . . . . . . . . . . . . 66 4.6.1
Conditional and unconditional tests for 2 × 2 comparative trials . . . . . . . . . . . . . . . . . . . . . . . . . . . . . 66
4.6.2
Monte Carlo significant test . . . . . . . . . . . . . . . . . 67
CONTENTS 4.7 5
Conclusions . . . . . . . . . . . . . . . . . . . . . . . . . . . . . . 68
Evaluation of the Adaptive Square Design in subjective experiments of 71 3DTV 5.1
Introduction . . . . . . . . . . . . . . . . . . . . . . . . . . . . . . 71
5.2
Experiment . . . . . . . . . . . . . . . . . . . . . . . . . . . . . . 72
5.3
5.4 6
v
5.2.1
Experimental setup . . . . . . . . . . . . . . . . . . . . . . 72
5.2.2
Experimental design . . . . . . . . . . . . . . . . . . . . . 73
5.2.3
Observers . . . . . . . . . . . . . . . . . . . . . . . . . . . 74
5.2.4
Procedures . . . . . . . . . . . . . . . . . . . . . . . . . . 75
Experimental Results . . . . . . . . . . . . . . . . . . . . . . . . . 75 5.3.1
Comparative analysis . . . . . . . . . . . . . . . . . . . . . 75
5.3.2
Quantitative analysis . . . . . . . . . . . . . . . . . . . . . 77
Conclusions . . . . . . . . . . . . . . . . . . . . . . . . . . . . . . 80
Application of the OSD method in evaluation study of the Preference of 81 Experience in 3DTV 6.1
Introduction . . . . . . . . . . . . . . . . . . . . . . . . . . . . . . 81
6.2
Test Materials . . . . . . . . . . . . . . . . . . . . . . . . . . . . . 83
6.3
6.4
6.5
6.6
6.2.1
Source Video Sequences . . . . . . . . . . . . . . . . . . . 83
6.2.2
Hypothetical Reference Circuits . . . . . . . . . . . . . . . 83
Experimental design . . . . . . . . . . . . . . . . . . . . . . . . . 85 6.3.1
Experiment 1 . . . . . . . . . . . . . . . . . . . . . . . . . 85
6.3.2
Experiment 2 . . . . . . . . . . . . . . . . . . . . . . . . . 86
Experimental setup . . . . . . . . . . . . . . . . . . . . . . . . . . 88 6.4.1
Equipment and environment . . . . . . . . . . . . . . . . . 88
6.4.2
Observers . . . . . . . . . . . . . . . . . . . . . . . . . . . 89
6.4.3
Test Process . . . . . . . . . . . . . . . . . . . . . . . . . . 89
Results of Experiment 1 . . . . . . . . . . . . . . . . . . . . . . . . 90 6.5.1
Analysis on the influence of video content on PoE by the Bradley-Terry model . . . . . . . . . . . . . . . . . . . . . 90
6.5.2
Analysis on the influence of video content on PoE by Barnard’s exact test . . . . . . . . . . . . . . . . . . . . . . . . . . . 93
6.5.3
HRC analysis . . . . . . . . . . . . . . . . . . . . . . . . . 94
6.5.4
Discussion . . . . . . . . . . . . . . . . . . . . . . . . . . 95
Results of Experiment 2 . . . . . . . . . . . . . . . . . . . . . . . . 97 6.6.1
Observation independency analysis . . . . . . . . . . . . . 97
6.6.2
Influence of HRCs on PoE . . . . . . . . . . . . . . . . . . 98
6.6.3
2D/3D Preference . . . . . . . . . . . . . . . . . . . . . . 98
6.6.4
Possible causes of 2D/3D preference . . . . . . . . . . . . . 100
vi
CONTENTS 6.6.5 6.7
Discussions on other factors . . . . . . . . . . . . . . . . . 104
Conclusion . . . . . . . . . . . . . . . . . . . . . . . . . . . . . . 104
II Visual discomfort in 3DTV: subjective, objective predic107 tion and modeling 7
Visual discomfort in 3DTV: State of the art 7.1
7.2
Definitions . . . . . . . . . . . . . . . . . . . . . . . . . . . . . . . 109 7.1.1
Visual fatigue . . . . . . . . . . . . . . . . . . . . . . . . . 110
7.1.2
Visual discomfort . . . . . . . . . . . . . . . . . . . . . . . 110
Main causes of visual discomfort . . . . . . . . . . . . . . . . . . . 110 7.2.1
Vergence-Accommodation conflict . . . . . . . . . . . . . . 110
7.2.2
Disparity distribution . . . . . . . . . . . . . . . . . . . . . 111
7.2.3
Binocular distortions . . . . . . . . . . . . . . . . . . . . . 111
7.2.4
Motion . . . . . . . . . . . . . . . . . . . . . . . . . . . . 116
7.3
Subjective assessment methodology . . . . . . . . . . . . . . . . . 117
7.4
Objective psychophysical prediction . . . . . . . . . . . . . . . . . 118
7.5 8
109
7.4.1
Electroencephalography (EEG) . . . . . . . . . . . . . . . 118
7.4.2
Functional Magnetic Resonance Imaging (fMRI) . . . . . . 119
7.4.3
Electromyography (EMG) . . . . . . . . . . . . . . . . . . 119
7.4.4
Eye Blinking . . . . . . . . . . . . . . . . . . . . . . . . . 120
Conclusions . . . . . . . . . . . . . . . . . . . . . . . . . . . . . . 120
Subjective assessment on visual discomfort in 3D videos: influence of 121 3D motion 8.1
Introduction . . . . . . . . . . . . . . . . . . . . . . . . . . . . . . 121
8.2
Experiment . . . . . . . . . . . . . . . . . . . . . . . . . . . . . . 122
8.3
8.4
8.2.1
Definitions . . . . . . . . . . . . . . . . . . . . . . . . . . 123
8.2.2
Experimental design . . . . . . . . . . . . . . . . . . . . . 123
8.2.3
Apparatus . . . . . . . . . . . . . . . . . . . . . . . . . . . 125
8.2.4
Stimuli . . . . . . . . . . . . . . . . . . . . . . . . . . . . 125
8.2.5
Viewers . . . . . . . . . . . . . . . . . . . . . . . . . . . . 126
8.2.6
Assessment Method . . . . . . . . . . . . . . . . . . . . . 129
8.2.7
Procedures . . . . . . . . . . . . . . . . . . . . . . . . . . 129
Results of Experiment 1: Influence of motion . . . . . . . . . . . . 130 8.3.1
Planar motion and static conditions . . . . . . . . . . . . . 130
8.3.2
In-depth motion and static conditions . . . . . . . . . . . . 132
8.3.3
Discussion . . . . . . . . . . . . . . . . . . . . . . . . . . 133
Linear regression analysis . . . . . . . . . . . . . . . . . . . . . . . 134
CONTENTS 8.5
8.6 9
vii
Results of Experiment 2: Influence of human factors on visual discomfort . . . . . . . . . . . . . . . . . . . . . . . . . . . . . . . . 136 8.5.1
Comparison between experts and naive viewers . . . . . . . 136
8.5.2
Classification of observers . . . . . . . . . . . . . . . . . . 136
Conclusions . . . . . . . . . . . . . . . . . . . . . . . . . . . . . . 138
Comparison of test methodologies on assessing visual discomfort in 3DTV141 9.1
Introduction . . . . . . . . . . . . . . . . . . . . . . . . . . . . . . 141
9.2
Stimuli . . . . . . . . . . . . . . . . . . . . . . . . . . . . . . . . . 142
9.3
Experiment . . . . . . . . . . . . . . . . . . . . . . . . . . . . . . 143
9.4
9.5
9.3.1
Experiment 1: ACR test conducted at the IVY lab . . . . . . 143
9.3.2
Experiment 2: PC test conducted at the IVC lab . . . . . . . 145
Results: Comparison between ACR and PC . . . . . . . . . . . . . 147 9.4.1
Comparison between the scales values: MOS and BT scores 148
9.4.2
Comparison of the raw data . . . . . . . . . . . . . . . . . 148
Discussions and Conclusion . . . . . . . . . . . . . . . . . . . . . 153
10 Objective visual discomfort model for stereoscopic 3D videos
155
10.1 Introduction . . . . . . . . . . . . . . . . . . . . . . . . . . . . . . 155 10.2 Overview of the proposed model . . . . . . . . . . . . . . . . . . . 158 10.3 Feature extraction . . . . . . . . . . . . . . . . . . . . . . . . . . . 162 10.3.1 3D motion calculation . . . . . . . . . . . . . . . . . . . . 162 10.3.2 Multiple moving objects tracking . . . . . . . . . . . . . . 163 10.4 Pooling strategies of the objective models . . . . . . . . . . . . . . 164 10.4.1 Pooling strategy for Model T . . . . . . . . . . . . . . . . . 165 10.4.2 Pooling strategy for Model F . . . . . . . . . . . . . . . . . 166 10.5 Performances of the proposed models . . . . . . . . . . . . . . . . 167 10.5.1 Evaluation of the disparity and motion estimation algorithm 167 10.5.2 Evaluation of the proposed model . . . . . . . . . . . . . . 169 10.5.3 Performance of the proposed models . . . . . . . . . . . . . 169 10.5.4 Considering the effects of window violation . . . . . . . . . 173 10.6 Evaluation of a proposed objective visual discomfort algorithm . . . 174 10.7 Conclusions . . . . . . . . . . . . . . . . . . . . . . . . . . . . . . 177 11 Objective psychophysical prediction of visual discomfort
179
11.1 Introduction . . . . . . . . . . . . . . . . . . . . . . . . . . . . . . 179 11.2 Experiment . . . . . . . . . . . . . . . . . . . . . . . . . . . . . . 180 11.2.1 Apparatus and environment . . . . . . . . . . . . . . . . . 180 11.2.2 Stimuli . . . . . . . . . . . . . . . . . . . . . . . . . . . . 181 11.2.3 Subjects and Procedure . . . . . . . . . . . . . . . . . . . . 181 11.3 Relationship between eye blinking rate and visual discomfort . . . . 181
viii
CONTENTS 11.3.1 Influence factors of eye blinking . . . . . . . . . . . . . . 11.3.2 Objective eye blinking models in function of 3D video characteristics . . . . . . . . . . . . . . . . . . . . . . . . . . 11.3.3 The link between blinking rate and visual discomfort . . . 11.4 Conclusions . . . . . . . . . . . . . . . . . . . . . . . . . . . . .
. 181 . 185 . 185 . 188
12 Conclusion and perspectives 189 12.1 Summary and contribution . . . . . . . . . . . . . . . . . . . . . . 189 12.2 Limitation and perspectives . . . . . . . . . . . . . . . . . . . . . . 192 List of Tables
197
List of Figures
205
Abbreviations
205
Publications
208
Bibliography
211
1 Introduction 1.1
Context
Stereoscopic-3D (S3D) technology is changing human’s viewing experience nowadays. It provides the viewers with a more immersive and natural video scene. S3D releases become increasingly popular over the last few years, peaking with the epic visual effects in James Cameron’s Avatar, Martin Scorsese’s Hugo and most recently Ang Lee’s Life of Pi. This new wave of S3D movies leads to an increasing expectation for the industry to explore the possibility of the S3D technology for the home entertainment. A preliminary step is S3D movies through the packaged media (e.g. DVD and Bluray). In the long run, the wide application of S-3DTV broadcasting system is also necessary. A pioneer for this was a pay-television operator BSkyB who introduced a stereoscopic S-3DTV channel in the United Kingdom in October 2010 (For convenience, S3D and S-3DTV are replaced by 3D and 3DTV in the following sections of this thesis). To achieve this goal, despite the high requirements on hardware, extensive efforts on the study of 3D viewing experience have been made by researchers and international standardization organizations. The research topics covered a wide range of disciplines, including neurology, psychology, optics, multimedia and broadcasting. 1
2
CHAPTER 1. INTRODUCTION
1.2
Motivations
Stereoscopic 3D has recently received much attention as a result of a strong push from the cinema industry. However, in recent years, an increasing amount of people started to reconsider the question: “is the 3D viewing really worth the hope and the money they pay for it?” . Many factors may lead to this question, for examples, the inconvenience of wearing the 3D glasses, the limited sources of 3D video, and the experienced visual discomfort induced by 3D videos. For industry, the balance between the immersive viewing experience and the perceived visual discomfort is one of the most important concerns. A goal of the 3DTV society would be that the immersive viewing experience is enhanced as much as possible while the visual discomfort or visual fatigue is perceived as little as possible. To achieve it, three important questions are raised: 1) how to measure the 3D viewing experience subjectively; 2) which factors would influence the 3D viewing experience; and 3) how to model the 3D viewing experience objectively for the purpose of optimizing or controlling the multimedia processing or broadcasting system. Recently, many international standardization organizations have been working on these issues. For example, the International Telecommunication Union (ITU) has published the standard subjective methodologies for the assessment of stereoscopic 3DTV systems including general test methods, grading scales and viewing conditions in ITU-R BT.2021[56]. The Society of Motion Picture & Television Engineers (SMPTE) focuses on the standardization related to stereoscopic 3DTV in production environments, e.g., the exchange of 3D content amongst mastering facilities, and between a mastering facility and the ingest facility of a distribution system. The Digital Video Broadcasting Project (DVB) and the European Broadcasting Union (EBU) provide interim recommendations regarding producing, exchanging, archiving, distributing, coding, and transmitting 3D programs using 2D compatible or newly developed 3D infrastructure and transmission technologies for home viewing. The 3DTV group of the Video Quality Experts Group (VQEG) [139] is currently working on three distinct projects, which concern the subjective assessment methodology, the influence factors evaluation, and the objective models. IEEE P3333 [1], which is an individual-based project approved by the IEEE Standards Association, recently started their work on the quality assessment of 3D displays, 3D contents and 3D devices based on human factors, such as photosensitive seizures, motion sickness, visual fatigue, and identification and quantification of the causes of those factors. All these works have made big progress for the popularization of 3DTV in the home entertainment. However, we are still facing with numerous challenges: (1) Reliable subjective assessment methodologies for 3D viewing experience
1.2. MOTIVATIONS
3
are still missing. 3D viewing experience, which is also defined as “Quality of Experience (QoE)” in 3DTV, is a combined viewing experience of image quality, depth quality and visual comfort. Thus, it is a multi-dimensional concept. Though ITU-R BT.2021[56] has published a recommendation for subjective assessment methodology for stereoscopic 3DTV system, these methods are based on the traditional 2D quality assessment methods, which only provide the subjective judgement on each particular aspect in 3D viewing, for example, image quality or visual discomfort. A multidimensional scale for the combined experience on 3DTV may not be provided by these methods. Therefore, a reliable method to measure this combined experience is highly required.
(2) What are the influence factors of the 3D viewing experience and how these factors affect it need investigations. There are numerous possible factors that would influence the 3D viewing experience, for example, the display technology, the test environment, or the characteristics of the viewers. Due to its complexity, a large number of cross-lab study is needed. In addition, this work should be based on a reliable ground truth obtained by a reliable subjective assessment methodology. However, nowadays, most of the studies on this issue are based on the subjective experiment by using traditional 2D assessment methods.
(3) As one of the most important dimensions of QoE in 3DTV, visual discomfort is an issue often complained by the viewers after watching the 3D videos. Thus, an objective visual discomfort model is needed to monitor and optimize the broadcasting systems automatically and then achieve the best viewing experience. However, due to 1) the lack of the 3D video databases, 2) the uncertainty of the reliability of the subjective assessment methodology, and 3) the incomplete study on influence factors, no objective visual discomfort models have been validated by a large enough number of databases.
(4) Besides the subjective assessment methods and objective models, the objective psychophysical prediction on viewing experience is required. In particular, the degree of visual discomfort or visual fatigue induced by 3DTV should be predicted as they are safety issues for consumers.
In order to solve the problems listed above, some researches have been conducted and will be presented in the remainder of this thesis. Basically, there are two main topics in this thesis: subjective assessment methodology for QoE in 3DTV, and the study on visual discomfort in 3DTV. The main content and the structure of the thesis are shown in the next section.
4
CHAPTER 1. INTRODUCTION
1.3
Thesis overview
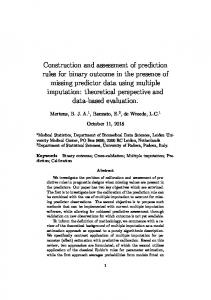
The diagram in Figure 1.1 shows the outline of this thesis. Chapter 2 introduces some important concepts regarding the 3D display technology and 3D viewing experience, including the way humans perceive stereopsis, the way 3D display systems work, the definition of 3D QoE, the factors that influence the 3D viewing experience, the subjective and objective way of measuring the 3D QoE, and the challenges and difficulties the current 3D industry is facing. Following Chapter 2, the remainder of the thesis is structured into two parts. The first part of the thesis focuses on the subjective assessment methodology for 3DTV. In particular, an assessment methodology which might generate reliable results for 3DTV called “Paired Comparison” is investigated. An overview of the state-of-the-art researches on the paired comparison method is firstly introduced in this part. Three of my research works are then introduced: 1) the proposal of a set of efficient designs for paired comparison; 2) the evaluation of the proposed designs by a series of subjective assessment experiments in 3DTV; 3) an application of the proposed paired comparison designs in evaluating the influence factors of QoE in 3DTV. More details of these studies are presented as follows: – Chapter 3 introduces the state-of-the-art research work on Paired Comparison. This chapter illustrates why and how the paired comparison method is feasible in assessing the multi-dimensional viewing experience when watching 3DTV. The standardized paired comparison method and some existing efficient designs for paired comparison are introduced. In addition, the mathematical tools for analyzing the paired comparison data are introduced, including the Thurstone-Mosteller (TM) model, the Bradley-Terry (BT) model and the Elimination By Aspects (EBA) model. – Chapter 4 introduces the proposed efficient designs for paired comparison. Generally, the existing efficient designs for paired comparison are based on theory analysis under perfect conditions (e.g., no observation errors in subjective tests). However, in a real subjective assessment experiment, there are often various errors which would influence the test results, for example, the observer’s unintentional mistakes on voting. Based on statistical analysis on the possible errors, a set of efficient designs which are also robust to these errors is proposed. The proposed designs are evaluated by Monte-Carlo simulation experiments. – In Chapter 5, the proposed designs on paired comparison are evaluated by subjective visual discomfort experiments. Five paired comparison experi-
1.3. THESIS OVERVIEW
Figure 1.1: Overview of the thesis chapters.
5
6
CHAPTER 1. INTRODUCTION ments aiming at different objectives were conducted. The performance of the proposed efficient designs are evaluated under different test scenarios, for example, under the influence of the observation errors, and under the influence of irrelevant stimuli. – Chapter 6 provides an example about how to utilize the proposed pair comparison design on the study of QoE in 3DTV. A set of joint experiments were conducted in two labs considering various influence factors, for example, different 3D displays, test environments, viewers, etc. The significant factors of QoE in 3DTV are studied in this chapter, which is an important hint for the standardization of QoE in 3DTV.
The second part of the thesis focuses on the study of visual discomfort in 3DTV. Firstly, an overview of the state-of-the-art researches on visual discomfort is introduced, then, four of my research works are described: 1) the study on the influence of 3D motion on visual discomfort; 2) the comparison analysis on two different subjective assessment methodologies; 3) evaluation of the proposed objective visual discomfort model on natural stereoscopic video sequences and 4) the study on the relationship between the psychophysical signals and the experienced visual discomfort. The details are shown as follows: – Chapter 7 introduces the state-of-the-art research work on visual discomfort, including the definitions of visual discomfort and visual fatigue in 3DTV, the possible factors that would induce visual discomfort, the widely used subjective assessment methodologies, and the psychophysical prediction of visual discomfort by devices. – Chapter 8 focuses on the influence of 3D motion on visual discomfort. In the subjective experiments, the paired comparison method was used. Synthetic video sequences were used for precise control of the motion type, velocity and disparity values in the stimuli. This study clarifies a series of questions, including (1) which types of motion have more significant influence on visual discomfort, (2) how disparity affects visual discomfort, and (3) what is the inter-observer difference in the perception of visual discomfort. In addition, a psychophysical visual discomfort model is proposed according to the test results. – Chapter 9 introduces a comparative study on the influence of different subjective test methodologies on visual discomfort. The subjective experimental results obtained by the ACR methodology and the Paired Comparison method-
1.3. THESIS OVERVIEW
7
ology are compared. The correlation between the two test results, the discriminability of the two test methodologies and the viewers’ behavior in two tests are analyzed. – In Chapter 10, the proposed psychophysical visual discomfort model is evaluated by natural stereoscopic video sequences. Two frameworks are proposed for the model. One is based on the tracked moving objects over sequences, the other is based on the moving objects in each frame. The subjective experimental results presented in Chapter 9 are used as the ground truth. The results indicate that the performances of the two frameworks are comparable and both showed higher correlation with the subjective data than an existing objective visual discomfort model in [65]. – Chapter 11 introduces a study on the psychophysical prediction of visual discomfort in 3DTV. The synthetic video sequences in Chapter 8 with different types of motion are used in the subjective test. An electro-physiological device is utilized to record the various eye movements signals of the viewers, particularly the eye blinking signals. The results showed that eye blinking rate is capable of predicting visual discomfort in 3DTV. Nevertheless, the relationship between eye blinking and visual discomfort is highly dependent on the type of motion in the videos. At the end of the thesis, a summary of the contributions and some perspective for the future work are presented in Chapter 12.
2 Quality of Experience (QoE) in 3DTV Television is one of the most important devices for home entertainment. Looking back at the history of television, from the black-and-white television to color television; from the analog television to the digital television; from SDTV to HDTV or even 3D HDTV, there is no doubt that improving viewers’ viewing experience is a main driving force for the development of television technology as well as the broadcasting system. 3D technology is still relatively new to consumers. The “pros and cons” of this technology are somehow obvious. On one hand, the 3D technology provides the viewers with the experience of “being part of it”; on the other hand, viewers also often complain about the visual discomfort and visual fatigue after watching the 3D movies. To improve the viewing experience of 3DTV, three basic questions are raised: 1) what is the mechanism of 3D displays, 2) which factors affect the viewing experience of 3D content, and 3) how to measure the viewing experience. In this chapter, we firstly introduce the mechanisms of the stereoscopic perception of human beings in Section 2.1, and the 3D display technologies in Section 2.2. Then, we introduce a particular terminology for 3D viewing experience, i.e., “Quality of Experience” in Section 2.3, where its multi-dimensionality and the possible influence factors are illustrated. Finally, in Section 2.4, the challenges of measuring 3D QoE and the problems of the existing subjective assessment methods are discussed. A candidate solution for these challenges and problems is then proposed. 9
10
CHAPTER 2. QUALITY OF EXPERIENCE (QOE) IN 3DTV Table 2.1: List of depth cues Monocular cues Binocular cues Interposition Vergence Linear perspective Binocular disparity Light and shade Relative size Height in the visual field Texture gradient Aerial perspective motion parallax Oculomotor (Acommodation) Defocus blur
2.1
Stereoscopic perception
Human beings have the ability to visually perceive the world in three dimensions. This ability is called depth perception. Depth perception relies on a variety of depth cues. As proposed in [91], these depth cues can be classified into two categories: monocular cues and binocular cues. As the name implies, monocular cues require the input from only one eye while binocular cues require inputs from both eyes. Each of these depth cues and the mechanisms by which they influence the depth perception are introduced in Table 2.1.
2.1.1
Monocular depth cues
– Interposition: Objects occluding each other suggest their depth ordering, in particular, a more distant object is partial blocked by a nearer object.
Figure 2.1: An example of interposition. – Light and shade: It is usually agreed for all natural lights, and for most artificial lights, that the light comes from above to some degree. Thus, shadow plays a broader role in defining depth between objects since objects in shadow must be farther from the light than objects that are not in shadow.
2.1. STEREOSCOPIC PERCEPTION
11
– Relative size: An object with smaller retinal image is judged further away than the same object with a larger retinal image.
Figure 2.2: An example of relative size. – Height in the visual field: This is a depth cue based on the vertical position of a point in the visual field. Objects further away are generally higher in the visual field. – Texture gradient: Most surfaces, such as walls and roads and a field of flowers in bloom, have a texture. As the surface gets farther away from us this texture gets finer and appears smoother. Furthermore, the shape, size and density of the texture also affect the depth perception.
Figure 2.3: An example of texture gradient, which was taken in Bordeaux by the author. – Linear perspective: It is the phenomenon that parallel lines that recede into the distance appear to converge. – Aerial perspective: the atmosphere affects light traveling through it, for example due to fog, dust or rain. As light travels long distances it is scattered, colors loose saturation, sharp edges are diffused and color hue is shifted towards blue.
12
CHAPTER 2. QUALITY OF EXPERIENCE (QOE) IN 3DTV
Figure 2.4: An example of linear perspective, which was taken in Saint-Emilion by the author.
Figure 2.5: An example of aerial perspective [39]. – Motion parallax: This is a depth cue existing in a dynamic scene. When we move or an object in the scene moves, objects that are closer to us move faster across our field of view than the objects in distance. – Oculomotor (Accommodation): This is a nonvisual depth cue which concerns the change of the lens of the eyes. It is controlled by the ciliary muscles to maintain a sharply focused image of the fixated point. Fixation on a relatively near point corresponds to a relatively relaxed state of the muscles. Therefore, information on the state of the ciliary muscles provides the information of absolute fixation distance.
2.1.2
Binocular depth cues
– Vergence: This is a nonvisual depth cue. A vergence is the simultaneous movement of both eyes in opposite directions to obtain or maintain single binocular vision [15]. To look at an object closer by, the eyes rotate towards each other. For an object further away, the eyes rotate away from each other. When looking at an object in infinite distance, the eyes diverge until parallel.
2.2. 3D DISPLAYS
13
– Binocular disparity: As human eyes are horizontally separated, the retinal images received by two eyes are slightly different. The brain fuses the left and right retinal images and then extracts the relative depth information from retinal disparity, i.e., the difference between corresponding points in these images.
2.2
3D displays
The history of 3D technology dates back to around 300 BC. The human binocular vision was firstly discovered by a Greek scientist Euklides. In 1838, Charles Wheatstone invented one of the first recorded devices for displaying three-dimensional images [142]. In 1922, a 3D mainstream film “The Power of Love” was created. It was recorded using two dissimilar colors and viewers wear anaglyph eyewear to perceive the 3D effect. In 1928, stereoscopic 3D television was shown for the first time by John Logie Baird [128]. 3D technology has been rapidly developing during recent years. Basically, the 3D displays take advantage of mechanisms of the Human Visual System (HVS) on stereopsis perception. The human brain can fuse the images input from the left eye and the right eye. And then, from retinal disparity, the HVS extracts the relative depth information, i.e. the distance between corresponding points in these images [26]. Thus, the basic technique of 3D displays is to present the left and right views separately to the left and right eye. Then the two retinal images can be combined in the brain to generate the perception of 3D depth.
2.2.1
3D display classification
According to the demand of glasses or not, 3D displays can be classified into two types: stereoscopic and autostereoscopic displays. When using a stereoscopic display, the viewers have to wear an optical device to direct the left and right images to the appropriate eye, which is called aided viewing. For autostereoscopic displays, the technology of separating both views is integrated in the display, which is called free viewing. Stereoscopic displays with aided viewing are widely used. They are classified into time-parallel or time-sequential displays. In time-parallel displays, the left and right views are displayed simultaneously on one or two screens. In such systems, the methods used to direct the distinct views to the appropriate eyes include: 1) location multiplexing; 2) anaglyph or color-multiplexing; and 3) polarization multiplexing. In time-sequential displays, the left and right views of a stereo image pair are presented in rapid alternation. The stereo pairs are viewed using synchronized active shuttering glasses which open alternately for the appropriate eye while closing
14
CHAPTER 2. QUALITY OF EXPERIENCE (QOE) IN 3DTV
Figure 2.6: Classification of 3D displays
the other eye’s view. This system exploits the characteristic of human visual systems that integrates a stereo pair across a time-lag of up to 50 ms [104]. Unlike stereoscopic displays, autostereoscopic displays do not need any glasses to present the two views. This type of displays sends the left and right images directly to the corresponding eyes. Currently, autostereoscopic displays can be classified into: 1) direction-multiplexed; 2) volumetric; and 3) holographic displays. For more details readers are referred to [135]. It is worth to note that, due to the free viewing, autostereoscopic displays are probably best suited for the application of 3DTV for home entertainment.
2.2.2
Definition of binocular disparity for 3D display
In the same viewing conditions, a larger disparity between the left and right view generally corresponds to a larger perceived depth. Disparity can be measured by various ways. A direct way is to use length units, e.g. pixels or centimeters. However, when using length units to measure disparity, the viewing condition (e.g. corresponding pixel size and viewing distance) should be provided as well. Another way to measure disparity is to use the degree of visual angle [51] (see Figure 2.7). The binocular angular disparities φA and φB for point A and B can be calculated by Equation (2.1) and (2.2), respectively. For a point which is on the screen plane, the binocular angular disparity is 0 degree. A positive value represents crossed disparity, such as the point A; a negative value represents uncrossed disparity, such as the point B. In this way, the disparity is comparable at different conditions as the viewing distances and the distance between the two views have been taken into consideration in the expression of visual angle. φA = β − α
(2.1)
2.3. 3D QUALITY OF EXPERIENCE
15
Screen L β
A
α
F
γ
B
R
Figure 2.7: The definition of the binocular angular disparity, where F is the fixation point.
φB = γ − α
2.3
(2.2)
3D Quality of Experience
In 2D image/video quality assessment, “quality” is related to perceived image degradation, typically, compared to an ideal or perfect image. For 3D content, due to the added “depth” information provided by 3D displays, “quality” is not enough to describe the viewer’s experience, particularly the immersive feeling, the accompanying emotion status and visual discomfort when watching 3D images/videos. Therefore, Quality of Experience (QoE) is proposed to replace “quality” in 3DTV visual quality assessment field. The term QoE unites a multitude of meanings. Some of them were attributed to QoE and similar terms such as “Quality of Service” (QoS) in an ambiguous manner. According to ITU-T Rec. P.10 [108], QoE is defined as “the overall acceptability of an application or service, as perceived subjectively by the end user”. Recently, representatives of more than 20 internationally recognized research institutions discussed this issue within the European Network of Excellence “Qualinet” (COST IC2003). They decided for the following working definition: “Quality of Experience (QoE) is the degree of delight or annoyance of the user of an application or service. It results from the fulfillment of his or her expectations with respect to the utility and / or enjoyment of the application or service in the light of the user’s personality and current state” [80]. This definition has been triggered partially by the recent development of 3D video quality assessment methodologies. While it is evident that multimodal services, such as audiovisual services, require multidimensional quality analysis, 3D video quality assessment is a particularly interesting example of a monomodal ser-
16
CHAPTER 2. QUALITY OF EXPERIENCE (QOE) IN 3DTV
Figure 2.8: Quality of Experience model starting from primary factors on the bottom to more complex factors on higher levels. vice stimulating the human’s quality perception in a complex manner that may be modeled in a multidimensional approach.
2.3.1
Multidimensional perceptual scales for 3D QoE
The multidimensionality in 3D QoE is explained by the enhanced depth perception due to the stereopsis effect implemented, in most cases, by projecting two different images to each of the two human eyes and thus mimicking the real world situation in a fixed head position. The technical implementation in 3D capture systems and 3D display devices has deficiencies leading to visual annoyances such as visual discomfort sensations or visual fatigue symptoms. Several models have been proposed to explain the human’s integration of the different aspects, an excerpt will be provided here. Seuntiens et al. proposed a combination of perceived depth, binocular image distortion, and visual strain to model viewing experience in the presence of crosstalk in 2005 [112]. Kaptein et al. proposed to enhance the well-known 2D image quality measurement by adding a depth evaluation and the combination would then lead to a notion of naturalness [67]. This model has further been refined by Lambooij et al. towards a two level perceptual process which measures image quality and amount of depth as primary indicators and naturalness and viewing experience as derived, higher level indicators [78]. Chen et al. added visual comfort as primary indicator to the model and noted that two levels of derived perceptual criteria may be appropriate. He positioned naturalness and depth rendering on the second level and visual experience on the third level [19] leading to the pyramidal representation shown in Figure2.8. Added value of depth The depth perceived in stereoscopic 3D reconstruction maintains all previously perceived 2D depth cues, such as occlusion, relative size and relative density, height
2.3. 3D QUALITY OF EXPERIENCE
17
in the visual field, aerial perspective, texture gradients, light and shading, and linear perspective. Most of the current 3D displays are limited to two views, such as polarized passive or active shutter glasses displays. These displays would then add binocular disparity and eventually the convergence state of the eyes as depth cue. Autostereoscopic displays provide more than two views and may therefore also reconstruct motion parallax to a certain extent. Cutting and Vishton have analyzed the Just Noticeable Difference (JND) of object’s depth position [27]. They observed that binocular disparities may offer an important depth position cue at short distances which decreases linearly with logdistance. At a viewing distance of about 1.5 m, a typical viewing distance for a 42 inches screen, the depth resolution of the human eye would correspond to about 1.5 cm. Using a visual depth acuity threshold of 20 arcsec, the minimum perceivable depth difference would correspond to about 9.4 cm in the same situation. On an autostereoscopic display, a psychophysical test has shown that the perceived JND may be in between these values [4]. The disparity distribution as shown to the observers mostly influences the perceived depth quantity effect. The qualitative effect of depth also relates to the reconstruction of the depth volume, in particular the relationship between horizontal and vertical compared to depth extents. Extreme depth compression may lead to cardboard effects or even puppet theater effect. To improve perceived depth quality, a stereoscopic shooting rule was developed to allow for improved reconstruction of S-3D content using two camera models [20].
Visual discomfort and visual fatigue Visual discomfort and visual fatigue contain a wide range of visual symptoms, for example, headaches, tiredness, eye strains. Usually, in our daily life, visual discomfort or visual fatigue are due to some work demanding focusing or converging the eyes on an object for a long time. For example, watching TV for a long time, reading in a dark room, or reading texts with tiny font. The added binocular depth introduced by 3D technology may provide viewers not only a totally different and enhanced viewing experience, but also visual discomfort and visual fatigue issues. Recently, it is often complained by the viewers that watching stereoscopic 3D content would induce more visual discomfort or visual fatigue when compared with the 2D video content. Thus, visual discomfort and visual fatigue are gaining increasing attention as besides the decreased viewing experience, it related to the viewers’ health and safety issues. Generally, it is believed that the imperfect simulation of depth cues on 3D display is the main cause of visual discomfort or visual fatigue, for example, the geometrical distortions between the left view and right view, the bright difference
18
CHAPTER 2. QUALITY OF EXPERIENCE (QOE) IN 3DTV
Figure 2.9: Comparison of Vergence-Accommodation conditions in (a) daily life and (b) watching 3D displays. between the left and right views, and the conflict between vergence eye movement and accommodation. Here, the vergence and accommodation conflict is briefly introduced. As illustrated in Section 2.1, both accommodation and vergence are nonvisual depth cues. Accommodation is controlled by the ciliary muscles which adjust the focal distance of the eyes by changing the shape of the lens. To keep the retinal image sharp, the focal distance of accommodation should be kept within a certain range around the object. On the other hand, to keep the stimuli fused, the eyes should converge to a distance close to the object distance. In our daily life, the accommodation and vergence are normally coupled. Accommodative changes can evoke vergence changes, and vergence changes can also evoke accommodative changes [36]. Focal and vergence distances are always close. However, when watching 3D content by 3D displays, accommodation and vergence may be decoupled. As shown in Figure 2.9(b), when viewing an object by means of a 3D screen, the eyes will converge to the virtual object. However, the accommodation has to be performed at the screen depth level to keep the image sharply focused. This discrepancy is unnatural and will not happen in our daily life. The larger this discrepancy between vergence and accommodation gets, the higher the probability that observers would perceive visual discomfort. This section just provides the readers a brief understanding about visual discomfort in 3DTV. For more details, the readers are referred to Chapter 7.
2.3.2
Influence factors of 3D QoE
QoE might be influenced by many factors. Generally, the influence factors (IF) can be grouped in three categories, namely System IF, Context IF and Hu-
2.3. 3D QUALITY OF EXPERIENCE
19
man IF [80]. System IFs refer to “properties and characteristics that determine the technically produced quality of an application or service.” [63]. They are related to media capture, coding, transmission, storage, rendering and display. Context IFs are factors that “embrace any situational property to describe the user’s environment in terms of physical, temporal, social, economic, task and technical characteristics” [64]. A human IF is “any variant or invariant property or characteristic of a human user”, e.g., the user’s visual and auditory acuity, gender, age, previous experiences, education background [119].
System factors In 3DTV broadcasting chain, one of the most important factors of QoE is the System IFs. For example, due to the limitation of the broadcasting bandwidth, the video sequences have to be compressed by encoders before transmission. The performance of different coding schemes on QoE is different [140][81]. Another influence factor for 3D QoE is the image/video format. There are several formats for 3D videos. For example, frame sequential (e.g. frame packing) format and frame compatible (e.g. side-by-side) format. The frame sequential format allows each view to have Full High Definition (HD) resolution while in frame compatible format, the left and right images are grouped into a single 2D HDTV frame with the resolution halved. Current 3DTV broadcasting systems are mostly limited to Side-by-Side (SBS) contents, as it can be processed by traditional 2D Full HD broadcasting chains. In [147], the influences of video formats on QoE were studied. The results showed that for uncompressed video, the quality and depth perception of the frame-sequential video have higher QoE than SBS video. But for the encoded video, the quality and depth perception depend on the amount of spatial and temporal information of the video sequences. As introduced in Section 2.2, there are various types of 3D display. Different 3D display technologies influence the viewing experience differently and none of them can be considered as “transparent” as 2D displays. In [66], the authors studied the angular characteristics of polarization multiplexed and time multiplexed 3D displays. Through the evaluation of the viewing angle-related imperfections, i.e., crosstalk (one eye’s view leaking to another eye’s view), brightness and relative color saturation, the time multiplex 3D display performed better than the polarization multiplexed display in terms of the image quality and perceived depth. In [114], an LCD display with polarized glasses, a plasma display with shutter glasses and a projection system with shutter glasses were compared in terms of achievable QoE in different situations. The results showed that the performance of the studied display technologies were comparable in terms of the intensity of 3D effect, depth perception of the scene and user involvement. However, the plasma display with ac-
20
CHAPTER 2. QUALITY OF EXPERIENCE (QOE) IN 3DTV
(a) Non-standard lab environment
(b) Public test environment
Figure 2.10: Test environments used in [106]. tive shutter glasses were significantly better in the sharpness of the scene and visual comfort than the other two systems. Depth rendering ability of different displays were studied in [18], and the results showed that it mainly depends on the viewing distance and the properties of display. For example, for line or column interleaved displays, if the viewing distance is 3 times of the screen height, there might be a problem of visible dark stripes because the line or column will exceed the extent of 1 min of arc which is the visual acuity threshold. Context factors How dependent are the results of a 3D subjective quality assessment test on the particular viewing conditions used? This is a typical question about the influence of context. In 3D QoE, context influence factors may include the test environment (standard or non-standard lab environment) and terminal equipment (display or mobile phone), etc. Many studies have been conducted on the influence from test environment when considering quality assessment of 2D multimedia content. The main differences from test environments are lighting, background noise, wall color, objects on the wall, etc., which have been standardized in ITU-R BT.500 [58] for controlled lab environment. For example, in [106], the results obtained for 2D audio-visual quality assessment in a non-standard laboratory versus public environment (coffee room) have been compared, as shown in Figure 2.10. The results indicated that the impact of the environment is not significant when a wide range of quality is considered. Human factors A recent cross-lab study already confirmed the conclusion that human factor is a predominant influence factor on QoE [106]. Generally, human factors include observer’s gender, experience, age, etc. In traditional 2D quality assessment, observer’s experience is an important factor which has been defined in ITU-R
2.4. SUBJECTIVE ASSESSMENT FOR QOE IN 3DTV
21
BT.500[58] to classify the observer as expert observer and naive observer. Generally, it is considered that experts may generate more consistent results [49] but experience oriented, which may influence the results when the expert observer intend (or not intend) to guess the task or objectives of the test. Naive observers may produce a general results from the perspective of customers. However, when the task of the test is hard to understand or operate, the results would be unreliable. Studies showed that expert observers are more critical of lower quality images/videos than the naive observers [46][117]. Recently, the influence from observer’s gender on QoE are gaining more and more attention. For example, in a recent study on 3D QoE of coding videos in IPTV scenarios, the results showed that female observers voted slightly more positive than the male observers though there is no statistical significant difference [140]. The studies in [53] also pointed out that the male and female observers performed differently on the perception of QoE in the context of virtual acoustic environments.
2.4
Subjective assessment for QoE in 3DTV
The complexity of perceiving 3D content as opposed to real-world perception explains the difficulties that naive observers experience when asked to provide an opinion on the QoE of a particular video sample. On one hand they have limited experience with the new technology, notably as opposed to 2D television and, eventually, multimedia content. On the other hand, they may need to counterbalance positive and negative effects such as added depth value and visual discomfort.
2.4.1
Observer context dependency
An observer participating in a subjective assessment experiment cannot be considered isolated from his previous experience and current status. He bases his internal vote on many influence factors which he then expresses towards the outside world, mostly in the form of a vote on a limited scale. Figure 2.11 lists his external experience on the left, notably situations which he has encountered himself, termed “reality”, experience with currently available, often wide-spread reproduction technology such as 2D television, and new reproduction technologies such as 3D. He uses his perception towards the goal of analyzing the scene information itself and the perceived artifacts which is the main task that he is asked to perform. However, he also consumes and interprets the perceived visual and eventually auditive information leading to a match or mismatch with his experience in reality. Last but not least, he also takes into consideration his overall feeling, notably his health conditions which may be divided into perception intrinsic factors, i.e. those related to eyesight, and other health factors which may or may not be related to the task at
22
CHAPTER 2. QUALITY OF EXPERIENCE (QOE) IN 3DTV
Figure 2.11: Model excerpt for a human observer in a subjective assessment task
hand. An example of this context dependency is related to one of the major decision factors when introducing 3D services: their advantage over 2D content. From a subjective assessment point of view, the observer’s habit to watch 2D content on known reproduction technologies is often misleading their judgment for 3D content shown on the new reproduction technology. Their prejudice may impact in two opposite directions. Often, they judge the 3D content mostly on their trained 2D quality aspects, i.e. perceived coding artifacts, blurring degradations, or reduced resolution, for example when judging 3D content on a vertically view-interlaced polarized display. On the opposite side, some observers overestimate the sensation of depth as a new and exciting experience as part of the so-called hype effect. Comparing 2D to 3D videos will therefore always be context dependent. Even when introducing both media types into a single subjective experiment, observers will likely change the context from presentation to presentation, therefore for example either neglecting or overestimating the added depth value. The relationship between “observer context dependency” and human factors on QoE can be considered as but not limited to “one belongs to another”. Considering the influence of observer context dependency on the assessment of QoE, the observers context dependency can be considered as part of the human factors in QoE of 3DTV, in particular, it works similarly to the observer’s experience on QoE of 3DTV. However, considering the objectives of the two terms, “observer context dependency” focuses on its influence on subjective assessment task, which is in particular dependent on the subjective methodology. For example, in a subjective
2.4. SUBJECTIVE ASSESSMENT FOR QOE IN 3DTV
23
test that a reference video is available for the viewers, as the viewers can compare the tested videos with the reference video, the “observer context dependency” might affect the test results less than a subjective test without reference. In contrast to “observer context dependency”, the human factors “observer’s experience” in 3DTV is not constrained to a subjective test task, but represents the influence of observer’s previous experience on the current viewing experience. For example, if we have experienced an excellent 3D movie with the most advanced 3D technology, when we watching a new 3D movie in the theater, our viewing experience might be totally different from those who had never watched 3D movie before.
2.4.2
Multi-scale assessment methodologies
A possible solution to express the observer’s opinion in complex and eventually conflicting situations concerning his internal representations of quality may be to use multiple scales. The observer may judge one aspect such as the perceived image quality independently from other aspects such as the depth quantity or visual discomfort symptoms. These scales have been proposed in Figure 2.8 as basic 3D quality factors. Several assessment methodologies have been developed to allow for assessing multiple dimensions at once or in separate experiments. Assessing all dimensions in a single experiment facilitates the de-correlation between the scales for the observer, i.e. he decides immediately which effect he assigns to which scale. The advantages of individual experiments with a single scale are the reduced experiment duration and the focus of the observer on a single quality perception aspect, i.e. he does not need to change his voting context. In most cases, one of the three following standardized methods was used: – Absolute Category Rating with Hidden Reference (ACR-HR): A single stimulus presentation methodology where the observer votes using a fixed number of attributes per scale, such as the five attributes “excellent”, “good”, “fair”, “poor”, and “bad” [59]. High quality reference sequences are usually included in the experimental setup to allow for calibration of the observer’s voting. Each video sequence is presented only once in random order. – Double Stimulus Continuous Quality Scale (DSCQS): A double stimulus presentation methodology in which the observer watches two different video sequences with one repetition. One of the two video sequences shall be the reference, the other one a degraded version of this reference. He votes for each of the sequences on a semi-continuous integer scale from 0-100 which may be annotated with attributes for easier comprehension [58]. – Subjective Assessment Methodology for VIdeo Quality (SAMVIQ): The ex-
24
CHAPTER 2. QUALITY OF EXPERIENCE (QOE) IN 3DTV periment is ordered by video content. For each of the evaluated video contents, a group of degradations, usually 8-12, are presented in such an interactive interface that the observer may watch each one repeatedly. The reference video sequence is available explicitly and shall be evaluated in a hidden manner amongst the degraded versions. When the observer has provided his opinion for each scale and each video, he validates his choices and continues with the next content [8].
The International Telecommunication Union - Radiocommunications (ITU-R) has started a new 3D recommendation in 2012 [56]. Besides the three primary perceptual dimensions “Picture quality”, “Depth Quality”, and “Visual (Dis)Comfort”, it names two additional perceptual dimensions, “Naturalness” and “Sense of Presence”. Besides the above mentioned methods ACR and DSCQS, it proposes Pair Comparison and Single Stimulus Continuous Quality Evaluation which is reserved for usage when a single vote for a video sequence is not sufficient but a continuous evaluation is preferred. All single value voting methods have the drawback that the 3D content display is interrupted after the playback of a single video sequence and a gray frame shall be shown. This distracts the 3D vision on 3D displays such that the observer requires time at the start of the next sequence before perceiving the 3D effect to its full extent [123]. A solution to this has been proposed by using a continuous playback such as a 3D movie film. Intervals that shall be voted for are marked with overlayed numbers and the observer shall provide a vote for the complete interval [42].
2.4.3
Attribute selection
Besides choosing the scales for a subjective assessment, the attributes used for voting need consideration. When using categories in different languages, important differences may occur, leading to the requirement of aligning the scales from one country to another. It was shown that in many languages the currently employed attributes are not equidistant either and that service acceptance thresholds may vary largely [109]. Assuming that the groups of observers in four different languages would vote for a common average value when judging the same video sequences, a numerical fitting of attributes has been calculated based on the attribute positions for the French scale as used by Rumsey et al.[109]. This led to Figure 2.12 which shows the experimental results for the 3D experiments with long bars [5] and the results from [109] with shorter bars. While the usual terms “Excellent”, “Good”, “Fair”, “Poor” and “Bad” are used for both “image quality” and “depth quality”, the ITU-R has introduced the scale items “Very comfortable”, “Comfortable”, “Mildly uncomfortable”, “Uncomfortable”, and “Extremely uncomfortable” for visual dis-
2.4. SUBJECTIVE ASSESSMENT FOR QOE IN 3DTV
25
Figure 2.12: Usage of attributes in four different languages under the assumption that the same MOS value would have been obtained. The long bars indicate experimental finding in a 3D QoE experiment[5], the shorter bars represent the positions published in [109]. comfort [56]. The drawback of this scale is that the attributes are hard to associate and to distinguish for untrained observers. A typical observer question would be: “How comfortable is 2D viewing on this scale?”.
2.4.4
A possible solution: Paired Comparison
As mentioned above, multi-scale experiments only evaluate a particular quality aspect. In addition, the selection of category descriptions for the scales may alter the meaning of the scales in different situations such as viewing contexts or languages and therefore determining an overall quality remains a challenge. However, Paired Comparison methodology may provide a solution. The Paired Comparison methodology is already a standardized subjective video quality assessment method for multimedia applications [59]. The observers compare two video sequences to each other and note their preference, e.g., if there are N video sequences, the observers would compare N (N − 1) pairs with different presentation order in one pair (Video A first then B, or Video B first then A). Pair comparison has its advantages to solve the “observer context dependency” and “attribute selection” issues. For example, for a naive viewer who is not used to 3D television, it might be difficult for him to vote on an absolute psychophysical scale for the ”viewing experience” of a video sequence. However, when using paired comparison, the question is quite simple for the viewer: ”which one do you prefer?”. This question contains a combined information from the viewers about the “depth perception”, “image quality”, “visual discomfort”, etc., which is also the definition of QoE in 3DTV. Another important thing is that viewers do not need to consider the scale problems but only judge on a binary value, “this” or “that”. Thus, paired comparison might avoid the problems of language dependency and cross-lab
26
CHAPTER 2. QUALITY OF EXPERIENCE (QOE) IN 3DTV
score alignment that occurred for example with ACR method [5]. Due to the possible reliability of paired comparison method on assessment of QoE in 3DTV, one of the objectives of this thesis is focusing on the application of this method on the assessment of QoE, in particular, why this method is reliable, what is the disadvantage of this method compared with other methods, how to improve it, how to apply it in real subjective test, and how to analyze the data, etc. For more details, the readers are referred to Part I of this thesis.
2.5
Conclusions
This chapter introduces the state-of-the-art work on Quality of Experience in S-3DTV. For better understanding, we firstly introduce some basic knowledge on stereoscopic perception and 3D display technology. Then, the definition of 3D QoE is introduced, where a distinction with the traditional concept on 2D “quality” is explained. In particular, the “added depth” perception and “visual discomfort” of S3DTV are introduced. Due to the “multi-dimensionality” of the QoE in 3DTV, there are plenty of possible factors that might affect it. Thus, the state-of-the-art work on the study of influence factors of 3D QoE is introduced. Finally, one of the most challenging issue in QoE, i.e., subjective assessment methodology is illustrated, including the problems and possible solutions.
I Paired comparison methodology: Optimization, evaluation and application
27
3 Subjective assessment methodology in 3DTV: Paired comparison Part I of this thesis is focusing on the study of subjective assessment methodology on QoE of 3DTV. As introduced in Chapter 2, the subjective assessment is a challenging work due to the “multidimensionality” of the QoE in 3DTV, the context dependency from observers, and languages, etc. A possible solution called “Paired Comparison” has been mentioned in Section 2.4.4. In this chapter, more details about Paired Comparison are introduced.
3.1
Introduction
In Section 2.4.4, a possible solution for the subjective assessment on QoE of 3DTV called Paired Comparison was introduced. Recently, some studies on subjective assessment methodology in 3DTV have shown the advantages and possibilities of the Paired Comparison on assessment of QoE. Some examples of these studies are shown in the following part. The first example is about the viewer’s behavior in 3D subjective assessment test [35]. In this study, a subjective experiment on 3D video quality and comfort was conducted. The test methodology is the 5-point ACR method. Each observer was asked to provide two scores for visual quality and visual comfort after watching one video sequence. To better understand the behavior of the viewers, four typical histograms of the viewer’s result on quality and comfort ratings are selected as shown in Figure 3.1. Observer 10’s result is very typical in a subjective test where both the quality score and visual comfort scores are reasonably distributed. Observer 17 29
30
CHAPTER 3. PAIR COMPARISON METHODOLOGY
Figure 3.1: An example of 4 observers’ results on co-joint quality and visual comfort from [35]. might not be able to distinguish visual comfort and overall quality very well because the comfort and quality scores are highly correlated. Observer 18 seems to utilize the quality scale very well but for visual comfort, only the middle part of the scales was utilized. Observer 22 only used a very small range of ratings to evaluate both 3D video quality and comfort. As the two scores were provided by the observers simultaneously in one individual test, observers may feel confused at some time and the possibility of voting dependency may be increased, which might affect the results. This study shows the possible problems of single-scale rating based assessment methodologies on QoE of 3DTV. Another example is about the comparison on discriminability of the two test methodologies on 3D image quality assessment [83]. The subjective assessment of 3D image quality was conducted using SS (Single Stimulus) and Paired Comparison methods in two separate experiments with different viewers. To evaluate the discriminability of the two methodologies, the SS results were converted to paired comparison data. Then, the averaged preference difference of all pairs were calculated for both methodologies as the discriminability measures. The results are shown in Figure 3.2. It is indicated that besides the video “sof.”(a video content), paired comparison always outperforms the SS methodology in terms of the discriminability. This conclusions is also supported by another subjective experiment about 3D synthesized view assessment in [9]. The discriminability difference between the two test methodologies in these studies might be influenced by two factors: the test methodology itself and ob-
()*+,)-)./0)1)23
012345678992 � 2 3.2. STANDARDIZED PAIR COMPARISON METHOD
�����4 ��454���4243� " 56� 1�6 9�3�6 4��26 345121
;; ������7 �4�67�95 ��4 9� 7 � 1 5 � 8 1 �42 9 � � � 2 6 �� 2 � 9 � 9 � 2 7 � �� 5 � �� 1 2 �� �5 � 5
6 � � � 5
� � �� 1 2 �= 2 � 5 H 4� � 9 7 � 8
42
� �6 � � � 9 � ������� G relative the eyes a ����������"���"��������������� "� ����45 �� ��� �� !����images �� ��� �"� ��!� #� ��2��� �2�7�7optic ��� �� 2��� ���7� 7rotation 62�7� 26��� �� �1of ��! 1� 2�the �942 9�942 �2�����"� 5��to �12���5 �69�� 9two 2����0�1� ������ �� ��5around
��� 98�!"� 9� �89 � 2the 2�
��� ��� �����5�axis, �12���5�)generating *� ���;�*#���!���!���!�+"��������torsional ����$ 2!��� ������������Data ��#! !��mean �����values ��-�����of ���9���subjects ����!�����[134]. #��� disparity. are��� the ��������/�������!$�"��"���!���#�������!�����;�"������������������������"������������������ ������� ������!��$""+#�����1!�������������������1 I$=""���!����������!����������LMN��������"������$0�����������������"�!��������"�!��!���;����� �����1�������������$ 2!�����!����������!�����!��������������"���������������$ 2!�����������"��� �������������������1!����G����������������$ P5 89 � 7�9
116
CHAPTER 7. VISUAL DISCOMFORT IN 3DTV: STATE OF THE ART
Crosstalk Crosstalk, or image ghosting, in stereoscopic displays refers to imperfect image separations where the left-eye view leaks to the right-eye view and vice versa. Crosstalk can be classified into system crosstalk and viewer crosstalk. System crosstalk is only induced by the display technology, it is independent of the quality of stereoscopic image pairs while the viewer crosstalk is dependent on the video contents. Studies showed that visibility of crosstalk increases with increasing contrast and increasing binocular disparity (depth) of the stereoscopic image [112]. Even a small amount of crosstalk would induce visual discomfort or visual fatigue [103]. Studies on the thresholds of crosstalk level for the acceptance of the viewing experience and visual discomfort have been conducted. In [17], they found that “crosstalk between 2 and 6% significantly affected image quality and visual comfort”. In [75], they found “crosstalk level of about 5% is sufficient to induce visual discomfort in half of the population”. In [44], they reported that the crosstalk tolerance limit is 5% 10%, and visual detection limit is 1% - 2%. In [141], it is shown with natural still images that the S-3D display technology with the lowest luminance and contrast level tolerates the highest level of crosstalk, while still maintaining an acceptable image-quality level.
7.2.4
Motion
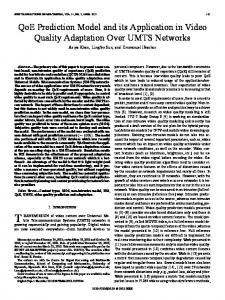
Motion in 3DTV can be classified into planar motion (or lateral motion) and in-depth motion. Planar motion means that the object only moves in a certain depth plane perpendicular to the observer, and the disparity does not change temporally. In-depth motion, which is also called motion in depth or z-motion, is defined as object movement towards or away from an observer [47]. For planar motion, both eyes make the same conjunctive eye movements, called version [21]. For in-depth motion, the eyes make opposite, disjunctive eye movement, called vergence [48]. The eye movements for the planar motion and in-depth motion are shown in Figure 7.6. The speed of the planar motion and in-depth motion can be expressed by the change of distance per second or the change of the visual angle (version or vergence) per second. Fast motion can induce visual discomfort even if the object is within the comfortable viewing zone [149][118]. Studies showed a consistent conclusion on the influence of motion velocity on visual discomfort, i.e., visual discomfort increases with the in-depth motion velocity [121][149][118][21], and for planar motion video sequences, visual discomfort increases with the planar motion velocity [121][84].
7.3. SUBJECTIVE ASSESSMENT METHODOLOGY A RN
A RN +1
A LN
A LN +1
A LN +1 A N
Screen
AN
117 A RN +1
Screen
A N +1 A N +1
R
L
L
R
Figure 7.6: The left figure shows the eye movement of the planar motion object. Planar motion velocity is the amount of the change of the version per second. The right figure shows the eye movement of the in-depth motion object. In-depth motion velocity is the amount of the change of the vergence per second. AN represents the perceived virtual object at frame N , ALN and AR N represent the left and right view images on the screen at frame N .
7.3
β
α
γ
Subjective assessment methodology
In ITU-R BT.2021 [56], four assessment methods are recommended for measuring visual discomfort, which are a subset of the methods from Recommendation ITU-R BT.500 [58]. These four methods are: – – – –
the single-stimulus(SS) method; the double stimulus continuous quality scale (DSCQS) method; the stimulus-comparison (SC) method; the single stimulus continuous quality evaluation (SSCQE) method.
Compared with the 2D quality assessment scale labels, the labels for visual discomfort are slightly different, for example, the discrete five-grade scales or the continuous comfort scales are labeled with “Very comfortable”, “Comfortable”, “Mildly uncomfortable”, “Uncomfortable”, and “Extremely uncomfortable”, as shown in Figure 7.7. These methods were already widely used in the community of S-3DTV. For example, in [150], the SSCQE method was used as it can measure the influence of stimulus duration on visual discomfort or visual fatigue. In [118][116][121] and [115], the five-grade SS method was used. Questionnaires are also popular for the measurement of visual discomfort. The simulator sickness questionnaire (SSQ) is a well known and well established questionnaire which is used to evaluate motion sickness caused by motion images [68]. The test items in SSQ include “General discomfort”, “Fatigue”, “Headache”, “Eye strain”, “Difficulty focusing”, “Blurred vision”, etc. The participants are asked to
118
CHAPTER 7. VISUAL DISCOMFORT IN 3DTV: STATE OF THE ART
Discrete scale
Continuous scale
5 Very comfortable 4 Comfortable 3 Mildly comfortable 2 Uncomfortable 1 Extremely uncomfortable
Figure 7.7: Example of scale labels for subjective assessment of visual discomfort. fill the questionnaire item by item and select the answers from “None”, “Slight”, “Moderate” and “Severe”. Ohno and Ukai [102] developed their own questionnaire based on SSQ and List of Symptoms of Visual Fatigue from [120]. In [76], the authors developed a new questionnaire which is used to subjectively assess visual fatigue caused by viewing various types of motion images.
7.4
Objective psychophysical prediction
Besides the subjective assessment methods, visual discomfort or visual fatigue induced by 3DTV may be predicted or measured by objective psychophysical devices. For example, Electroencephalography (EEG) and Functional Magnetic Resonance Imaging (fMRI) have been used to assess the brain activities which are related to the processing and reactions to the stimuli, e.g., emotion, visual fatigue. Electromyography (EMG) and Electrooculography (EOG) are used to detect the activities related to the eyes, e.g., electrical activity produced by skeletal muscles of the eyes and eye movement. Furthermore, eye blinking rate might be changed in different viewing conditions, which could be used to predict visual discomfort or visual fatigue.
7.4.1
Electroencephalography (EEG)
In clinics, EEG is often used to detect disorders of brain activity or to monitor certain procedures, e.g., the depth of anesthesia. Recently, it has been adopted in psychophysical studies on the relationship between brain activity and 3D QoE. It is shown that stereoscopic 3D videos would elicit responses from certain brain regions which relate to stereo perception processing, visual discomfort/fatigue, emotion, etc. Brain waves can be classified into four basic groups according to the frequency
7.4. OBJECTIVE PSYCHOPHYSICAL PREDICTION
119
band: gamma (25-100Hz) [52], beta (12-30Hz) [107], alpha (8-12Hz), theta (47Hz) and delta (0.1-4Hz) bands [125][73]. Different brain activities are reflected on different bands. For example, alpha activity is induced by closing the eyes or by relaxation, and abolished by thinking or calculating. The gamma band is related to high cognitive processes. These selected responses of brain regions allow for discovering the relationship between the test stimuli and a certain attribute of the QoE. For example, in the study of [73], the authors used an EEG device to compare the brain activity between watching 2D and 3D video sequences. The results showed that the power of the EEG signals in beta frequency was significantly higher when watching 3D contents, which might be related to either visual discomfort or visual fatigue.
7.4.2
Functional Magnetic Resonance Imaging (fMRI)
fMRI is an MRI procedure that measures brain activity by detecting associated changes in blood flow. Compared to EEG, fMRI is more precise in understanding the human brain regions related with the stereoscopic perception due to its high spatial resolution. A large amount of efforts have been dedicated to measuring human cortical activity when viewing stereoscopic stimuli [70]. It was discovered that while watching stereoscopic images, the stereoscopic shape recognition and the corresponding processing were probably performed in certain regions [3][130][40]. For example, in [70], the authors used fMRI to test visual fatigue when watching stereoscopic images. The results indicated that V3A (a cortical visual area, for more details please refer to [129]) is related to stereoscopic perception as the activation at V3A is much stronger when watching stereoscopic images rather than 2D images. In addition, the results showed that there were strong activities in the frontal eye field (FEF) when watching 3D images with large disparities. This conclusion is consistent with some previous EEG studies which showed that the areas near the prefrontal cortex (PFC) were related with 3D visual fatigue [34][86].
7.4.3
Electromyography (EMG)
Usually, EMG is used to analyze the neuromuscular activation of muscles within postural tasks, functional movements, work conditions and treatment or training regimes. EMG often measures not only at the extremes of the muscle but also along the muscle. As visual fatigue is defined as a decrease of the performance of the human vision system produced, it may be possible to use EMG to detect muscle activities around the eyes and to find a relationship between the muscle activities and the visual fatigue/discomfort.
120
CHAPTER 7. VISUAL DISCOMFORT IN 3DTV: STATE OF THE ART
Nahar et.al [97] studied the EMG response of the orbicularis oculi muscle to “low-level visual stress” conditions, where “low-level” means the work conditions in which muscles are activated at a level that can be maintained for a long period of time. The results showed that for conditions that visual fatigue may stem from eyelid squinting (e.g., refractive error, glare), the power of the EMG response increased with the degree of eyestrain.
7.4.4
Eye Blinking
Eye blinking rate is a possible indicator for predicting visual discomfort or visual fatigue. Studies showed that when in relaxed conditions, people would blink more often than in book reading and computer reading tasks [131]. In [82][151], the results showed that blinking rate was higher when watching 3D video than 2D videos. The study of [69] gives the conclusion that eye blinking rate increases with visual fatigue when watching 3D images. For the conditions of watching screens, the blinking frequency was significantly decreased when fatigue was reported (e.g., reading information from the screen for a long time) [30].
7.5
Conclusions
Visual discomfort is a very important dimension in QoE of 3DTV. In this chapter, we introduced the state-of-the-art studies on visual discomfort, including the definitions on visual discomfort and visual fatigue which is often interchanged in literature; the possible factors that may induce visual discomfort; the subjective assessment methodologies, and the psychophysical measurement methods on visual discomfort. In the following chapters, the challenging issues in visual discomfort will be studied, i.e., how the 3D motion components affect visual discomfort; how individual differences affect the test results; what is the influence of the test methodologies on measuring visual discomfort; the development of an objective visual discomfort model for 3D videos; and a more accurate psychophysical prediction method for visual discomfort.
8 Subjective assessment on visual discomfort in 3D videos: influence of 3D motion It is well accepted that large disparity and large amount of motion are two main causes of visual discomfort. To quantify this influence, three objectives are set in this chapter. The first one is the comparative analysis on the influence of different types of motion, i.e., static stereoscopic image, planar motion and in-depth motion, on visual discomfort. The second one is the investigation on the influence factors for each motion type, for example, the disparity offset, the disparity amplitude and velocity. The third one is to propose an objective model for visual discomfort. In addition, the influence from viewers’ 3D experience, i.e., the differences between experts and naive viewers are studied.
8.1
Introduction
As we already introduced in Section 7.2, there are many possible factors that would induce visual discomfort. Most of the causes have been well studied for the case of still stereoscopic images. For stereoscopic 3D videos, as the only difference between stereoscopic image and video is the motion, the influence of motion on visual discomfort has been widely investigated recently. In-depth motion is one of the significant factors that may cause visual discomfort. Studies already showed that visual discomfort increases with the in-depth motion velocity [121][149][118][84][21]. However, the influence from disparity am121
122CHAPTER 8. INFLUENCE OF MOTION ON VISUAL DISCOMFORT IN 3DTV plitude (disparity range) and the disparity type (crossed or uncrossed) of in-depth motion on visual discomfort are still under study. In [118], the results showed that disparity amplitude of the moving object is not a main factor. However, in their recent study [121] it is shown that visual discomfort increases with the disparity amplitude. Furthermore, the results also showed that the in-depth motion with crossed disparity would induce significantly more visual discomfort than the uncrossed and mixed conditions. In [84], as they only analyzed the in-depth motion in the disparity range of ±1 degree with different velocities, there is no conclusion about the influence of crossed or uncrossed disparity amplitude on visual discomfort. The influence of the planar motion on visual discomfort was studied as well [121][88][84][87]. These studies showed high consistency on the conclusion that visual discomfort increases with the motion velocity. However, the influences of the disparity on visual discomfort led to different conclusions in these studies. In [84], the results indicated that the disparity type, i.e., crossed and uncrossed disparity, did not affect the visual discomfort thresholds. However, in [121], the results showed that the crossed disparity will generate more visual discomfort than the uncrossed disparity. A possible explanation for this inconsistency might be the position of the background. In [84], the background was positioned at the screen plane. In [121], the position of the background was not depicted but in their previous study [118], the background was positioned at a fixed place with the disparity of -2.6 degree. The impact of the position of background on visual discomfort may therefore require further study. Most of the studies mentioned above investigated the influence of the in-depth motion and planar motion on visual discomfort individually. For quantifying the influence of static situations, planar and in-depth motion, it would be important to directly compare their impact on visual discomfort. Thus, this chapter is focusing on the influence of motion on visual discomfort of 3DTV, including the comparative analysis on the influence of different motion types on visual discomfort, the influence of disparity and velocity within a certain motion type and the proposal of an objective visual discomfort model based on the results. In addition, the influence of viewers’ experience (experts and naive observers) on 3DTV is analyzed.
8.2
Experiment
Based on the two main objectives, i.e., analysis on the influence from motion and the study on the influence from human factors, two experiments were designed as shown in Table 8.1.
8.2. EXPERIMENT
123
Table 8.1: Summary of the two experiments. Item Study target Num. of stimuli Method Display technology Resolution Viewing distance Num. of observer Observer type Gender Age (mean) Trials/obs Votes/Stimulus Pair
8.2.1
Exp 2
Exp 1
Exp2-a
Exp2-b Human factors 15 (planar) FPC Shutter glasses Full HD, 1920 × 1080 3H, 90cm 42 10 45 Naive observer Experts Naive observer 21 males + 21 females 8 males + 2 females 21 males + 24 females 19-48 (26.8) 24-43 (27) 18-44 (24) 180 pairs 210 pairs 105 pairs 42 15 45
Influence from motion 36 (static+planar+in-depth) ASD
Definitions
To analyze the influence of crossed and uncrossed disparity, and the disparity magnitude of the moving object on visual discomfort, in this study, we use disparity amplitude and disparity offset to define the motion in stereoscopic videos. The disparity amplitude da between the nearest point A and farthest point B can be expressed by Equation (8.1) which represents the range of the disparity of the moving object. φA represents the disparity of point A, and φB represents the disparity of point B. The disparity offset do between the two points A and B can be expressed by Equation (8.2) which represents the center of the angular disparity between the two points. The static and planar motion stimuli can be characterized by the disparity offset and the planar velocity, where the disparity amplitude equals zero. The in-depth motion stimuli can be defined by the disparity amplitude, the disparity offset and the in-depth velocity. da = |φA − φB | (8.1) do =
8.2.2
1 (φA + φB ) 2
(8.2)
Experimental design
To avoid the complexity of the influence factors contained in 3D natural video sequences, the synthetic stimuli were decided to be used in this study allowing for precise control on the possible influence factors, including motion type, velocity, disparity offset and disparity amplitude. In Experiment 1, 36synthetic video stimuli were used, including 15 planar motion stimuli, 5 static stimuli and 16 in-depth motion stimuli. For the planar motion stimuli, we selected five angular disparity offset levels
124CHAPTER 8. INFLUENCE OF MOTION ON VISUAL DISCOMFORT IN 3DTV (+1.3 deg.) (+0.65 deg.) (-0.65 deg.) (-1.3 deg.) 131.28cm 106.79cm 68.46cm 77.77cm Screen Viewer Viewing distance 90 cm Background 136.28cm (-1.4 deg.)
Comfortable viewing zone 76.27cm (+0.2D)
109.76cm (-0.2D)
Figure 8.1: The relationship of the foreground and the background position and the comfortable viewing zone in planar motion stimuli. en 3
5
1
0
- 4 -
5
-1
- 3 ee d
(0, ±0.65, and ±1.3 degree) and three velocity levels (slow, medium, and fast with velocity of 6, 15 and 24 degree/s). A background is designed to be placed at a fixed position (-1.4 degree) which is consistent with a typical natural video content - 5 - 5 5 5 where the background is almost fixed and placed behind the screen. Figure 8.1 shows the disparities used in the planar motion stimuli and their relationship with the comfortable viewing zone. en L
For the static condition, five disparity offset levels were selected which were the γ A α β F same as the planar motion design. The foreground object Bstays fixed in the center of the screen at a certain disparity plane. R For the in-depth motion condition, four disparity amplitude levels (0.65, 1.3, 2 and 2.6 degree), three disparity offset levels (-0.65, 0, 0.65 degree) and three velocity levels (1, 2, and 3 degree/s, binocular angular degree) were selected. The reason for choosing binocular angular disparity speed was that the object’s velocity appears visually constant which is not the case for a constant value in the unit of cm/s. The direction of the movement is inverted at the far or at the near end of the movement so the object in the experiment moved forth and back in an endless loop. The three velocity levels 1, 2 and 3 degree/s represent slow, medium and fast, respectively. Figure 8.2 shows the design of the disparity amplitude and disparity offset for the in-depth motion. In experiment 2, only the 15 planar motion stimuli were used. Two types of viewers participated in the test, one being expert viewers who work in 3-D perception, coding, quality assessment and subjective experiments and know very well about the 3D depth perception, visual discomfort, etc. The others were naive viewers, who do not have experience in this domain.
- -
8.2. EXPERIMENT
125 Screen
+1.3
+1
+0.65
-1.4
0
-0.65
-1
-1.3 Degree Background
+0.325
+0.975
-0.975
-0.325
Figure 8.2: The disparity amplitude and offset design for in-depth motion stimuli. The arrows represent the depth interval in which the object moves. en L
8.2.3
Apparatus
β
A
α
F
γ
B
R
The stereoscopic sequences were displayed on a Dell Alienware AW2310 23inch 3-D LCD screen (1920×1080 full HD resolution, 120Hz), which featured 0.265-mm dot pitch. The display was adjusted for a peak luminance of 50 cd/m2 when viewed with the active shutter glasses. The graphics card of the PC was an NVIDIA Quadro FX 3800. Stimuli were viewed binocularly through the NVIDIA active shutter glasses (NVIDIA 3D vision kit) at a distance of about 90 cm, which was approximately three times the picture height. The peripheral environment luminance was adjusted to about 44 cd/m2 . When seen through the eye-glasses, this value corresponded to about 7.5 cm/m2 and thus to 15 % of the screen’s peak brightness as specified by ITU-R BT.500 [58].
8.2.4
Stimuli
The stereoscopic sequences consisted of a left-view and a right-view image which were generated by the MATLAB psychtoolbox [12][105]. Each image contained a foreground object and a static background. A black Maltese cross which was frequently used in such kind of psychometric experiments [38][92] was used as the foreground object with a resolution of 440×440 corresponding to visual angle of 7.6 degree. As it contained both high and low spatial frequency components, it was supposed to limit the influence of one particular spatial frequency in the experiment [101]. The background was generated by adding salt and pepper noise to a black image of Full HD resolution, and then filtered by a circular averaging filter with radius of 5. The background is shown in Figure 8.3. The reason for using this kind of image as the common background of all stimuli was that it could preclude all of the monocular cues on stereopsis. For the planar motion stimuli, the trajectory of the moving object is a circle with
126CHAPTER 8. INFLUENCE OF MOTION ON VISUAL DISCOMFORT IN 3DTV
Figure 8.3: The background image of the synthetic stimuli. center point at the center of the screen, and radius of 300 pixels, approximately 10 degree of visual angle. The motion direction of the object was anti-clockwise. An example of the stimuli is shown in Figure 8.4(a), in which the foreground object is placed in front of the screen with an angular disparity of 1.3 degree. For the static stimuli, the Maltese cross was positioned at the center of the screen. For the indepth motion stimuli, the Maltese cross was positioned in the center of the screen and moved back and forth to the viewers. An example is shown in Figure 8.4(b), in which the foreground object is moving in the depth plane with disparity amplitude of 2.6 degree and offset of 0 degree. The 15 planar motion stimuli, 5 static stimuli and 16 in-depth motion stimuli used in the subjective experiment are listed in Table 8.2 with their stimulus serial number, disparity offset do , disparity amplitude da , planar motion velocity vp and in-depth motion velocity vd .
8.2.5
Viewers
42 viewers participated in Experiment 1. 21 are male, 21 are female. They are all non-experts in the domain of subjective experiments, image processing or 3D. Their age ranged from 19 to 48 with an average age of 26.8. 10 experts in 3-D perception, coding, quality assessment and subjective experiments participated in the Experiment 2-a. Eight experts are male, two are female. Their ages ranged from 24 to 43 with an average age of 27. As the number of viewers is too small, to generate a reliable result, 5 of them conducted the test twice but on a different day. Thus, for each pair, there are 15 observations in total. 45 naive viewers participated in the Experiment 2-b. Twenty-one are male, twenty-four are female. They are all non-expert in subjective experiment, image processing or 3D related field. Their ages ranged from 18 to 44 with an average age of 24. All of the viewers have either normal or corrected-to-normal visual acuity. The visual acuity test was conducted with a Snellen Chart for both far and near vision.
8.2. EXPERIMENT
127
Background Screen Foreground
-1.4 deg. 0 deg. +1.3 deg.
(a)
Background Screen Foreground
-1.4 deg. -1.3 deg. 0 deg. +1.3 deg.
(b)
Figure 8.4: (a) An example of stimulus with planar motion in the experiment. The foreground object is moving at the depth plane with a disparity of 1.3 degree. The background is placed at a fixed depth plane of -1.4 degree. The motion direction of the Maltese cross is anti-clockwise. (b) An example of stimulus with in-depth motion in the experiment. The disparity amplitude of the Maltese cross is 2.6 degree, offset is 0 degree. The foreground object is moving in depth between disparity +1.3 to -1.3 degree back and forth.
128CHAPTER 8. INFLUENCE OF MOTION ON VISUAL DISCOMFORT IN 3DTV
Table 8.2: All stimuli used in the experiment. do is disparity offset, da is disparity amplitude, vp is planar motion velocity and vd is in-depth motion velocity. The last two columns are BT score and confidence interval of the BT score (CI) which are discussed in Section 8.3.
In-depth motion
Static
Planar motion
Type
Number 1 2 3 4 5 6 7 8 9 10 11 12 13 14 15 16 17 18 19 20 21 22 23 24 25 26 27 28 29 30 31 32 33 34 35 36
do (deg.) -1.3 -1.3 -1.3 -0.65 -0.65 -0.65 0 0 0 0.65 0.65 0.65 1.3 1.3 1.3 -1.3 -0.65 0 0.65 1.3 0 0 0 0 0 0 0 0 0 -0.65 -0.65 -0.65 -0.65 0.65 0.65 0.65
da (deg.) 0 0 0 0 0 0 0 0 0 0 0 0 0 0 0 0 0 0 0 0 1.3 1.3 1.3 2 2 2 2.6 2.6 2.6 1.3 1.3 0.65 0.65 1.3 1.3 0.65
vp (deg./s) 6 15 24 6 15 24 6 15 24 6 15 24 6 15 24 0 0 0 0 0 0 0 0 0 0 0 0 0 0 0 0 0 0 0 0 0
vd (deg./s) 0 0 0 0 0 0 0 0 0 0 0 0 0 0 0 0 0 0 0 0 1 2 3 1 2 3 1 2 3 1 3 1 3 1 3 3
BT score 0 1.70 3.56 1.03 2.09 3.40 1.80 2.44 3.61 2.36 2.84 3.85 3.10 3.58 4.22 0.90 2.39 3.89 5.86 7.39 4.70 5.35 5.76 4.82 5.45 6.14 4.99 5.95 6.24 4.00 5.50 3.97 5.00 5.34 6.04 5.99
CI 0.42 0.33 0.27 0.37 0.31 0.27 0.35 0.31 0.26 0.31 0.29 0.27 0.27 0.27 0.26 0.38 0.30 0.26 0.24 0.25 0.25 0.24 0.24 0.25 0.24 0.24 0.25 0.24 0.24 0.26 0.24 0.27 0.25 0.24 0.24 0.24
8.2. EXPERIMENT
129
The Randot Stereo Test was applied for stereo vision acuity check, and Ishihara plates were used for color vision test. All of the viewers passed the pre-experiment vision check.
8.2.6
Assessment Method
The paired comparison method was used in this test. As there are 36 stimuli in Experiment 1, to reduce the number of comparisons, the ASD method was used which has been introduced in previous chapters (Chapter 4 and 5). In Experiment 2, as only 15 stimuli were considered, the FPC method was used. In Experiment 1, according to ASD method, 36 stimuli lead to a total of 180 pairs for each viewer. In Experiment 2-a, only 10 experts conducted the experiment. In order to produce more reliable results, each viewer conducted the test using the FPC method and both presentation orders for each pair were considered, i.e., each stimulus pair will be shown twice but with different order, the stimulus which is shown firstly in one !trial will be shown secondly in another trial. Thus, there were 15 in total 2 × = 210 pairs for each viewer in Experiment 2-a. In Experiment 2 2-b, a total of 105 pairs were presented to each viewer. The presentation order of the stimulus pair was different for odd numbered and even numbered viewers. For example, viewers with even numbers will watch stimulus A first, then stimulus B. For odd numbered viewers, this order is inverted. This is used to balance the presentation order. The presentation order of each stimulus pair in all experiments was randomly permuted for each viewer.
8.2.7
Procedures
The subjective experiments contained a training session and a test session. Five pairs of stimuli were shown in the training session. The viewers were asked not to stare at the moving object but to watch the whole stereoscopic sequence. Then, they should select the one which is more uncomfortable, concerning e.g., mental uneasiness. The viewers used two distinct keys to select one of the two stimuli in a pair for immediate visually check on the screen. There was a minimum duration for the display of each stimulus before making a decision by pressing a specific third button. The minimum duration is defined as either 5 seconds or the duration of a complete cycle of movement (the moving object went back to its start point) whichever was longer. During the training session, all questions of the viewers were answered. We ensured that after the training session, all of the viewers knew about the process and task of this experiment clearly.
130CHAPTER 8. INFLUENCE OF MOTION ON VISUAL DISCOMFORT IN 3DTV In the main test session, 180 pairs were compared for Experiment 1, 210 pairs for Experiment 2-a, and 105 pairs for Experiment 2-b. As the duration of each test was different due to the number of pairs and individual differences of each viewer, and to avoid visual fatigue caused by long time watching affecting the experimental results, the Experiment 1 and Experiment 2-b were split into two sub-sessions. Each session contained half of the total number of stimulus pairs. There was a 10-min break between the two sub-sessions. For Experiment 2-a, the viewers were asked to have a 15 minutes break after each 30 minutes of the test.
8.3
Results of Experiment 1: Influence of motion
The Bradley-Terry (BT) model [10][11] is used to convert the pair comparison data to psychophysical scale values for all stimuli, more details about BT model can be found in Chapter 3. The BT scores and confidence intervals of all stimuli are shown in Table 8.2. For easier comparison, the lowest BT score is set to 0. The static condition can be considered as either a special case of the planar motion or in-depth motion, both with the motion velocity of 0. Thus, in this section, the static condition is analyzed in both conditions.
8.3.1
Planar motion and static conditions
The BT scores for the planar motion stimuli and static stimuli are shown in Figure 8.5 where the static condition can be considered as a special case of the planar motion. The experimental results on the planar motion stimuli showed that: – Visual discomfort increases with the planar motion velocity; – The vergence-accommodation (VA) conflict might not significantly affect the visual discomfort. As shown in Figure 8.5(a), the visual discomfort neither reaches the minimum at the screen plane nor increases with the absolute value of disparity offset. – The relative disparity ro between the foreground and the background (ro = do +1.4 in this study) determines the visual discomfort, i.e., visual discomfort increases with the relative disparity. A possible explanation of the influence of VA conflict and relative disparity on visual discomfort in our study might be the existence of the background. During the test, the viewers switched their attention between the background and the foreground, the larger of this distance, the larger of the change of VA conflict, which may lead to more visual discomfort. For the static stimuli as shown in Figure 8.5(a), the visual discomfort increases with the relative disparity as well. Under the condition of small relative disparity,
8.3. RESULTS OF EXPERIMENT 1: INFLUENCE OF MOTION
131
Figure 8.5: The Bradley-Terry scores of the static and planar motion stimuli. (a) Different lines represent different velocity levels, where static, slow, medium and fast represent 0, 6, 15 and 24 degree/s. (b) Different lines represent different disparity offset levels. Bradley-Terry scores represent the degree of visual discomfort. Error bars are 95% confidence intervals of the BT model fit.
i.e., ro = 0.1 degree (do = −1.3 degree), the visual discomfort induced by static stimuli is less than the planar motion stimuli with medium or fast velocities. However, the gradient of the curve for the static case is steeper than the planar motion conditions. Thus, the visual discomfort increases faster with the disparity offset for the static stimuli than for the planar motion stimuli. By interpolating the static stimulus curve, when the static stimuli is very close to the background, i.e., with disparity offset close to -1.4 degree, the generated visual discomfort might be similar to the condition where the stimulus with similar disparity offset but slow planar motion. In the condition of disparity offset equals to zero degree (ro = 1.4 degree), the static stimuli would generate similar visual discomfort as the fast planar motion stimuli. When the disparity offset is larger than 0 degree, the visualization of static objects seems to induce more visual discomfort than planar motion stimuli. A different interpretation of this results is that when the relative disparity between the foreground and the background is increasing and the disparity offset becomes crossed, the planar motion seems to help to reduce visual discomfort when compared to the static condition. In our experiment, the viewers explained that when watching the planar motion stimuli, it was easier to fuse the Maltese cross compared to the static conditions, in particular when the disparity is crossed. As shown in Figure 8.5(b), for the planar motion condition, there might be a minimum in the curve of visual discomfort that would be located at some velocity in between static and the slowest velocity that was included in this study.
132CHAPTER 8. INFLUENCE OF MOTION ON VISUAL DISCOMFORT IN 3DTV In-depth motion stimuli 6.5
6
6
5.5 5 do=-0.65,slow do=-0.65,fast do=0,slow do=0,medium do=0,fast do=0.65,slow do=0.65,fast
4.5 4 3.5
0.65
1.3 2 2.6 Disparity amplitude (degree)
Bradley-Terry scores
Bradley-Terry scores
In-depth motion stimuli 6.5
5.5 5 do=-0.65,da=0.65 do=-0.65,da=1.3 do=0,da=1.3 do=0,da=2 do=0,da=2.6 do=0.65,da=0.65 do=0.65,da=1.3
4.5 4 3.5
1
(a)
2 Velocity (degree/s)
3
(b)
Figure 8.6: The Bradley-Terry scores of the in-depth motion stimuli. (a) The xaxis represents the disparity amplitudes, different lines represent different disparity offsets (do ) and velocities. (b) The x-axis represents disparity velocities, different lines represent different disparity offsets (do ) and disparity amplitudes (da ).
8.3.2
In-depth motion and static conditions
The Bradley-Terry scores for in-depth motion stimuli are shown in Figure 8.6. According to the results, we may draw the following conclusions: – As shown in Figure 8.6(a), in general, disparity amplitude may not affect the visual discomfort significantly. For example, in the condition of do = 0.65 degree and slow velocity, the visual discomfort induced by the stimulus with disparity amplitude of 0.65 degree is not significantly different from the stimulus with disparity amplitude of 1.3 degree. However, for the fast motion conditions, disparity amplitude may influence visual discomfort. – Visual discomfort increases with the disparity offset as shown in Figure 8.6(a). This results is similar as the effect of relative disparity offset on planar motion stimuli, i.e., the relative disparity might be a main factor in this case. – As shown in Figure 8.6(b), visual discomfort increased with the in-depth motion velocity. The static condition can be considered as a special case of the in-depth motion as well. The BT scores of the static stimuli were compared with the in-depth motion stimuli which are shown in Figure 8.7. As shown in Figure 8.7(a), the gradient of the curve for in-depth motion is much flatter than for the static conditions. When the disparity offset is less than 0.65 degree, the in-depth motion will generate more visual discomfort than the static stimuli. For example, when compared with the static stimuli with the disparity of 0 degree, all the in-depth motion stimuli in our study generated more visual discomfort. However, when the relative disparity is larger than 2.05 degree (do =
8.3. RESULTS OF EXPERIMENT 1: INFLUENCE OF MOTION Static and in-depth motion stimuli
Static and in-depth motion stimuli
8
6 static slow,da=0.65 slow,da=2.6 slow,da=2 slow,da=1.3 medium,da=1.3 medium,da=2 medium,da=2.6 fast,da=0.65 fast,da=1.3
4
2
-1.3
-0.65 0 0.65 Disparity offset (degree)
(a)
1.3
Bradley-Terry scores
Bradley-Terry scores
8
0
133
6
4 do=-1.3 do=-0.65 do=0 do=0.65 do=1.3
2
0
0
1 2 Velocity (degree/s)
3
(b)
Figure 8.7: The Bradley-Terry scores of the static and the in-depth motion stimuli. (a) The x-axis represents the disparity offsets, different lines represent different disparity amplitudes (da ) and velocities. (b) The x-axis represents velocity. Different lines represent different disparity offset (ro ). Note that the BT score is the mean scores of the stimuli with same offset and velocity but different disparity amplitudes. 0.65 degree), we may extrapolate that the visual discomfort induced by the static stimuli would be higher than the in-depth motion stimuli. Considering the velocity, as shown in Figure 8.7(b), when the relative disparity is less than 2.05 degree (do = 0.65 degree), the visual discomfort increases with the velocity. However, if the relative disparity is larger than 2.05 degree, the static stimuli might generate more visual discomfort than the in-depth motion stimuli with slow velocity.
8.3.3
Discussion
In literature it is often mentioned that the motion in stereoscopic videos would induce more visual discomfort than static conditions. However, in this study, a counter-indication was found. All three motion types showed that the relative disparity between the foreground and the background is a main factor in visual discomfort, i.e., visual discomfort increases with the relative disparity. The gradient of visual discomfort with relative disparity is highest for the static stimuli, followed by in-depth and then planar motion stimuli. This implies that static stimuli induce more visual discomfort when the relative disparity exceeds a certain value. This value is approximately 1.4 degree for planar motion and 2.05 degree for in-depth motion. The gradient analysis also reveals that there is no “crossing point” between the planar motion and the in-depth motion in the positive three-quarters of the disparity
134CHAPTER 8. INFLUENCE OF MOTION ON VISUAL DISCOMFORT IN 3DTV Table 8.3: The linear regression analysis results for all stimuli Motion type Planar motion
Static stimuli
In-depth motion
factor ro vp ro×vp ro ro vd da×vd ro×da ×vd
Factor analysis Model analysis coefficient p-value(t-test) D = Intercept + ∑ coefficient × factor 1.45 0.0000 Intercept = -1.11 0.18 0.0000 R2=0.98, RMSE=0.17 -0.04 0.0000 F=221.474, p-value=4.10×10⁻¹⁰ Intercept = 0.54, 2.53 0.0000 R2=0.99, RMSE=0.15 F=1176.37, p-value=5.45×10⁻⁵ 1.23 0.0000 Intercept = 2.51 0.31 0.0000 R2=0.98, RMSE=0.11 0.45 0.0001 F=147.18, p-value=1.8×10⁻⁹ -0.21 0.0031
space, i.e., do from -0.65 to 1.3 degree. The in-depth motion stimuli are always more uncomfortable than the planar motion stimuli in this study. However, for the condition that the disparity offset is less than 0.65 degree, we may extrapolate that the slow in-depth motion stimuli might generate less visual discomfort than the fast planar motion stimuli. However, further studies are required.
8.4
Linear regression analysis: towards an objective visual discomfort model
To investigate the influence factors of each motion type, multiple linear regression analysis is used in this study which attempts to model the relationship between two or more explanatory variables and a response variable by fitting a linear equation to observed data. For the static situation, there is only one possible factor which is the relative angular disparity. For motion stimuli, the relative disparity offset, disparity amplitude, planar motion velocity, in-depth motion velocity, and their interactions are possible factors. The stepwise regression function in Matlab was used to select the most significant factors or remove the least significant factors [31]. The output of the stepwise regression includes the estimates of the coefficients for all potential factors, with confidence intervals, the statistics for each factor and for the entire model. To avoid over fitting of the model, the Leave-one-out Cross Validation (LOOCV) method was used to all possible models to find the model with the minimum averaged RMSE. The selected models are shown in Table 8.3. All the factors shown in Table 8.3 are statistical significant factors with p-value of the student’s-t-test < 0.05. The coefficient in the table is the coefficient of the corresponding factor in the linear model. The model analysis shows the linear model for each motion type. The R2 , RMSE, the F-statistic and its p-value are provided
8.4. LINEAR REGRESSION ANALYSIS
135
Subjective scores
8 6
4
2
0 0
2
4 6 Predicted scores
8
Figure 8.8: The scatter plot of the predicted scores and the BT scores. as the evaluation results of this model. D represents visual discomfort score. It is shown that for the planar motion stimuli, the relative disparity, planar motion velocity and their interaction term are important factors for visual discomfort. For the static stimuli, the relative disparity offset in this study shows its predominant effect. For the in-depth motion stimuli, the disparity amplitude is not a main factor which is consistent with the conclusions of Section 8.3.2 and [118]. However, the interaction term of the disparity amplitude and the velocity, and the combination of the three factors (velocity, disparity amplitude, relative disparity offset) plays an important role in determining visual discomfort. According to the regression analysis results, an objective model for comparing visual discomfort of still stereoscopic images, planar motion stimuli and in-depth motion stimuli is developed. All disparity and velocity values are measured in visual angular degree. Here we rewrite it as: 2.53ro + 0.54 static condition 1.45ro + 0.18v p − 0.04ro v p − 1.11 planar motion D= 0.31r + 1.23v + (0.45 − 0.21r )d v + 2.51 in-depth motion o d o a d
(8.3)
The scatter plot of the objective and subjective results is shown in Figure 8.8. The Pearson Linear Correlation Coefficient (PLCC), Spearman’s Rank Correlation Coefficient (ROCC) and Root Mean Square Error (RMSE) are used to evaluate the correlation between the objective scores and the subjective results, they are 0.9976, 0.9967, and 0.1198, respectively. 0
As this model is based 0on the paired comparison results, the D can be used to compare the degree of visual discomfort between the stimuli. The difference can be interpreted as the probability that one condition is preferred to another. This model works for the condition of a single moving object. However, for natural content conditions, how to combine the visual discomfort induced by sev-
136CHAPTER 8. INFLUENCE OF MOTION ON VISUAL DISCOMFORT IN 3DTV eral different moving objects and how to integrate the visual discomfort scores of different scenes will be presented in Chapter 10.
8.5
Results of Experiment 2: Influence of human factors on visual discomfort
8.5.1
Comparison between experts and naive viewers
The BT scores of the Experiment 2 from experts and non-experts data are shown in Figure 8.9. Both the experts and non-experts BT scores for the 15 planar motion stimuli provide the same conclusion as found in Section 8.3.1. The consistency of the experts and naive viewers’ test results are: CC = 0.9688, ROCC = 0.9357, RMSE = 0.2737. The Barnard’s exact test is applied on the raw pair comparison data of the experts and naive viewers results, and there are in total 21 pairs significantly different (p