Improved Visual Preference Authentication Markus Jakobsson
Hossein Siadati
Paypal
[email protected]
Extricatus LLC
[email protected]
Abstract—We describe an improved preference-based password reset scheme in which both security and usability of previous approaches are dramatically improved on. We report on experimental findings supporting these claims. Our experiment shows a false negative rate on the order of 0.9% and a false positive rate on the order of 0.5% for a choice of parameters that result in a registration time of 100 seconds and an authentication time of 40 seconds. The improvements are due to a tertiary classification during authentication, instead of a binary classification, which allows a reduction in the number it items to be classified. Preference-based authentication schemes offer higher retention rates and lower risks for data-mining based attacks than comparable knowledge-based authentication schemes.
I. I NTRODUCTION Passwords are an integral part of modern life, and so is the problem of people forgetting their passwords [1]. Security questions are widely used as a self-serve approach to resetting passwords, to avoid the substantial costs of involving a customer representative [26]. However, it is well understood that security questions are weak [10], [14], [15], [21], [25], [29]. At the same time as attackers often can guess or infer the answers to security questions, many users also fail to answer their own challenge questions. This is believed sometimes to be due to inconsistent spelling (”Garden Street” becomes ”Garden St.”); sometimes due to forgotten false answers (“What is your mother’s middle name?”, “Abraham Lincoln”); and yet other times simply due to forgotten true answers. The latter is made more common by an increased reliance on obscure questions [21]. To make it worse, the same questions are extensively used by different service providers, causing users to rely on the same answers to authenticate in many places. Like the use of the same password on many sites, this is a security liability. At the heart of the problem of backup authentication are two main issues at odds with each other. On one hand, the user has to be able to successfully authenticate – even if this is an infrequent action. This suggests the need to avoid authentication using obscure facts. On the other hand, impostors should not be successful. That suggests the need to avoid “obvious” facts – whether to a person with data mining skills or personal knowledge of the victim. It was long believed that letting the user write her own security questions would help address these problems, but that was shown to be absolutely wrong by Just et al. [16]: Users produce questions with low entropy answers, and that they are not as good as expected in remembering answers to questions they create for themselves.
Preference-based authentication [12], [13] strikes a reasonable balance between these two conflicting requirements, as preferences are more stable [7], [17] than long-term memory. In addition, a large class of preferences (namely those that are not very strong) are not commonly made public, improving the security against attacks based on data-mining. Existing preference-based authentication methods [12], [13], [19] suffer one practical problem, though: It takes too long for a user to register for the approaches to be commercially appealing. For example, to attain a false positive rate below 1% and a false negative rate of 2.5%, a user of the system described in [19] has to select 12 things he likes and 12 things he dislikes from a list of choices, and later select at least 10 of his likes from the 24 images. The registration is reported to take almost 170 seconds, and the authentication just below 60 seconds. In contrast, the scheme described in this paper has lower error rates with a registration process that takes only 100 seconds, and an authentication process taking 40 seconds. Apart from the dramatic improvement, this also offers hope that further improvements may be possible. The improvement of the time for registration and authentication is due to several novel techniques. First of all, the authentication process is a tertiary classification (likes; dislikes; and no-opinion) instead of a binary classification (likes and dislikes). Since this gives rise to a larger number of combinations, one can obtain the same level of security with a smaller number of selections. To compensate for the fact that users will make what we call “small mistakes” – the classification of a no-opinion image as a like or dislike, or vice versa – one can have a more generous threshold for this type of mistake than for what we call “big mistakes” – the classification of a like as a dislike or vice versa. Second, the user is only asked to identify his likes and dislikes during both the registration and authentication phases, and the no-opinion selections are heuristically inferred from that. Based on experiments which we describe herein, we observe that for a typical user, more than 80% of the available choices belong to the no-opinion category, which is what makes this approach a big efficiency improvement. We describe a simple but effective trick to make sure that the system does not incorrectly identify items as belonging to the noopinion category during the registration phase– as doing so could otherwise cause false negatives during the authentication phase. Using these techniques, the user only needs to identify three things she likes and three things she dislikes from a collection
of images displayed during the registration phase – and then, during the authentication phase, identify the same choices of three likes and three dislikes from a collection of 12 images1 . The remaining six images are those that the system deduced that the user had no strong opinion of. Outline We review related work (section II), describe the approach and its novel features (section III), and then detail the solution (section IV). After that, we describe our experimental setup (section VI), and analyze the associated results (section VII). II. R ELATED W ORK Human-to-computer authentication systems – biometric systems not counted – are typically vulnerable to automated credential guessing attacks and to attacks by people close to the victim. Example automated attacks on PINs were described by Bonneau et al [5], on passwords by Bonneau [3], and on common challenge questions by Rabkin [21]. Schechter et al. [25] demonstrated the ease with which people can guess the answers to challenge questions of their acquaintances, friends and family members. Password reset is the last resort for users to recover their forgotten credential, and so, a unique link to an account. It is well understood that when it comes to security, password reset is commonly the weakest link [4], [6], [21]: There is only a small number of so-called challenge questions that are meaningful, which means that many sites use the same questions – and accordingly, users rely on the same credential on many sites. Even so, half of the questions used by major service providers posed difficulties to users, 20% of whom forgot the answers within half a year. At the same time, half the questions had answers that could be guessed by an acquaintance 17% of the time, and all the questions failed in one manner for almost 13% of the users. Since using only one security question poses a risk – specially for traditional security questions – it has been suggested to use a combination of authentication methods to verify a user’s identity [23]. While Yan et al [28] conclude that memorability and security are not at odds with each other by necessity, it is clear that for many authentication instances, they are. It has been argued [12] that the principal weakness of security questions are that they rely on facts. These facts have to be remembered by users, and should not be easy for attackers to learn. Shifting from a fact-based approach to a preference-based approach improves the permanence of the challenge, since preferences are more stable than long-term memory. At the same time, avoiding topics that arouse very strong opinions (such as specific sports teams) makes it less likely that a user accidentally discloses the answers – whether to people in the surroundings or on social networks. This is done by asking users to classify concepts based on the user’s associated preferences – whether he likes or dislikes the concepts; the system determines whether a user is legitimate by comparing the answers to previously recorded preferences. 1 We describe a collection of alternative parameter choices as well, and compare these to each other.
Visual preference authentication uses the techniques set forth in previous work on preference-based authentication [12], [13], replacing textual descriptions of concepts with images. The change to a visual interface decreased the registration and authentication times, and improved the user experience. However, relying on a binary classification during the authentication session, all these approaches require a relatively large number of selections for reasons of security. The current work improves on this by going beyond binary classification – beyond classifying topics into likes and dislikes. It may at first seem that one can trivially derive even greater security from a system with even greater number of such classes – maybe things the user loves, likes, has no opinion about, dislikes and hates. However, early experiments [12] suggest that while a diametric change of preferences (e.g., likes becoming dislikes) is extremely rare, and a partial shift of preferences (e.g., no-opinion becoming likes) rather rare, it is very common that degrees of likes are mixed up, as well as degrees of dislikes. For example, a user may state that he likes pizza when registering, only to say that he loves it just a little closer to lunch time. We describe a practical way to obtain tertiary classification while reducing the user effort, using an automated infernal of items in the the newly added class. Orthogonal to the issues of false negatives and security against a typical online attacker, Hayashi et al. [11] studied how to harden an image-based authentication system against attack by a person close to the victim, such as a family member. They found that partial obfuscation of images helped with that. Similarly, labeling images in addition to image obfuscation is studied to resolve the same issue[9]. Other types of graphical authentication methods have also been proposed and studied [20], [8], [27]; those approaches are based not of preferences but on recall. Similarly, authentication methods based on recall of activities and events has been proposed [2]. Another approach is to employ social authentication, in which a user’s contacts help her gain access to her account [24]. Yet other approaches bootstrap authentication on access to a device used to store a secret [18], or relying on associative memory [22]. III. A PPROACH It is helpful to consider the proposed solution in the context of previous preference-based authentication methods [12], [13], [19]. The principles of these are illustrated in figure 1. We consider two phases: registration and authentication. In the registration phase, the user identifies some number of things she likes and some number of things she dislikes from a large pool of candidates. During the authentication phase, she is asked to identify the same choices of likes and dislikes which she setup in registration. The system determines whether it is the proper user based on the number of correct identifications the user made. Whereas this approach works well, it requires a fairly large number of selections to obtain a level of security that is commonly desired – between 8 and 16 selections of each type. This is a burden to the user.
registration
authentication like
like like
not selected
dislike
dislike
dislike
Fig. 1. Previous visual preference schemes are based on a registration phase in which a user selects some number of things she likes and some number of things she dislikes – maybe 12 of each – and an authentication phase in which the user identifies the items she likes and dislikes, provide the list of images she had previously classified, displayed in a random order.
Our contributions. At the core of the new solution are two novel components. One of these corresponds to the simple insight that tertiary classification results in a greater security than binary classification does; and that with the potential for greater security and fixed expectations, one can reduce the number of items that need to be classified. Here, the three classes are likes, dislikes, and “no-opinions”. Including this third category is known [12] to increase the risk for errors: While it is highly unlikely for a person to make a like ←→ dislike classification error, it is much more likely for him to make a like ←→ no-opinion or dislike ←→ noopinion misclassification. To address this practical problem, our solution specifies to the user how many items he needs to classify as likes vs. dislikes during the authentication session. This is highlighted in figure 2, and contrasted in figure 1 to the approach used previously. registration
authentication
like
like
not selected
like not no selected opinion
dislike
dislike
like
of items and label them no-opinion, in order to save the user from having to manually identify all of them during the registration process. Most of the system-identified items would, in fact, belong to the no-opinion class. However, some of them may not; worse still, the user may happen to have a strong opinion about one or more of them. This would thwart the authentication process. It is not meaningful to ask the user which ones she selected – that would shift the focus back from using preferences to using long-term memory, which would give rise to increased error rates. One possible approach is to allow for some error during the authentication phase – e.g., requiring a threshold of correct answers, but not requiring that all have to be correct. A second approach is to attempt to determine what images the user is likely not to have an opinion about. A second important component of the solution, therefore, is a technique that allows the system to infer what items belong to the no-opinion class, without explicitly asking the user. In previous incarnations of the system, it has been observed that it is distracting to display too many choices to the user at the same time; to address this, only about 12-15 selections were displayed at any time. The new system allows the user to refresh this collection if he cannot find any items he likes (or dislikes, depending on the task at hand). From this, it can be inferred what items the user does not actively like – at least with a pretty good probability, as confirm by our experiments. Similarly, if the user refreshes during the selection of dislikes, the system infers what the user does not appear to dislike. Images that are inferred to be neither liked nor disliked are placed in the no-opinion class. The experiments we report on next show that we attain an improvement of the user experience (in the form of swifter registration and authentication) at the same time as we see an increase of the security – simply from the subtle changes to the user interface that we have outlined above. IV. S OLUTION
dislike
Fig. 2. Our new visual preference scheme uses a registration phase in which a user selects a relatively small number of likes and dislikes – maybe 3 of each – and the system infers what selections the user has no strong opinion about. In the authentication phase, the items of these three categories – likes, dislikes, and no-opinion – are displayed in a random order, and the user is asked to identify which ones she likes and dislikes. The registration phase becomes faster as a result of the smaller number of selections, compared to previous preference-based schemes [12], [13], [19]. At the same time, the authentication phase provides higher security due to the use of tertiary classification instead of binary classification.
It is known [12] that almost all users only have an opinion about a very small portion of possible selections of the kind used in preference-based authentication schemes – and no opinion (or no strong opinion) about the rest. This means that it is reasonable for the system simply to identify a collection
Registration phase. The registration phase involves three components: (a) the user selects a small number of images that corresponds to things he likes. He then (b) selects a small number of things that he dislikes. Finally, (c), the system selects some number of images that the user is believed not to like. The user experience is shown in figure 3. The no-opinion images can be inferred from the user’s actions as shown in figure 4. If a user cannot find any images he likes, he can click on the button in the center of the interface (see figure 3); this refreshes the images. It also causes the system to infer that the user does not like any of the images in the previous collection – except for those that he explicitly stated that she liked. Once the user is done with selecting things she likes, she is brought back to the first collection of images that she saw during her selection of likes, and is asked to identify those that she dislikes. If the user requests more images at this point, the system infers that the user has no strong opinion of any images in this collection – not counting those for which a preference has been expressed.
needs to add additional items to the no-opinion class. This can be done by selecting additional images; especially those for which it is known that the correlation of preferences to the already selected likes and dislikes is particularly low. More precisely, each image which is not chosen during the setup phase falls into one of following no-opinion subclasses, based on the page that it is shown to user and the action that user has done in that page: •
•
Fig. 3. The figure shows a screen shot taken during the registration phase. The user has just selected three likes (left sidebar) and is about to select three dislikes (right sidebar.) Three items among the available selections are marked with a smiley, indicating that the user likes these concepts. One item is marked with a frown, which means that the user dislikes the item . If the user clicks the blinking button in the center (“Give me more choices”) to get more choices, the system notes that the user did not dislike any of the available choices. The system can infer that a user has no opinion about a collection of choices if he indicates in this way that he does not like any of the available images, nor that he dislikes any of them.
This is because the user has implicitly stated that she does not like any of the unselected images; and then that she does not dislike any of them. While this conclusion may be not be perfect – the user may have a slight preference for some, or even a strong preference for one that he did not notice – it raises the quality of the no-opinion selection without any user effort by making sure that it is very unlikely that are several strong preferences in the no-opinion selection. Combined with a the use of a threshold comparison during the authentication session, this results in a low risk for errors.
(a)
(b)
(c)
(d)
Fig. 4. The figure shows how the system infers no-opinion selections. In step (a), the user has selected one item she likes – marked in grey. She then clicks that she needs more images. The unselected images – shown in grey in step (b) – must therefore be either dislikes or no-opinion images. Later on, the user completes the selection of likes, and is taken back to the first collection of images to make a selection of dislikes. In step (c), she makes one such selection – the grey rectangle in the middle. The grey rectangle in the top corner corresponds to her previously selected like. As the user again requests more images, the system infers that the user has no strong opinion of the unselected images – marked in grey in step (d). These are therefore added to the no-opinion class, which is used in the authentication phase.
If a sufficient number of items can be identified as noopinion elements using the inference shown in figure 4, that concludes the registration process. Otherwise, the system
• •
(A) The image is within a page that visited during selection of likes and dislikes, but no image is chosen from. (B) The image is within a page that at least one image is chosen as like and one image chosen as dislike from. (C) The images is within a page that at least one image is chosen as either like or dislike from. (D) The image is within non visited pages.
Items in class A has highest score and class D has the lowest score to be considered as no-opinion. If a higher score class dos not has enough items, then the items from next class will be chosen. As we discuss in our finding from the experiment part, users visit an average of 3 image pages which gives enough items in A, B, and C classes to be considered as noopinion items. As a result, it is very unlikely that we choose an unvisited item (class D) as a no-opinion image. Likes, dislikes, and no-opinion items comprise the user’s credential. Authentication phase. The authentication process is straightforward: the user is shown a random ordering of the images in his like, dislike and no-opinion classes, and is asked to select some number of likes; then some number of dislikes – typically the same number as he select in the registration phase. A typical user experience is shown in figure 5. If the user choices during the authentication phase are (sufficiently) consistent with her setup selections, she is successfully authenticated. A limited number of small mistakes are allowed in the authentication phase. Different thresholds and their effect on usability and security are reported on in sectionVI. In order to reduce the number of small mistakes over time, we can adopt the user’s no-opinions as she authenticates herself to the system. Indeed, system correct its decision about no-opinions items of the user’s credential. If the user picks a no-opinion item as a like or dislike during an authentication and does not exceed the allowed small mistakes threshold, she is authentic. The adaptive system tags that item as like/dislike (based on user choice). This would expand our set of likes and dislikes over time with the user not needing to make any additional enrollment decisions. On subsequent authentications of the same user, we have more likes/dislikes and fewer noopinions in the challenge. This means the chance of making a small mistake is substantially reduced. An alternative decision is to replace the misclassified no-opinion items with a new no-opinion item, from the set of no-opinions inferred in the registration phase. In this way, we remove a misclassified noopinion from no-opinion class.
Fig. 5. The figure shows the user experience during the authentication phase. Note the strong resemblance to the registration phase. The user is asked to identify what images correspond to things he likes; then what images correspond to things he dislikes. The system makes an authentication decision based on how well this matches the selections in the registration. The system could, for example, require a perfect alignment, and request that the user tries again if he fails. It could also require that a sufficient number of matches are correctly made. For example, if all but one of the likes and dislikes is correct, then the system may accept the authentication attempts. It is also possible to output a score – based on the quality of the match – and let the authentication decision depend on this score and the task the user wishes to perform. We only consider threshold-based decision making herein.
Image collection. The collection of images from which the user chooses her preferences is carefully chosen [19] to avoid images with large classification bias or large correlation to other images, as well as images that are rarely classified. Different collections can be used for users from different countries or demographics. The image collection can be different between different services uses the solution, although this is not necessary as the selection exposed to a user in two different sessions would differ, thereby making overlapping credentials unlikely [19]. V. A DVERSARIAL M ODELS What does the adversary know? We consider two types of adversaries – what we may call a simple adversary and what we call an informed adversary. Both know how the protocol works, but neither knows any personal preferences of their victims. The simple adversary does not know anything about the probability distributions of the preferences while the informed adversary knows how the probability that each image (if it appears as one of the selections for the authentication phase of an unknown user) belongs to the categories like, dislike or no opinion. Similarly, we assume that the informed adversary knows of correlations between selections. If the selection likelihood of some images are is biased, then this gives an informed adversary an advantage in guessing the answer to a given authentication challenge. This is taken into consideration in the design we report on. To begin with, the images were selected to minimize bias. This was done by removing images for which subjects expressed a strong preference either way, and measuring the remaining bias. The
remaining bias is measured and taken into consideration in the analysis. Correlation, as mentioned, can arise from unbalanced probability distributions for the images displayed during the authentication. The first type of correlation is related to images in very close categories in which a user usually has the same opinion of both images, which we name related items. For example, the preferences associated with swimming and water polo are positively correlated. This kind of bias suggests that there is a benefit for attackers to choose both these images as either like or dislike. This kind of correlation could be easily resolved if we have a fine-grained categorization hierarchy and do not show images with more than a threshold amount of correlation during the setup phase. The second type of bias arises from images from multiple selections by a user within one category, even if these images are not normally correlated. For example, a selection including an image of drums, of a dance floor, and of Michael Jackson, a hot dog, a pizza, and a hamburger suggests a high likelihood that the selection was either made by a food-lover who does not enjoy contemporary music, or a music lover who does not like fast food. Of course, it is possible that a person likes some of the foods and some of the music items, but dislikes others – but it appears less likely from experimental observations. However, this problem can also be avoided in several ways. One possible approach is that if a user has chosen too many images within one category (whether as likes or dislikes), then after she is done with the selections, she is simply asked to select additional images – resulting in a larger number of selections than would otherwise be requested. The second batch of images shown to the user would not include images from the over-represented categories. A second approach is to reduce the number of images shown during setup to twice that of the number of categories, and only display two images of each category for the user to select from. If the user selects both images within one category, then later screens (should the user refresh the available images) would not offer her images from the category from which she has already made two selections. Instead, she would be shown more images from other categories. A version of this approach is to replace items of a chosen category by other images in real time. If the user selects a food item, then other food items on the screen are replaced by other images. Onwards, we will make the somewhat optimistic assumption that correlation of any meaningful amounts is avoided using a collection of approaches like those described above. Theoretically speaking, while this may not be a perfect assumption, we believe that it is a fair approximation for all practical purposes, given the typical approach of online attackers. VI. E XPERIMENT To assess the extent to which users manage to authenticate using the proposed system, we performed an experiment. Phase 1. We used the Amazon Mechanical Turk platform to recruit 400 users with hit approval rate of at least 90%. The users were asked to perform an image classification task taking
less than one minute, and offered a $0.21 payment for doing so. After having completed the registration process, each user was given a unique payment code, which they were asked to enter into the Mechanical Turk response window in order to get paid. Users were not told that they would be tested on whether they could pass a similar classification test later on, to avoid the risk that some users may write down what their selections were. Identifying cheaters. To filter out those participants who have not been careful enough doing the assigned tasks, we asked users to perform the same task as they would perform during authentication immediately after they registered. The results were only used to identify cheaters, and not to determine how well the subjects would be able to authenticate. Users who made one or more big mistakes or more than two small mistakes were considered cheaters, and not asked to participate in the second phase. This way, 120 cheaters were detected among the 400 participants, corresponding to a 70% “honesty rate”. Phase 2. Between 6-10 days after the registration took place – depending on when a particular user completed the registration phase – the users were contacted again, using the interface with which requesters can communicate with workers on Mechanical Turk. Each user was asked to participate in a follow-up study: “About a week ago, you selected images corresponding to things you like and dislike. We want to ask you to do that again, but this time we pay more. If you match your old selection, we will pay you $0.30, and otherwise $0.10. Will you make it?” Each user was also provided with a personalized hyperlink to follow. Phase 2 consisted of two parts: • Part a: The user completes the authentication process matching his prior selections from the registration phase. Subjects participating in the authentication phase were asked to identify three items they like and three that they dislike from the collection of previously chosen likes and dislikes, and the collection of no-opinion images that the system selected for the subject. • Part b: The user is told that his answer was not entirely correct (independently of whether it was or not), and is asked to authenticate again, given the same images as in the prior authentication process. The first part, obviously, was used to determine the extent to which users successfully authenticate; the second helps us determine how much the registration process was sped up by the user having performed it once before. It also lets us verify the extent to which the profiles match, for the same user and two independent registrations. This is important to know to determine the extent to which a leaked profile may give an attacker an advantage in gaining access to another account for the same user, should two websites use substantially similar image collections. Out of the 280 subjects invited to phase 2, 115 participated. We told people they were mistaken! In order to check whether people improve if they are given a second chance, and also to check how certain the users are in their selections,
we asked all users in the second phase to try again after they attempted to authenticate – no matter how well they did! We told each subject in phase 2: “You have made at least one mistake, please try again!” and observed how well they did. VII. A NALYSIS Parameter choices. In the registration phase, a random permutation was applied to the available images (a total of 320 images in the implementation we report on). These are grouped into collections of size 11, where the user is shows the first such set and asked to choose 3 likes first, followed by 3 dislikes. If a user presses the ”Give me more choices” button – or refresh button – then the next collection of 11 images is shown, but the display is “rewinded” to the first collection (if applicable) when the user is about to select dislikes. After the user has selected all the likes and dislikes, the system selects the so-called no-opinion images using the logic described in section IV. In the parametrization we report on, a total of 6 no-opinion images were selected. In the authentication phase, users were shown a collection of images, out of which three were the previously selected likes; three were the previously selected dislikes; and the rest the no-opinion images. The error rates depend on the number of images shown of each type and the threshold of the maximum allowable number of so-called “small mistakes”. A small mistake corresponds to a user identification of an item as like or dislike where the item was classified as no-opinion by the system; or a user identification of an item as no-opinion for an item that the system understands to be either a like or dislike item. In contrast, a big mistake is one where a user classifies an item as like when the system has recorded it as a dislike – or vice versa. We report statistics for five parameter choices. Using (L, D, N) to mean the number L of likes, the number D of dislikes, and N to mean the number of no-opinion images, we describe the results of using (L, D, N) = (3, 3, 6), (3, 3, 10), (4, 4, 4), (4, 4, 8), and (5, 5, 10) using thresholds T = 2, T = 3, and T = 4 for small mistakes. A. False negatives. A legitimate user fails the authentication step if she makes what we refer to as big mistakes or if she makes small mistakes beyond a specified threshold. The false negative rates depend on the parameters (L, D, N), as well as the threshold T . Figure 6 shows the percentage of users without any big mistakes, but with 0, 1, 2, or 3+ small mistakes. It shows that 96% of users will be successfully authenticated if the system accepts up to 2 small mistakes (but no big mistakes) for (L, D, N) = (3, 3, 6). A higher threshold reduces the false negative rates, allowing a greater number of legitimate users to pass the authentication. For example, for the same choice of (L, D, N), 100% of users will be correctly authenticated if the system allows up to 3 small mistakes. Increasing the threshold, of course, will come at the cost of increased false positives. We observed that an average of 2.6 likes (i.e., 86%) are correctly identified during the authentication phase, whereas
B. False positives.
Fig. 6. The figure shows the number of small mistakes made in the authentication phase for the parameter choice (L, D, N) = (3, 3, 6). A small mistake is when a no-opinion image is chosen as a like or dislike, or vice versa.
2.4 dislikes (or 80%) are correctly identified. Using Wilcoxon Signed-rank test shows that there is a significant difference between the number of identified likes and the number of identified dislikes (W = 465.5, Z = −2.48, P < 0.01, r = 0.23). It can therefore be concluded that users will be slightly more accurate when identifying their likes than when identifying their dislikes. This was not taken into consideration in the scoring of results herein, but more advanced versions could take advantage of this. Based on the rate of successful identification of likes and dislikes during the authentication phase, one can extrapolate the users’ performance for other parameter choices. For example, let’s consider 5 likes and 5 dislikes, and the system adds 10 no-opinions. When the user authenticates, she is allowed up to T = 4 small mistakes, but no big mistakes. There, the expected success rate of authentication is 99.1%. The effect of trying again: The experiment showed that only a small number of subjects – 14 out of 115 – did better in their second try, after being told that they made a mistake. However, out of these 14 subjects, the second try only helped two subjects to change their state from ”non-authenticated” to ”authenticated”. Put another way, the second try helped just 2 out of 115 to improve their authentication result. Of course, this is simply an estimate of the approximate rate, and a much greater sample size is needed to determine this with good precision. Looking at the performance during the first and second try, however, helps us understand how certain users are. Among the 115 test takers, 73 users (63%) did not change their like selections in the second try. In contrast, 65 out of 115 users (55%) did not change their dislike selection. Finally, 35 users (30%) did not change either their likes or dislikes – in spite of being told that they made mistakes. (It is worth noting that the subjects were not allowed to see their selections from the first try during the second try, and so, they may not recall exactly what their previous selection was, and simply make the selection that felt most right.)
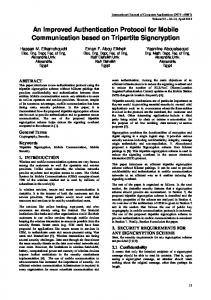
An adversary can take over an account via the password recovery mechanism if she can produce the right answers to the questions. One can consider three types of adversaries, corresponding to attacks one may call simple attacks, statistically aware attacks and context aware attacks. In the first type of attack, the adversary guesses answers at random. In the second attack, the adversary is assumed to be aware of the distribution of answers for a large group of users, and selects the most likely answers based on this knowledge. If the image collections are well chosen, the advantage of having knowledge of the selection distributions is limited. In the third attack, the adversary knows something about a particular victim, and uses this to select answers. The success of simple attacks depends on the number of noopinion images that are shown in the authentication phase, and the threshold used to determine how accurate the response has to be to be acceptable. For example, using three likes, three dislikes and six no-opinion images – what we will refer to as (L, D, N) = (3, 3, 6) – and an acceptance of up to 2 small mistakes, a attack by a simple attacker will have a success rate of 2.1%. For (L, D, N)T = (5, 5, 10)4 ,the corresponding rate is 0.5%. Statistical analysis attacks could take advantage of a known bias for the classification of individual images and a correlation between the classification of images. This can be modeled by assigning each image a skewed selection probability. We will refer to these as weights. More specifically, the weight associated with an image in the authentication phase is the probability that this image would be classified in a given manner by an average user. Given some ordering of the images, image i will have weights (wiL , wiD , wiN ). Here, the sum of these weights equals 1, and the weights describe the probabilities that the images was classified as like, dislike and no-opinion. In an attack by a simple adversary, we have assumed that this vector of weights is the same for all images. Note that it does not matter what it is, as long as it is the same for all images being displayed during one authentication session. However, when different images have different weight vectors, this may translate into an advantage to an informed attacker. For the sake of simplicity, let us assume that all images have the weight of 0.33 as their no-opinion weight, but varying weights for like and dislike. Figure 7 shows the result of a simulation of a statistical analysis attack in which an informed attacker first chooses the 5 images with the maximum likeweights as his like selection, and then chooses the 5 images with maximum dislike-weights as his dislike selection. The figure shows the success rates based on the number of images with biased weights, and for different amounts of bias, for (L, D, N)T = (5, 5, 10)4 . The figure shows that when the difference between “like” weights and “dislike” weights of images increase, the attackers will be more successful in general. This conclusion comes from the fact that curve related to weight difference of 0.1 (between like weigh and dislike weight), is
Fig. 7. This figure shows the effect of weight bias on the adversary’s success probability for (L, D, N)T = (5, 5, 10)4 . The x-axis shows the number of images with biased weights for like selection and dislike selection, and the y-axis shows the adversary’s success rate. Each curve shows the adversary’s success based on a specified bias offset. For example, the curve labeled 0.2 shows the adversary’s success probability when the weights of biased images are (0.43, 0.23, 0.33), i.e., there is a difference of 0.2 between the like and dislike probabilities.
lower than the other curves, and the cure belonging to weight differences of 0.5 is higher than the others (the same logic works for other curves). However, one interesting point is that is the number of images with bias for the weights that has the most critical impact on the security of the system. As it is obvious from figure 7, there is no significant difference between the security of system when there is one image with biased weight, and when all images are biased. The reason is that the adversary’s choices are not simplified by bias, but by difference in bias. Consequently, in practice, it is not important for the system to have all images weighted (wiL , wiD , wiN ) = (0.33, 0.33, 0.33), but that is important to keep the same approximate (wiL , wiD , wiN ) for all images. It is clear that if an adversary knows much about her victim, then her probability of successful attack increases. However, this is not a problem unique to preference questions. In fact, it is known to be a problem for existing security questions [25], where it was observed that more than 25% of attackers with personal knowledge of the victim can guess the answer to at least one of three traditional security questions associated with their victim [22]. How error rates are affected by the parameter choice. One can decrease the probability of a successful attack simply by adding some more no-opinion images to the authentication phase, or by increasing the number of likes and dislikes – or by reducing the threshold to pass. The benefit of using the number of no-opinion images is that this does not affect the time to register – although a drastic increase makes an increase of the threshold necessary to maintain a good balance between false positives and false negatives. Using N = 8 instead of N = 6 for L = D = 3 and T = 2 causes the success rate of an attack by a simple attacker to fall to 1%. Increasing N to 10 makes the success rate drop to around 0.7%. In a setting of (L, D, N)3 = (4, 4, 8)3 , the
Fig. 8. This figure shows the false positive and false negative rates of our scheme in different settings of (L, D, N)T and the maximum number of allowed 2 small mistakes. For example, for the parameter choices (L, D, N)T = (5, 5, 10)4 , the false positive rate is 0.5% and the false negative rate is around 0.9%. The false negatives for other settings are extrapolated from the experiment we described. This assumes consistency with the previously described rates of correct responses for likes and dislikes (86.6% and 80%). The false negatives are calculated by simulating an attack by a simple attacker attack on the proposed system in different setting.
success rate of the adversary would be 1.1%, when up to 3 small mistakes are allowed. Figure 8 shows the false positive and false negative rates for a collection of parameter choices. An ideal setting in practice is one which keeps both false negative and false positives below 1%. This is satisfied by (L, D, N)T = (5, 5, 10)4 , which results in a false negative rate of 0.9% and a false positive of 0.5%. VIII. C ONCLUSION We have described a collection of novel techniques that, when applied, improve both the security and the usability of a visual preference based authentication scheme. Experimental results support that the performance falls within the range of what is considered desirable. While the authentication scheme is not as secure as passwords, for example, this is expected to be addressed by combining the approach with additional methods – such as cookies, IP address, keyboard biometrics, and more. R EFERENCES [1] M. B. B. Ensor and E. Giovannini. How Consumers Remember Passwords. www.forrester.com/rb/Research/how-consumers-rememberpasswords/q/id/34566/t/2, last retrieved in June 2004. [2] A. Babic, H. Xiong, D. Yao, and L. Iftode. Building robust authentication systems with activity-based personal questions. In Proceedings of the 2nd ACM workshop on Assurable and usable security configuration, SafeConfig ’09, page 1924, New York, NY, USA, 2009. ACM. [3] J. Bonneau. IEEE symp. security and privacy. In The science of guessing: analyzing an anonymized corpus of 70 million passwords, May 2012. [4] J. Bonneau, M. Just, and G. Matthews. Whats in a name? In R. Sion, editor, Financial Cryptography and Data Security, volume 6052 of Lecture Notes in Computer Science, pages 98–113. Springer Berlin / Heidelberg, 2010. [5] J. Bonneau, S. Preibusch, and R. Anderson. A birthday present every eleven wallets? the security of customer-chosen banking pins. In FC ’12, The 16th International Conferenceon Financial Cryptography and Data Security, 2012. [6] G. Chothia, Tom Singh and B. Smyth. Using facebook to reset bank passwords. www.cocolab.org/soups/papers/Chothia.pdf, 2010.
[7] D. W. Crawford, G. Godbey, and A. C. Crouter. The stability of leisure preferences. Journal of Leisure Research, 18(2):96–115, 1986. [8] D. Davis, F. Monrose, and M. K. Reiter. On user choice in graphical password schemes. In In 13th USENIX Security Symposium, pages 151– 164, 2004. [9] T. Denning, K. Bowers, M. van Dijk, and A. Juels. Exploring implicit memory for painless password recovery. In Proceedings of the 2011 annual conference on Human factors in computing systems, CHI ’11, page 26152618, New York, NY, USA, 2011. ACM. [10] V. Griffith and M. Jakobsson. Messin’ with Texas, Deriving Mother’s Maiden Names Using Public Records. In RSA CryptoBytes, volume 8(1), pages 18–28, 2007. [11] E. Hayashi, R. Dhamija, N. Christin, and A. Perrig. Use your illusion: secure authentication usable anywhere. In Proceedings of the 4th symposium on Usable privacy and security, SOUPS ’08, page 3545, New York, NY, USA, 2008. ACM. [12] M. Jakobsson, E. Stolterman, S. Wetzel, and L. Yang. Love and authentication. In CHI ’08: Proceeding of the twenty-sixth annual SIGCHI conference on Human factors in computing systems, pages 197– 200, New York, NY, USA, 2008. ACM. [13] M. Jakobsson, L. Yang, and S. Wetzel. Quantifying the security of preference-based authentication. In DIM ’08: Proceedings of the 4th ACM workshop on Digital identity management, pages 61–70, New York, NY, USA, 2008. ACM. [14] A. Juels. Pets, Weddings, and Identity Theft. www.rsa.com/blog/blogentry.aspx?id=1152, December 13, 2006. [15] M. Just. On the design of challenge question systems. IEEE Security and Privacy, 2(5):32–39, 2004. [16] M. Just and D. Aspinall. Personal choice and challenge questions: a security and usability assessment. In Proceedings of the 5th Symposium on Usable Privacy and Security, SOUPS ’09, pages 801–811, New York, NY, USA, 2009. ACM. [17] G. F. Kuder. The stability of preference items. The Journal of Social Psychology, 10(1):41–50, Feb. 1939. [18] M. Mannan, D. Barrera, C. D. Brown, D. Lie, and P. C. van Oorschot. Mercury: Recovering forgotten passwords using personal devices. In Financial Cryptography, pages 315–330, 2011. [19] Y. Niu. Visual preference authentication. In: Markus Jakobsson, Death of the Internet. Wiley-IEEE Computer Society, June 2012, pp. 359–369. [20] A. PAIVIO, T. B. ROGERS, and P. C. SMYTHE. Why are pictures easier to recall than words? Psychonomic Science, 11(4):137–138, 1968. [21] A. Rabkin. Personal knowledge questions for fallback authentication: security questions in the era of facebook. In Proceedings of the 4th symposium on Usable privacy and security, SOUPS ’08, pages 13–23, New York, NY, USA, 2008. ACM. [22] K. Renaud and M. Just. Pictures or questions?: examining user responses to association-based authentication. In Proceedings of the 24th BCS Interaction Specialist Group Conference, BCS ’10, pages 98– 107, Swinton, UK, UK, 2010. British Computer Society. [23] S. Schechter and R. W. Reeder. 1 + 1 = you: measuring the comprehensibility of metaphors for configuring backup authentication. In Proceedings of the 5th Symposium on Usable Privacy and Security, SOUPS ’09, page 9:19:31, New York, NY, USA, 2009. ACM. [24] S. Schechter, S Egelman and R. Reeder. It’s not what you know, but who you know: A social approach to last-resort authentication. In Proceedings of the SIGCHI conference on Human Factors in Computing Systems., CHI ’09, pages 375–390, Boston, MA, USA, 2009. [25] S. E. Schechter, A. J. B. Brush, and S. Egelman. It’s no secret. measuring the security and reliability of authentication via ”secret” questions. In IEEE Symposium on Security and Privacy, pages 375–390. IEEE Computer Society, 2009. [26] Voiceport. Password Reset. www.voiceport.net/PasswordReset.aspx, last retrieved in June 2008. [27] D. Weinshall. Cognitive authentication schemes safe against spyware. In Security and Privacy, 2006 IEEE Symposium on, pages 6 pp. –300, May 2006. [28] J. Yan, A. Blackwell, R. Anderson, and A. Grant. Password memorability and security: empirical results. IEEE Security & Privacy Magazine, 2(5):25–31, Sept. 2004. [29] M. Zviran and W. J. Haga. User authentication by cognitive passwords: an empirical assessment. In JCIT: Proceedings of the fifth Jerusalem conference on Information technology, pages 137–144, Los Alamitos, CA, USA, 1990. IEEE Computer Society Press.