LATEST TRENDS on COMMUNICATIONS
Methods of digital modulation recognition and their testing A. Kubankova and D. Kubanek
Recently, new methods of modulation classification and symbol length estimation were proposed. Modulation classification methods are based on spectrogram analysis [3] and instantaneous values of signals [4]. Methods for symbol length estimation are based on the wavelet transform [5] and cepstrum analysis [6]. In this paper, all the above recognition and detection algorithms are described shortly and a method for their examination using real signals is designed. Also, the necessary equipment for measurement is described.
Abstract—The paper describes algorithms for the classification of digital modulations and estimation of symbol length. ASK, FSK2, FSK4, MSK, BPSK, QPSK, 8PSK and QAM-16 were chosen for recognition as the best-known digital modulations used in modern communication technologies. The first algorithm is based on module and phase spectrogram analysis, the second algorithm uses instantaneous values of signal (instantaneous amplitude, phase and frequency). For symbol length estimation, three methods were proposed, which are based on the wavelet transform and cepstrum analysis. A method for the examination of recognition and detection algorithms was designed and described.
II. MODULATION RECOGNITION METHOD BASED ON SPECTROGRAM ANALYSIS
Keywords — Classification of modulations, examination, modulation, symbol length estimation.
This method is based on module and phase spectrogram analysis. The module and phase spectrograms were calculated with the segment size equal to the symbol length. For the estimation of spectrogram features, it is advantageous to use their histograms. The spectrogram can be presented as a matrix of numbers A(i, j) , where i in the range [0, M-1] and j in the range [0, N-1] are indexes of rows or columns of the matrix. For the analysis of module spectrograms it is suitable to count the occurrences of column maxima, in particular rows. The FSK2 and FSK4 modulation types are the easiest for recognition, because two or four distant carrier frequencies occur in the module spectrogram. Therefore the method of finding the column maximum occurrence in separate rows easily detects two or four characteristic maxima for these modulations. Similar to FSK modulation, two carrier frequencies can be found in the module spectrogram of the MSK modulation. It is possible to detect two maxima in the spectrogram by observing the occurrence of column maximum amplitudes on separate frequencies. However, it is not easy to recognize them, because the distance between them is just half of the bit rate R/2. Moreover, in a signal with noise, the other maxima often occur and cause a wrong detection of MSK modulation. The analysis of module spectrograms described above can distinguish three different modulations with varying carrier frequency. For the remaining modulation types (ASK, BPSK, QPSK, 8PSK and QAM-16) it is necessary to analyze the phase spectrograms. The graphs of maximum occurrence counts used for module spectrogram analysis do not provide any usable properties. From a detailed view of phase spectrograms it is apparent that several different values of brightness (phases) occur in the
I. INTRODUCTION N connection with the requirement for faster and more reliable communication, digital processing methods and digital communications are mainly used. Together with the rapid growth in the last decade of cellular technologies, PCS (Personal Communication Services) and WLAN (Wireless Local Area Network) services, a number of different wireless communication standards were proposed and employed, each of them having its own unique modulation type, access technique, etc. To realize seamless inter-communication between these different systems, a multiband, multimode smart radio system such as software radio, is becoming the focus of commercial and research interests. The automatic modulation classification technique, which is indispensable for the automatic choice of the appropriate demodulator, plays an important role in such a multimode communication system [1]. Automatic identification of the type of digital modulation has found application in many areas, including electronic warfare, surveillance, and threat analysis [2]. ASK (Amplitude Shift Keying), MPSK (M-ary Phase Shift Keying), MFSK (M-ary Frequency Shift Keying), QAM (Quadrature Amplitude Modulation) and MSK (Minimum Shift Keying) were chosen for the analysis because they belong to the best-known digital modulations. These modulation types are used in modern radio telecommunication systems (GSM, WiFi, WiMAX, etc.).
I
Manuscript received June 25, 2010. A. Kubankova and D. Kubanek are with the Department of Telecommunications, Faculty of Electrical Engineering and Communication, Brno University of Technology, Czech Republic (e-mail:
[email protected],
[email protected]).
ISSN: 1792-4243
234
ISBN: 978-960-474-200-4
LATEST TRENDS on COMMUNICATIONS
frequency.
area around the carrier frequency. The number of these values corresponds to the number of phase positions used in the modulation. Thus the analysis must evaluate how many phase values occur on the carrier frequency. If the carrier frequency is not known, it can be easily found from the module spectrogram. One, two, four, eight and twelve phase values occur on the carrier frequency which correspond with the theoretical expectation for the ASK, BPSK, QPSK, 8PSK and QAM-16 modulations. The analysis results strongly depend on the segment size used for spectrum calculation. The characteristic properties of modulation types are apparent only in spectrograms that are obtained with the segment size equal to the symbol length. Therefore it is necessary to find the signal element length prior to obtaining the spectrograms. For this purpose, methods based on wavelet transform and cepstrum analysis were suggested.
B. Method of symbol length detection based on cepstrum analysis The zero points in the power spectrum of digitally modulated signals are periodic and the real cepstrum can be used for the detection of signal element length. The real periodic cepstrum may be determined from the power spectrum S ( f ) :
[
Ns 1 ⋅ , T peaks f s
T = nC1 peak ⋅ Ts ,
(3)
where nC1 peak is the position of the first peak in the cepstrum and Ts is the sampling rate. However it is a problem to find the correct position of the first peak in the cepstrum automatically. Therefore the cepstra of the modulated signals were transformed by means of the Hilbert transform. The signals obtained have distinct periodic peaks and their spacing is the same as the value of nC1 peak . This spacing can be detected if we compute the spectrum of this signal. In this spectrum, the reciprocal value of the position of the first peak is proportional to the signal element length: T =
Ns 1 , ⋅ n S1 peak f s
(4)
where nS1peak is the position of the first peak in the spectrum, Ns is the total number of samples in the spectrum, and fs is the sampling frequency. III. MODULATION RECOGNITION METHOD BASED ON ANALYSIS OF INSTANTANEOUS VALUES OF SIGNAL The received real signal x(t) can be represented as the analytic signal z(t), which can be expressed as z (t ) = x(t ) + jy (t ) ,
(5)
where y(t) is the Hilbert transform of x(t), and j is the imaginary unit. The instantaneous amplitude a(t) is defined as
(1)
a (t ) = z (t ) =
. where Tpeaks is the period of spectrum components, Ns is the total number of samples in the spectrum, and fs is the sampling ISSN: 1792-4243
(2)
The periodic component in the spectrum causes a peak in the cepstrum. The position of the first peak in the cepstrum matches the signal element length:
A. Method of Symbol length detection based on wavelet transform Signals with any of the above modulation types were transformed by the wavelet transform. For phase modulation types, as the frequency is constant, the wavelet coefficients resemble a series of spikes and the interval between neighboring peaks is the symbol period. The wavelet transform can enhance the high-frequency components which appear when the signal phase or amplitude is changed. A step change in the phase or amplitude will show up in several coefficient levels. In the wavelet coefficients of the FSK signal there is also a visible difference between states of signal with a suitably selected level of decomposition. Thus, the received signal is transformed by the level 2 wavelet transform and by the order 2 Daubechies function. Because the wavelet coefficients of the FSK signals have a different character than the wavelet coefficients of phase modulations, the Hilbert transform is executed after the wavelet transform. Via the Hilbert transform, a two- or fourstep envelope of wavelet coefficients is created for the FSK signals and the coefficients occurring when the phases of other signals change are emphasized. Then, the functions obtained are differentiated. Thus, similar to phase modulated signals, the peak series is obtained from the two- or four-step envelope of FSK signal. The distance between the peaks matches one or several symbol lengths. It appears from this that the peaks are periodical, therefore the Fourier transform can be used. Several maxima are found in the spectrum, the distance between them is obtained and the symbol length is calculated in agreement with:
T=
]
c(n ) = Re{IFFT log S ( f ) }.
x 2 (t ) + y 2 (t ) .
(6)
The instantaneous phase φ(t) is given by
235
ISBN: 978-960-474-200-4
LATEST TRENDS on COMMUNICATIONS
ϕ (t ) = arg{z (t )} .
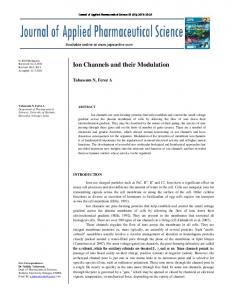
have amplitude changes and their γmax is larger than tr(γmax). This threshold value has to be determined appropriately in order to discriminate between the two modulation groups. From Fig. 1 it is apparent that curves corresponding to FSK2, FSK4 and MSK signals fall below the chosen threshold level tr(γmax) = 4. The spectrum analysis was then used to discriminate between the FSK2, FSK4 and MSK modulations and instantaneous phase analysis to discriminate between the ASK, BPSK, QPSK, 8PSK and QAM-16 modulations. The power spectrum of MSK signal has only one carrier frequency, the spectrum of FSK2 signal has two maxima, which correspond to two carrier frequencies, and the spectrum of FSK4 signal has four maxima which correspond to four carrier frequencies. The centered non-linear component of the instantaneous phase ϕNL was analyzed to enable the discrimination of ASK, MPSK and QAM-16 modulations.
(7)
Finally, the instantaneous frequency f(t) is given by
f (t ) =
1 dϕ (t ) . 2π dt
(8)
The maximum value of the spectral power density of the normalized-centered instantaneous amplitude γmax of the received signal is used to discriminate between frequency modulations (FSK2, FSK4 and MSK) and amplitude and phase modulations (ASK, MPSK and QAM-16). [7]
γ max = max DFT(acn (i )) / N s , 2
(9)
where Ns is the number of samples per signal and acn(i) is the value of the normalized-centered instantaneous amplitude at i time instants t = , (i = 1, 2, …, Ns), and it is defined by fs acn (i ) = an (i ) − 1 , where an (i ) =
a(i ) , ma
ϕ NL (i ) = ϕ uw (i ) −
∑
2πf c i is the fs
linear component of the instantaneous phase. The BPSK signal has two phase values, QPSK has four phase values, 8PSK has eight phase values and QAM-16 has twelve phase values. The ASK signal has only one phase value. For the analysis of instantaneous phases, their histograms were calculated. One, two, four, eight and twelve maxima occur in phase histograms, which correspond to the number of phase values in the signals.
N
1 s a(i ) . N s i =1
(12)
where ϕuw(i) is the unwrapped phase sequence,
(10)
where ma is the average value of the instantaneous amplitude ma =
2πf ci , fs
(11)
Normalizing of the instantaneous amplitude is necessary in order to compensate the channel gain. The dependence of γmax on SNR for each modulated signals is shown in fig. 1.
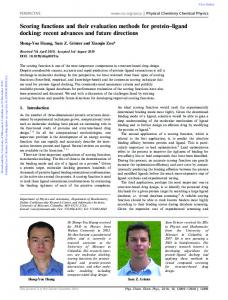
IV. EXAMINATION OF RECOGNITION AND DETECTION ALGORITHMS In this chapter, a method will be described that we plan to use for the examination of algorithms described above with real signals. The measuring system will consist of a modulated signal generator, receiver, digitizer and computer (fig. 2.).
Generator
Receiver
Digitizer
Fig. 2. System for practical verification of recognition method
The generator provides ASK, MPSK, MFSK, QAM, and MSK signals. A generator type with the possibility of adding noise and simulating multipath signal propagation is preferred. In this case it is possible to connect the generator and the receiver directly by a cable. Otherwise it is advisable to use antennas and let the signal propagate in a real environment. The carrier frequency of modulated signal is hundreds of MHz or units of GHz as is usual in common communication systems with digital modulations. It is not easy to digitize signals at such high frequencies and thus the generated signal
Fig. 1. Dependence of γmax on SNR
The FSK2, FSK4 and MSK modulations have no amplitude changes and their γmax is less than a threshold value tr(γmax). The band-limited MPSK, ASK and QAM-16 modulations ISSN: 1792-4243
236
ISBN: 978-960-474-200-4
LATEST TRENDS on COMMUNICATIONS [3]
is downconverted in the receiver. The receiver output signal at an intermediate frequency (IF) of 10.7 MHz is then digitized. For this purpose we use a storage oscilloscope, but a digitizer with suitable sample rate (it will be analyzed in the next paragraph) can also be used. After digitization, the signal is transferred into the computer where recognition is performed. While designing the practical testing system it was necessary to determine the minimum sampling frequency for signal digitization. The carrier frequency of the signal before digitization is 10.7 MHz, which corresponds to the receiver IF. Analyses showed that the carrier frequency must be at least four times higher than the symbol rate. It means that the maximum symbol rate can be 10.7 MHz / 4 = 2.675 MHz. We have also found out that minimum number of samples in one symbol is Ns,min = 200. It appears from this that the minimum sampling frequency at a maximum symbol rate of 2.675 MHz is 2.675 MHz * 200 = 535 MHz. Another condition for a correct modulation recognition is a sufficient frequency bandwidth of the output IF filter in the receiver. It was found that the pass band must be at least 6times wider than the symbol rate. For the above-mentioned symbol rate 2.675 MHz the bandwidth would be 2,675 MHz * 6 = 16.05 MHz, which is unfortunately unavailable in usual receivers. They mostly offer a maximum bandwidth of 500 kHz and thus it is possible to process signals with symbol rates of up to 500 kHz / 6 = 83.3 kHz in this case. But for the first rough verification of the recognition method it is sufficient. The necessary sampling frequency is 500 kHz / 6 * 200 = 16.7 MHz. The following instruments will be used in the testing: signal generator Rohde&Schwarz SMIQ02B, receiver AOR SR2200, oscilloscope Agilent DSO6102A.
[4]
[5]
[6]
[7]
A. Kubankova, D. Kubanek, “Automatic Digital Modulation Recognition Algorithm Based on Spectrogram Analysis”, TSP 2008 Telecommunication and signal processing 2008 31th International Conference, 2008, s. 1-4. A. Kubankova, D. Kubanek, “Extended method of digital modulation recognition”, TSP 2010 - Telecommunication and signal processing 2010, 33th International Conference, 2010. A. Kubankova, “Detection of Signal Element Length for Digital Modulation Classification”, RTT 2008 - Research in Telecommunication Technology 2008 9th International Conference. Vyhne, Slovak Republic, 2008, s. 1-3. A. Kubankova, “Analysis of Symbol Rate Detection method based on Cepstrum Analysis”, TSP' 2009 - 32nd International Conference on Telecommunications and Signal Processing. Hungary: Asszisztencia Szervezo Kft., 2009, s. 5-8. E. E. Azzouz, A. K. Nandi, “Automatic Modulation Recognition of Communication Signals,” Kluwer Academic Publishers, Netherlands, 1996.
V. CONCLUSION In this paper several algorithms for digital modulation recognition and detection of symbol rate were described. The algorithms designed have good results when simulated on computer. However, in the future work it is necessary to verify how these algorithms will work in practice. Currently we assemble a measuring system which will test the designed algorithms with real signals. ACKNOWLEDGMENT This work was supported by the Ministry of Education of the Czech Republic research project No. MSM0021630513 and by the Czech Science Foundation project No. GP102/09/P626. REFERENCES [1]
[2]
W. Dai, Y. Wang, J. Wang, “Joint power estimation and modulation classification using second- and higher statistics,” WCNC 2002 - IEEE Wireless Communications and Networking Conference, no. 1, 2002, pp. 767 – 770. L. Hong, K. C. Ho, “Identification of digital modulation types using the wavelet transform”, MILCOM 1999 - IEEE Military Communications Conference, no. 1, 1999, 427 – 431.
ISSN: 1792-4243
237
ISBN: 978-960-474-200-4