Metrics and Techniques for Quantifying Performance Isolation in Cloud Environments Rouven Krebs
Christof Momm
Samuel Kounev
SAP AG 69190 Walldorf, Germany
SAP AG 69190 Walldorf, Germany
[email protected]
[email protected]
Karlsruhe Institute of Technology 76131 Karlsruhe, Germany
[email protected]
ABSTRACT
Keywords
The cloud computing paradigm enables the provision of costefficient IT-services by leveraging economies of scale and sharing data center resources efficiently among multiple independent applications and customers. However, the sharing of resources leads to possible interference between users and performance problems are one of the major obstacles for potential cloud customers. Consequently, it is one of the primary goals of cloud service providers to have different customers and their hosted applications isolated as much as possible in terms of the performance they observe. To make different offerings, comparable with regards to their performance isolation capabilities, a representative metric is needed to quantify the level of performance isolation in cloud environments. Such a metric should allow to measure externally by running benchmarks from the outside treating the cloud as a black box. In this paper, we propose three different types of novel metrics for quantifying the performance isolation of cloud-based systems and a simulation-based case study applying these metrics in the context of a Softwareas-a-Service (SaaS) scenario where different customers (tenants) share one single application instance. We consider four different approaches to achieve performance isolation and evaluate them based on the proposed metrics. The results demonstrate the effectiveness and practical usability of the proposed metrics in quantifying the performance isolation of cloud environments.
Performance, Isolation, Metric, SaaS, Cloud, Multi-tenancy
Categories and Subject Descriptors C.4 [Performance of Systems]: [Measurement techniques, Design studies]; D.2.8 [Software Engineering]: Metrics— performance measures
General Terms Performance, Measurement
Permission to make digital or hard copies of all or part of this work for personal or classroom use is granted without fee provided that copies are not made or distributed for profit or commercial advantage and that copies bear this notice and the full citation on the first page. To copy otherwise, to republish, to post on servers or to redistribute to lists, requires prior specific permission and/or a fee. QoSA’12, June 25–28, 2012, Bertinoro, Italy. Copyright 2012 ACM 978-1-4503-1346-9/12/06 ...$10.00.
1.
INTRODUCTION
Resource sharing promises significant cost savings in cloud environments, thanks to the reduced per customer overheads and economies of scale [20] [1]. The most significant obstacle for potential cloud users, besides data isolation and security aspects, is unreliable performance [11] [1] [3]. Therefore, providing performance guarantees is a major research issue in the area of cloud computing [8]. Providing one cloud customer constant Quality of Service (QoS) independent from the load induced by others is referred to as performance isolation. NIST [18] defines three service models for cloud computing. The Infrastructure-as-a-Service (IaaS) model leverages virtualization to share hardware resources among customers. The Platform-as-a-Service (PaaS) model hosts applications of different customers within one middleware instance. Software-as-a-Service (SaaS) is the last model which provides a ready to run, hosted application. Isolating cloud customers in terms of the performance they experience is an important concern in each of these scenarios. The allocation of hardware resources is handled by the lower levels (e.g., IaaS) in the stack. Therefore, we see performance isolation as a bigger challenge in the PaaS and SaaS scenarios as they have no direct resource control in contrast to IaaS scenarios. Within a SaaS environment, a group of users sharing the same view onto the application are referred to as tenant. This view includes the data they access, the application configuration, Service-Level-Agreements (SLAs) and Quality-of-Service (QoS) aspects. Multi-tenant Applications (MTA) share one application instance between multiple tenants isolated from each other. The tight coupling of tenants results in strong interference. Isolation considering non-functional system properties is a major open research issue in the area of SaaS (e.g., by Bezemer [2] and Fehling [5]). To the best of our knowledge, no metrics and techniques for quantifying performance isolation have been proposed before. In this paper, we present three different methodologies and several alternative metrics which provide means to characterize the isolation capabilities of IT systems. The focus is in metrics which can be applied for performance bechmarks. We also propose measurement techniques for quantifying the proposed metrics. Moreover, we introduce general approaches for performance isolation at the architectural level in SaaS environments. Finally, we present four
concrete isolation methods including a case study demonstrating their effectiveness as well as the practical usability of the proposed metrics and measurement techniques for quantifying isolation. The remainder of the paper is structured as follows. In Section 2, we define performance isolation. Based on this definition, Section 3 presents the proposed isolation metrics. Section 4 discusses different approaches to ensure performance isolation within a MTA. Section 5 presents the experiment setup for the evaluation of the approaches and the metrics. Section 6 presents our evaluation results and Section 7 assesses the metrics and the isolation approaches. Section 8, surveys related work and Section 9 concludes the paper.
2. PERFORMANCE ISOLATION IN SHARED ENVIRONMENTS 2.1 Fairness Performance concerns in cloud environments are a serious obstacle for consumers. To avoid distrust, it is necessary to ensure a fair behavior of the system with respect to its different customers. Due to sharing of resources, performancerelated issues are often caused by a minority of customers sending a high amount of requests. We define a system as fair, if the following conditions are met: 1. Customers working within their assigned quota should not suffer from customers exceeding their quotas. 2. Customers exceeding their quotas should suffer performance degradation. 3. Customers with higher quotas should be provided better performance than customers with lower quotas. Within this paper quota refers to the amount of workload a tenant is allowed to execute. In the following, more details on concepts related to the definition of a fair behavior are presented.
2.2 Isolation In this paper, we focus on the first fairness criterion defined above which is achieved by performance isolation. Performance isolation is defined as follows. Performance Isolation: A system is performance-isolated, if for customers working within their quotas the performance is not affected when other customers exceed their quotas. Additionally, it is possible to relate the definition to SLAs: A decreased performance for the customers working within their quotas is acceptable as long as it is within their SLAs. One way to achieve performance isolation is by resource isolation which enforces a strict isolation of resources allocated to different customers. Weak Performance Isolation: Weak performance isolation refers to the case where performance isolation is achieved within a limited range of exceeded quota from a disruptive customer. Non-Isolation: We speak of non-isolation, if the behavior of any customer may influence the performance observed by other customers. Thus, every customer may suffer from bad performance caused by one single disruptive customer exceeding its quota. Elasticity: To clearly differentiate elasticity from performance isolation we present the following example. Assume
a system is in an overloaded situation because of one disruptive tenant. It could be a solution to provision and allocate additional resources by leveraging underlying technologies to maintain customers SLAs. This is elasticity. That could be acceptable, if the disruptive tenant pays for the increased overall capacity which might relate to his quota (fair with regards to property 3). If the disruptive tenant does not pay for the extra resources, the system is no longer fair.
3.
METRICS
In the following section, we introduce different metrics to quantify the isolation capabilities of a system. To provide a level playing field for comparisons, it is important to explicitly consider the workload profiles used when applying the metrics. For example, a given response time for a system is meaningless without consideration of the system load during which the response time was measured. In our case further aspects like the number of customers with exceeded quota might also influence the results. In this section, we focus on the definition of adequate isolation metrics. The metrics we define may be applied to quantify the isolation of any measurable QoS-related system property in any system shared between different entities. As such, the metrics are not limited to performance isolation and SaaS environments although these are in the focus of this paper. Of course, the actual type of workload and QoS must be selected according to the scenario under investigation. Later on in Section 5 we propose a set of specific workloads which can be used for benchmarking performance isolation. We distinguish between groups of disruptive and abiding customers. The latter work within their given quota (e.g., defined number of requests/s) the former exceed their quota. Our metrics are based on the influence of the disruptive customers on the abiding customers. For the definition of the metrics, we define a set of symbols in Table 1. Table 1: Overview of variables and symbols Symbol t D
A
wt
W zt (W )
I
Meaning A customer in the system. Set of disruptive customers exceeding their quotas (e.g., contains customers inducing more than the allowed requests per second). Set of abiding customers not exceeding their quotas (e.g., contains customers inducing less than the allowed requests per second). Workload caused by customer t represented as numeric value increasing with higher load (e.g., request rate and job size). wt ∈ W The total system workload as a set of the workloads induced by all individual customers. A numeric value describing the QoS provided to customer t. The individual QoS a customer observes depends on the composed workload of all customer (W ). Lower values of zt (W ) correspond to better QoS (e.g., response time). The degree of isolation provided by the system. In the following paper, we add an index to distinguish different metrics and present methods for the quantify each of them.
QoS-oriented approaches define an isolation metric based on considering the influence of disruptive customers by measuring their impact on the QoS provided to customers working within their quotas. These metrics depend on at least two measurements. First, the observed QoS results for every t ∈ A at a reference workload Wref . Second, the results for every t ∈ A at a workload Wdisr when a subset of the customers have increased their load to challenge the system’s isolation mechanisms. As previously defined Wref and Wdisr are composed of the same customers (t ∈ A ∪ t ∈ D) with an increased workload for the disruptive customers at Wdisr . We consider the relative difference of the QoS (∆zA ) for abiding customers at the reference workload compared to the disruptive workload. ∑ [zt (Wdisr ) − zt (Wref )] t∈A ∑ ∆zA = (1) zt (Wref ) t∈A
Additionally, we consider the relative difference of the load induced by the two workloads. ∑ ∑ wt − wt ∆w =
wt ∈Wdisr
∑
wt ∈Wref
wt ∈Wref
(2)
wt
Based on these two differences the influence of the increased workload on the QoS of the abiding tenants is expressed as follows. ∆zA IQoS = (3) ∆w A low value of this metric represents a good isolation as the difference of the QoS in relation to the increased workload is low. Accordingly, a high value of the metric expresses a bad isolation of the system. The metric provides a result for two specified workloads (Wref and Wdisr ) and thus the selection of the workloads plays an important role. Only one measurement for a given workload tuple (Wref , Wdisr ) might not be sufficient. Thus, one could enhance the metric by considering the arithmetic mean of IQoS for different workload scenarios. It is conceivable that a provider is interested in the relative difference of disruptive workload ∆w at which abiding tenants receive a predefined proportion of the promised QoS ∆zA . This could be used as one additional metric.
3.2 Workload Ratios The next metrics are not directly associated with the QoS impact resulting from an increased workload of disruptive customers. The idea is to compensate the increased workload of disruptive customers and try to keep the QoS constant by decreasing the workload of the abiding ones. Such a behaviour does not reflect productive systems. Thus, these metrics are planned to be applied in benchmarks with artificial workloads. Assume one starts measuring the isolation behavior of a non-isolated system by continually increasing the disruptive workload Wd . One would expect to observe a decrease of zt (W ) for all customers. In such a situation, zt (W ) would remain unaffected if the workload of the abiding customers
Wa is decreased accordingly to compensate for the increase in the disruptive workload.
Abiding workload
3.1 Metrics based on QoS Impact
Waref Non-Isolated Isolated Real System
Wabase
Wdref
Disruptive workload
Wdbase
Wdend
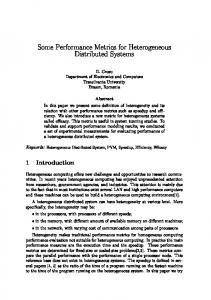
Figure 1: Fictitious isolation curve including upper and lower bounds. In Figure 1 the x-axis shows the amount of workload Wd caused by the disruptive tenants, whereas the y-axis shows the amount of the workload Wa caused by the abiding tenants. The blue/solid line shows how Wa has to decrease to maintain the same QoS as in the beginning. This function would be linear in a non-isolated system. In a perfectly isolated system the increased Wd has no influence on zt (W ) for all t ∈ A. Thus, Wa would be constant in this case as shown with the red/dashed line in the figure. The red line and the blue line provide exact upper and lower bounds, corresponding to a perfectly isolated and a non-isolated system, respectively. Figure 1 shows some important points referenced later and defined in Table 2. Table 2: Overiew of relevant points Symbol Wd
Definition The total workload induced by the disruptive ∑ wt customers: Wd =
Wdbase
The level of the disruptive workload at which the abiding workload in a non-isolated system is decreased to 0 due to SLA violations. The level of the disruptive workload at which the abiding workload must decreased to 0 in the system under test The value of the disruptive workload at the reference point in the system under test. This is the point to which the degree of isolation is quantified. It is defined as the disruptive workload, at which in a non-isolated system the abiding workload begins to decrease. The total workload ∑ induced by the abiding customers: Wa = wt
wt ∈W |t∈D
Wdend Wdref
Wa
wt ∈W |t∈A
Waref
Wabase
The value of the abiding workload at the reference point Wdref in the system under test: Waref = Wdbase − Wdref The value of the abiding workload corresponding to Wdbase in the system under test.
Based on this approach, we define several metrics presented in the following. As discussed before, the workload scenarios play an important role, and thus it may be necessary to consider multiple different workload scenarios and average over them as previously.
3.2.1 Significant Points The significant points marked in Figure 1 provide several ways to define an isolation metric by themselves. Iend is a metric derived the point at which the workloads of abiding customers have to be decreased to 0 to compensate for the disruptive workload. The metric sets Wdend and Waref in relation. It is worth to mention again that Waref = Wdbase − Wdref . With Figure 1 in mind, Ie nd is defined as follows: Iend =
Wdend − Wdbase Waref
(4)
Both metrics have some drawbacks resulting from the fact that they do not take into account the curve progression. This means, that in a system which behaves linearly until a short distance from Wdbase and then suddenly drops to Wa = 0, both metrics would have the same value as in the case of a completely non-isolated system which is obviously unfair in this case. Moreover, a well isolated system might require a very high disruptive workload before Wa drops to 0 making it hard to measure the metric in an experimental environment. Ibase has some further disadvantages given that it is only representative for the behavior of the system within the range of Wdref and Wdbase . Given that the metric does not reflect what happens after Wdbase , it may lead to misleading results for well isolated systems whose respective Wdend points might differ significantly. For systems that exhibit a linear isolation behavior, we could also define isolation metrics based on the angle between green line corresponding to the measured system under test and the blue line corresponding to the non-isolated case. However, linear behavior typically cannot be assumed.
3.2.2 Integral Metrics We define two further isolation metrics addressing the discussed disadvantages of the above metrics. They are based on the area under the curve derived for the measured system Ameasured set in relation to the area under the curve corresponding to a non-isolated system AnonIsolated . The area covered by the curve for a non-isolated system is calculated as Wa2ref /2. The first metric IintBase represents the isolation as the ratio of Ameasured and AnonIsolated within the interval [Wdref , Wdbase ]. We define fm : Wd → Wa as a function which returns the residual workload for the abiding customers based on the workload of the disruptive customers. We then define the metric IintBase as follows: Wd ∫base fm (Wd )dWd − Wa2ref /2 Wd
ref
Wa2ref /2
Wd
IintF ree =
Another approach uses Wabase as a reference. Setting this value and Waref in relation results in an isolation metric having a value between [0, 1]. The formula for metric Ibase is below: Wabase Ibase = (5) Waref
IintBase =
IintBase has a value of 0 in cases the system is not isolated and a value of 1 if the system is perfectly isolated within the interval [Wdref , Wdbase ]. The metrics major advantage is, that the value provided allows to set the system directly into relation to an isolated and non-isolated system. This metric again has the drawback that it only captures the system behavior within [Wdref , Wdbase ]. In a well isolated system it might not be feasible to measure the system behavior only up to Wd base. Thus, the following metric IintF ree allows to use any predefined artificial upper bound pend which represents the highest value of Wd that was measured in the system under test. We define the metric as follows: pend ∫ fm (Wd )dWd − Wa2ref /2
(6)
ref
Waref · (pend − Wdref ) − Wa2ref /2
(7)
This metric quantifies the degree of isolation provided by the system for a specified maximum level of injected distructive workload pend . A value of 1 represents a perfect isolation and a value of 0 a non-isolated system.
4.
PERFORMANCE ISOLATION IN MULTITENANT APPLICATIONS
This section discusses different approaches to enforce isolation within a multi-tenant application. We start with an overview of a multi-tenant architecture presented by Koziolek [14] and discuss related performance isolation extension. Following this, we present some detailed approaches to enforce performance isolation.
4.1
Multi-tenant Software Architectures
Koziolek [14] [13] analyzed several existing multi-tenant solutions. Based on this, he developed a generic architecture and a corresponding style describing the existing multitenant applications. Figure 2 presents Koziolek’s architecture. The numbers were added by us and present potential points where the system performance can be influenced. The architecture relies on the common three tier web application model enhanced with a Meta-Data Manager and a MetaData Database responsible for tenant-specific customization regarding the functional/non-functional behavior and/or appearance of the application.
Figure 2: Potential points for a performance adaptation in multi-tenant architectures based on [14] [13] Admission Controll(1): Controlling the incoming requests based on awareness of the tenant they originate from can enable a MTA to differentiate the provided QoS level and to isolate tenants. One solution could be to discard requests
sent by a disruptive tenant in order to maintain the service level for the abiding tenants. Cache Restrictions (2): In some MTA, cached objects might be shared between tenants. Some applications (like multimedia platforms) could use high amounts of tenant specific data. Restricting the size of the cache available to tenants is one way to isolate them from using space reserved for others. Load Management (3): The ability of a MTA to serve different tenants with one instance does not prevent us from having several application instances available. Thus, a load balancer could enforce some isolation by forwarding requests of disruptive tenants to different application instances than those of abiding tenants. Thread Priorities (4) and Thread Pools (5): The main computing power is consumed by threads handling requests. Thus, it is possible to implement isolation approaches by leveraging thread management functionality. For example, using a separate thread pool for every tenant limits the number of threads one tenant could allocate at a time. Another idea is to dynamically control priorities of threads depending on the tenant. Database admission (6): Controlling the incoming database requests based on the tenant they originate from can enable a MTA to differentiate the provided QoS level and to isolate tenants. Controlling tenant specific database cache sizes at the application level is another approach to isolate tenants.
4.2 Performance Isolation Solutions In this section, we introduce four approaches for enforcing performance isolation focusing on response time as primary QoS metric. These concepts leverage on admission control and thread pool management mechanisms. In the following, you will find figures, explaining the basic architectural structure of the different approaches. Every approach implements two top level components: A Request Manager handling the incoming request and an Application Server providing the Request Processor. In the default case, the Application Server’s Request Processor has one thread pool with restricted size processing the requests. Artificial Delay: This approach (Figure 3a) artificially delays incoming requests depending on the request rate of the corresponding tenant. In closed workload scenarios this results in artificially increased response times for tenants exceeding their quotas and generates backpressure. Thus, the overall workload induced by a tenants is controlled. A new request arrives the Request Manager’s Quota Checker which evaluates the tenants currently used quotas, and stores the results together with the allowed quotas in the tenants meta data. After that, the quota checker triggers the request delayer, which possibly delays the processing of a request before it is forwarded to the Request Processor for processing. The duration of the artificial delay could be constant. The current demand of the system and the difference between the allowed and actual usage of the system could be used to calculate a dynamic delay. Within the application server, the request might be FIFO-queued again, because of the restricted size of the thread pool. Round Robin: Round robin (Figure 3b) introduces separate queues for different tenants. There is no more need for a queue at the application server in this scenario, as requests are directly buffered at the Request Manager. When a new request approaches the system, it is queued in the
corresponding tenant’s queue. If the Request Processor has free threads, it triggers the Next Request Provider to deliver a new request. The Next Request Provider then uses round robin to retrieve the next request. An empty queue for one tenant is skipped and does not block the processing of the others. Blacklist: The blacklist method (Figure 3c) triggers the quota checker for every request. It checks if the quota for this particular tenant is exceeded. The quotas available to tenants and the quotas actually used by them are maintained in the tenants meta data. If a tenant exceeds its quota, it is blacklisted. Requests from blacklisted tenants are enqueued in a separate list. When the Request Processer requests for the next request, the Next Request Provider takes the next request from the white queue on a FIFO basis. Usually, requests from the blacklist queue are only handled if the normal queue is empty. This leads to a problem, when a tenant is removed from the blacklist but he has requests still pending in the blacklist queue. If there are always requests in the white queue, blacklisted requests will never be handled. We realized a mechanism that slowly drops requests from the blacklist (e.g., every 30th request). The method takes the first request, at which the tenant is actually not blacklisted anymore. Separate Thread Pools: The separate thread pool method (Figure 3d) provides a separate thread pool for each tenant. The limited size of these pools isolates the tenants from each other. The conceptual model includes a separate FIFO queue for each tenant. Every time, one of the tenant specific thread pools has an idle thread, the Worker Controller requests a new request from the Next Request Provider. The Next Request Provider selects a pending request according from the tenants thread pool.
5.
EVALUATION METHODOLOGY
To evaluate the practical usability of the proposed isolation metrics we applied them to quantify the performance isolation that can be achieved using the methods presented in the previous section.
5.1
Simulation
We employed the ssj1 discrete event simulation framework [16] as a simulation allows us to evaluate different concepts and the metrics efficiently without disturbing influences. The major artifacts that were simulated are the RequestManager, RequestProcessor, Tenant and Scheduler. The RequestManager is responsible to realize the different approaches for performance isolation discussed previously. The RequestProcessor is responsible to simulate the behavior a request has when it is served by using the scheduling strategies defined. The capacity of requests it could handle is limited. The Scheduler used within our evaluation simulates a resource which is partially shared. Thus, the processing time for a request is not increasing linearly with the number of requests, as it is typical for real-life systems. Every Request handled by the RequestProcessor contains information about its assumed service time without contention. This value is continuously decreased. When the residual time becomes 0 the request is seen as processed and sent back to the corresponding Tenant. The calculation of the residual service time for each request, in each iteration, is based on 1
http://www.iro.umontreal.ca/˜simardr/ssj/indexe.html
New Request Request Manager
New Request
New Request Request Manager
Request Manager
Quota Checker
Request Adder
Tenants
R
Quota Checker
Request Adder Normal Queue
Tenants R
R R R
Request Delayer
FIFO Queues
Blacklist Queue
Normal queue always first
R R
App. Server
Request Processor
(a) Artificial Delay
R
Worker Controller
Request Processor
(b) Round Robin
R
R
App. Server
R
App. Server
tn Queue
R R R
Next Request Provider
Next Request Provider
R
t1 Queue
(c) Blacklist
Pool t1
Pool tn
W W W
W W W
Request Processor
(d) Thread Pool
Figure 3: Methods for performance isolation in multi-tenant applications
the number of requests in the RequestPocessor and a user defined factor.
5.2 Evaluation Scenarios In this section, we present the workload profiles, the performance related QoS of interest and the configuration we have chosen for our evaluation.
5.2.1 QoS-Metric and Considered Workload The QoS metric we focus on is the response time. The time is measured from the moment a request leaves a tenant to the point in time a tenant receives the response. Thus, zt (W ) returns the average response time for t. As a measure for the workload caused by the tenants, the number of users associated with each tenant is used. The workload profile we used is described by the users’ behavior, the type of requests sent, the amount of tenants in each group D and A, and the number of users associated with each tenant. In a MTA the workload induced by the tenants is rather homogeneous (except the amount). In our simulation, all users send requests of the same type with a mean think time of 1000ms and a standard deviation of 100ms in a closed workload scenario. We expect that the system runs with a high utilization for economic reasons. Another reason for running under high utilization is our goal of evaluating performance isolation aspects. In a system with low utilization, the increased workload of one tenant would have low impact. Therefore, we designed our system to serve total 80 users. The mean service time for a request in the system without contention is 1000ms with a standard deviation of 150ms. We consider one normal scenario and one with over commitment. In the first scenario, the quota is set to 8 users and in the overcommitted one to 24. In both situations, we expect only one disruptive tenant (t0 ). The number of users in the first scenario is 8 and in the overcommitted one t0 = 24, t1 ..t3 = 8, t4 = 4, t5 ..t8 = 1, t9 = 24. Thus, the total workload was set to a value at which the system is already at its limit of 80 users and the disruptive tenant allocates his full quota. We consider this to be the best reference point. First, an increased workload of one tenant in a non-isolated system would immediately cause
SLA violations. Second, with the next increase of workload by the disruptive tenant the isolation mechanisms should intervene. For the QoS-oriented metrics, we also have to define the disruptive workloads. For t0 we have chosen 24, 40 and 251 users in the normal mode. In the overcommitted scenario the number of users are set to 40, 56 and 251. In the following, we indicate the number of users by adding indexes to the various symbols in order to distinguish the results.
5.2.2
Configuration
In the chosen configuration with a standard, non-tenant aware FIFO queue as RequestManager, the maximum throughput achieved is 18 requests/second at a response time of 2110ms (Figure 4). This results in 38 requests handled in parallel. Thus, the size of the thread pool is restricted to 38 threads for an optimal throughput. Without a restricted thread pool, most of the presented performance isolation approaches would fail, as the RequestManager would always forward the requests to the processor. When 80 users are simulated, a standard FIFO queue results in an average response time of 3500ms and 62 requests in the system, whereby 24 are queued.
6.
EVALUATION RESULTS
In this section, we present the results from the simulation described above and briefly comment on the observations made in the various considered scenarios. The overall assessment follows in a separate section. Exemplary we calculate Iqos24 for the normal non isolated case and IintF ree251 for the delay method in the overcommitted scenario. In the non-isolated case the simulation returns a response time of 3446ms at the reference workload of 8 users for t0 and 4334ms at the disruptive workload with 24 users for t0 . Due to the absence of isolation the average response time for the abiding customers is the same as for the disruptive customers. This results = 0.258. The relative increase of in ∆zA24 = 4334−3446 3446 workload is ∆w = 96−80 = 0.2. Consequently the isolation 80 = 1.29. metric is calculated as Iqos24 = 0.258 0.2 In the delayed scenario with IintF ree251 the point pend is at 251, Wdref is 24. The integral desribing the area below
Table 5: Results of integral-based metrics for overcommitted workload
3000
900 800
2000
600 500
1500 400
Approach Non-Isolated Round Robin Thread Pools Delay Black List
Response time (ms)
Throughput (Requests/min)
2500 700
1000
300
Iend 0 n/a n/a 1.5 n/a
overcommitted Ibase IintBase 0 0 1 1 1 1 0.75 0.86 0.96 0.94
IintF ree251 0 0.99 1 0.28 0.96
200 500
Requests/min 100
Respone time 0
0 1
2
3
4
5
6
7
8 9 10 11 12 13 14 15 16 17 18 19 Workload (Requests/s)
Figure 4: Measurement of Throughput and Response Time ∫ the curve of remaining abiding users f (Wd )dWd within the limits [24, 251] is directly deduced from the measurements (Figure 5) and has a value of 4687. Waref was set to 56 in the workload definition. Thus, Wa2ref /2 = 1568 and conse4687−1568 quently IintF ree251 = 56·(251−24)−1568 = 0.28 Concerning the overview of all results we begin with the QoS related metrics presented in Table 3. The value for the isolation in the non-isolated situation is almost the same in every case as the impact on the performance is linear, because it stems from the extended length of the queue. Table 3: Results of QoS based metrics
Approach NonIsolated Round Robin Thread Pools Delay Black List
normal overcommitted IQoS24 IQoS40 IQoS251 IQoS40 IQoS56 IQoS251 1.29 1.29 1.29 1.29 1.29 1.29 0.00
0.00
0.000
0.02
0.02
0.06
0.00
0.00
0.00
0.01
0.00
-0.01
0.32 0.09
0.59 0.10
1.22 0.01
-0.49 -0.73
0.19 -0.26
1.22 0.02
impact onto the metrics aligned with selected conspicuous measurements. Round Robin: This method provides a good isolation in every scenario. In the chosen scenario, the waiting queue for the disruptive tenant was never empty at the reference workload. Therefore, t0 was not able to disrupt the other tenants by increasing its workload. In cases where at the reference workload the queue of the disruptive tenant runs empty, the increased load is expected to influence the others tenants. Separate Thread Pools: In the normal mode, the size of the thread pools was set to 4 which results in around 38 allowed threads in the system. To keep the response time for the tenants with 24 users lower than 3500ms we had to increase the thread pool to 17 threads. This resulted in an overloaded situation, but thanks to the reduced queueing time we still achieved a response time of 3.5s at the reference workload. Overall, the thread pool approach showed a very good isolation. Artificial Delay: The threshold for the artificial delay was based on the number of users logged in for one tenant. The negative values of IQoS40 and IQoS56 stem from the constant penalty added to every request arising from the disruptive tenants. Therefore, a part of the disruptive tenants’ resources become available for the other tenants and consequently the QoS for the abiding tenants improves. This results in negative isolation values. The isolation works only within a limited range because of the constant character of the delay. This point can be seen in Figure 5 when the abiding workload begins to decrease. 60 Non-Isolated Delayed 50
Table 4: Results of integral based metrics at normal workload
Iend 0 n/a n/a 1.11 n/a
Ibase 0 1 1 0.58 0.94
normal IintBase 0 1 1 0.68 0.96
30
20
10
IintF ree251 0 1 1 0.23 0.97
cusses different behaviors of the isolation methods and their
0 24 29 34 39 44 49 54 59 64 69 74 79 84 89 94 99 104 109 114 119 124 129 134 139 144 149 154 159 164
Approach Non-Isolated Round Robin Thread Pools Delay Black List
40 Abiding workload
Table 4 and Table 5 present the integral related metrics for the different approaches and workloads. The n/a entries stem from a very high value of Wdend which was not in the range of our evaluation. The rest of the section dis-
Disruptive workload
Figure 5: Reduction of abiding workload while artificial delay is activated in the overcommitted scenario.
Blacklist: The blacklist exhibits a similar behavior as the artificial delay in the beginning. Therefore, a negative isolation was measured. The relevant metric for blacklisting the tenant is its throughput. The raw data shows, that sometimes a white tenant is also blacklisted for a short while. This occurs in situation when the actual disruptive tenant becomes blacklisted and his part of the resources become available for the other tenants. In that situation the response time and consequently the request rate of the abiding tenants improves and exceeds the quota. However, the effect is negligible with regards to the average response times.
7. FINAL ASSESSMENT In the following we evaluate the metrics, regarding their expression and feasibility. Moreover, we present a short evaluation of the isolation approaches.
7.1 Metrics For the evaluation of the metrics we concentrate on the following aspects. First, how feasible is the metric for the target group of a system owner/provider or a developer/researcher. Second, the metric’s expressiveness in terms of the type of evidence it provides. Third, the number of measurements required to obtain a valid value. Fourth, situations in which the metric is not meaningful. QoS Impact: These metrics show the influence of disruptive workloads on the QoS of abiding tenants. This helps system owners to manage their systems, because it indicates the influence of disruptive workload onto the QoS they provide, which is important for capacity planning. QoS-based metrics can prove that a system is perfectly isolated, however they fail in ranking a systems isolation capabilities into the range between isolated and non-isolated. In the example shown, we were able to measure the system’s behavior in a non-isolated case. In reality this is rarely possible, as a system owner or user might not be able to change the system’s isolation method. A single IQoS metric can be derived with only two measurements to obtain evidence for one point of increased workload. However, to obtain some more detailed information concerning the systems isolation more measurements are required. Significant Points: The metric Iend might not be feasible to quantify isolation in well isolated systems. Furthermore, it is not possible to directly deduce relevant system behaviors like response times. If the metric is given, it could help to compare two systems regarding the maximum disruptive load they can handle. To determine Iend , more measurements as for QoS-based metrics are required. Ibase orders a system within the range of isolated and nonisolated systems for one specific point in the diagram. Nevertheless, it does not provide information about the behavior of the system before that point. It is limited to comparing the isolation behavior of the systems at one selected load level and it is inadequate to derive direct QoS-related values. The usefulness of this metric appears to be of limited value in contrast to the integral methods. One advantage is the evidence at a well-defined and reliable point with only two measurements. Integral Metrics: IintBase and IintF ree are widely comparable metrics. IintBase has the advantage to be measured at a predefined point. For IintF ree , the endpoint of the interval must be considered as well to have an expressive metric. Both metrics provide good evidence of the isolation within
the considered interval, ordered between the magnitudes of isolated and non-isolated systems. They lack in providing information concerning the degree of SLA violation. For example, the SLA violation could be very low and acceptable or critically high in each iteration when we reduce Wa . However, in both cases, the results of the metrics are similar. This limits the value of IintBase and IintF ree for system owners/providers. However, for comparison of systems and analyzing their behavior, the metrics are very useful and can be exploited by developers or researchers. Finally, on the negative side, a disadvantage of these metrics is that their measurement may be a time consuming task.
7.2 Effectiveness of the Isolation Methods The evaluation of the isolation methods is primarily based on the results from our simulation study. Additionally we highlight some other aspects that struck our attention. Round robin provides a very good isolation. However, it is not sufficient for overcommitted systems as it cannot fully leverage the unused resources from some tenants. It is possible to increase a tenant’s throughput by skipping empty queues. However, as long as requests are pending in every queue, tenants with more users have higher response times. In our case the tenants with 24 users had around 4660ms response time, even in cases in that the total amount of users was within the limits in which the system could provide 3500ms for every tenant. This is an issue in overcommitted systems. Furthermore, it is not possible to provide different QoS to different tenants using a simple round robin. Thread pools achieve good isolation in the simulations and QoS differentiation is achievable by using different thread sizes. Besides that, the processing speed and throughput of tenants is better if some tenants do not allocate all of their threads. This also increases the throughput. In the chosen overcommitted scenario, the response time is widely constant over all tenants at the reference workload. A disadvantage is that the total number of potential threads is above the optimal working point of the server. Thus, there is a danger of congesting the server. The delay approach seams to be ineffective, because of its weak isolation. A dynamically assigned delay could increase effectiveness with the drawback of increased complexity of the method. The introduction of different thresholds enables QoS differentiation. The blacklist approach provides a good isolation over a wide range of disruptive workloads. Furthermore, it could achieve different QoS, especially for throughput, by using different thresholds. Additionally, unused resources are equally used by all tenants. For the abiding tenants, in the overcommitted scenario, this results in the same response time (around 3500ms) for each. In our setup, the response time at Wdisr56 was around 9360ms for t0 when the thread pool is used. In the black list approach, it was around 16040ms. In both cases, the mean response times for the other tenants was around 3500ms. This stems from the abiding tenants that were blacklisted from time to time resulting in unstable performance.
8.
RELATED WORK
We divided the related work into two parts. The first is about related work in the area of the defined isolation metrics. The second covers related work in the field of performance isolation in MTA.
8.1 Metrics The lack of performance guarantees is one of the major obstacles in cloud computing [1] [3]. As a result different benchmarks and metrics were developed in the last years. Usually these publications focus on single aspects of cloud services like databases (e.g., [4]). Others discuss metrics for cloud features like elasticity (e.g., [15]). However, the most relevant related work we found, comes from the field of virtualization, which is the main enabling technology for IaaS. One industrial example is VMmark [9], a benchmark developed by VMWare. They define a tile as a set of VMs serving different applications (e.g., mail server and SPECweb2005). Several tiles are deployed on a virtualized hardware. The benchmark score is based on a normalized overall throughput of the applications, a hosting platform could achieve. The total throughput increases with the number of tiles deployed as long as the system is not saturated. VMWare publishes the number of tiles in addition to the throughput. However, VMmark focuses on overall performance of a hosting platform and fails to quantify the mutual influence, of the different workloads. Georges et al. [6] developed two metrics to express the efficiency of a virtualized environment. One similar to VMmark. The other, Average Normalized Reduced Throughput (ANRT), reflects the loss of throughput on a per VM basis, when additional VMs are deployed. Nevertheless, they do not set the amount of changed workload in relation to ANRT and use static amount of workload for the VMs. Thus, these metrics are not feasibly to be used for quantifying performance isolation. Koh et al. [12] collected data within an experimental environment to closely characterize the performance inference of workloads in different VMs. In addition, a prediction mechanism was implemented to predict the inference of these workloads. Huber et al. [10] created a feature tree capturing the mutual influences of different VMs with different resource requirements. This was done in an automated way. Nevertheless, Huber and Koh did not extract a single value describing the systems isolation behavior which might be used within a benchmark. Furthermore, their approaches focus on hardware related resources, only available in white box scenarios. Consequently the approaches are hard to be used in SaaS or PaaS scenarios. Guo et al. [7] defined performance isolation based on their understanding of a fair system behavior. From their point of view a system should prevent high performance for one tenant at the cost of another. In cases the SLAs of the tenants differ, providing different performance is still seen as fair. However, our definition of fairness was explicitly divided into three different aspects. Additionally, we see performance isolation as only one part of a fair behavior. Ensuring different SLAs on the system is important and is integrated as one aspect in our definition of fairness although it does not directly relate to performance isolation.
8.2 Performance Isolation in MTAs The popularity of multi-tenancy arose with the increasing interest in SaaS applications. Several publications focus on general aspects of MTA, their requirements and potential implementations [2] [7] [19]. Regarding performance, related work is mostly concerned about resource efficiency. Fehling et al. [5] analyzed the
challenges arising from multi-tenant scenarios and provided a method to place tenants onto locations with different QoS. Zhang [22] developed a method to place on boarding tenants on a restricted set of nodes without SLAs violations. A good placement helps to decrease the interference. However, it cannot completly ensure isolation. Schroeter et al. [21] present a tenant aware component model which allows automated reconfiguration. This might be leveraged to ensure isolation by placing a disruptive tenant onto single nodes or by adding resources (elasticity). Nevertheless, performance isolation is not in the focus of this paper and based on our definition, elasticity does not automatically ensure isolation. An approach to achieve performance isolation within MTAs was proposed by Lin et al. [17]. They provide different QoS on a tenant’s base. Additionally, one test case evaluated the system regarding tenant specific workload changes and their interference. Two proportional-integral controllers were used to achieve this. The first one ensures the average overall response time by regulating the request rate; the second one leveraged different thread priorities to control the response times for different tenants. However, this approach was built mainly with the goal to differentiate QoS. Although it provides minimal admission rate settings for each tenant, the rates used are far below the system’s limit. No evaluation was done for scenarios where the tenant quotas were sized to work at a saturated system. Furthermore, compared to the above approach our proposed isolation methods reduce the complexity of the implementation.
9.
CONCLUSION
Cloud environments are becoming widely adopted due to their cost efficient way of providing resources. However, performance isolation is still a widely open issue, especially for SaaS offerings. This paper presents two different approaches and three basic metrics, for quantifying performance isolation, decoupled from a concrete scenario and evaluated them in the context of multi-tenant SaaS applications. The first one is based on the impact of an increased workload, from one customer, on the QoS of other customers. This metric has strengths to express the impact of workload on the QoS which is relevant for capacity planning. The second group of metrics does reduce the workload of the customers working within their quota (Wa ), if the workload of the disruptive customers increases. This maintains constant QoS for the residual workload of Wa . One subgroup of metrics relies on resulting significant points (e.g., when Wa becomes 0), another one on the area under the curve of Wa . The results show strengths of these metrics in ordering a system between the magnitudes of isolated and non-isolated which makes systems easily comparable. Furthermore the paper provides an overview of different approaches to achieve performance isolation within a multitenant application. In addition, we realized four approaches within a simulated environment. The subsequent discussion showed that either round robin for scheduling requests of different tenants or blacklisting disruptive tenants is a suitable approach. Our future research goals are targeted at developing more advanced isolation approaches which address all fairness aspects discussed in the beginning of the paper and consider multiple server instances. Furthermore, we will investigate
the implications of different request types on the isolation methods and metrics.
10. ACKNOWLEDGEMENTS
[11]
The research leading to these results has received funding from the European Union’s Seventh Framework Programme (FP7/2007-2013) under grant agreement No 258862. [12]
11. REFERENCES [1] Armbrust, M., Fox, A., Griffith, R., Joseph, A. D., Katz, R. H., Konwinski, A., Lee, G., Patterson, D. A., Rabkin, A., Stoica, I., and Zaharia, M. Above the clouds: A berkeley view of cloud computing. Tech. Rep. UCB/EECS-2009-28, EECS Department, University of California, Berkeley, Feb 2009. [2] Bezemer, C.-P., and Zaidman, A. Multi-tenant SaaS applications: maintenance dream or nightmare? In Proceedings of the Joint ERCIM Workshop on Software Evolution (EVOL) and International Workshop on Principles of Software Evolution (IWPSE) (New York, NY, USA, 2010), IWPSE-EVOL ’10, ACM, pp. 88–92. [3] bitcurrent. Bitcurrent cloud computing survey 2011. Tech. rep., bitcurrent, 2011. [4] Cooper, B. F., Silberstein, A., Tam, E., Ramakrishnan, R., and Sears, R. Benchmarking cloud serving systems with YCSB. In Proceedings of the 1st ACM symposium on Cloud computing (New York, NY, USA, 2010), SoCC ’10, ACM, pp. 143–154. [5] Fehling, C., Leymann, F., and Mietzner, R. A framework for optimized distribution of tenants in cloud applications. In Cloud Computing (CLOUD), 2010 IEEE 3rd International Conference on (2010), pp. 252 –259. [6] Georges, A., and Eeckhout, L. Performance metrics for consolidated servers. In HPCVirt 2010 (2010). [7] Guo, C. J., Sun, W., Huang, Y., Wang, Z. H., and Gao, B. A framework for native multi-tenancy application development and management. In E-Commerce Technology and the 4th IEEE International Conference on Enterprise Computing, E-Commerce, and E-Services, 2007. CEC/EEE 2007. The 9th IEEE International Conference on (2007), pp. 551 –558. [8] Hauck, M., Huber, M., Klems, M., Kounev, S., M¨ uller-Quade, J., Pretschner, A., Reussner, R., and Tai, S. Challenges and opportunities of cloud computing. Karlsruhe Reports in Informatics 19, Karlsruhe Institute of Technology - Faculty of Informatics, 2010. [9] Herndon, B., Smith, P., Roderick, L., Zamost, E., Anderson, J., Makhija, V., Herndon, B., Smith, P., Zamost, E., and Anderson, J. Vmmark: A scalable benchmark for virtualized systems. Tech. rep., VMware, 2006. [10] Huber, N., von Quast, M., Hauck, M., and Kounev, S. Evaluation and modeling virtualization performance overhead for cloud environments. In Proceedings of the 1st International Conference on
[13]
[14]
[15]
[16]
[17]
[18] [19]
[20]
[21]
[22]
Cloud Computing and Services Science (CLOSER 2011), Noordwijkerhout, The Netherlands (May 7-9 2011), pp. 563 – 573. IBM. Dispelling the vapor around cloud computing. Whitepaper, IBM, IBM CorporationNew Orchard RoadArmonk, NY 10504 U.S.A., January 2010. Produced in the United States of AmericaJanuary 2010All Rights Reserved. Koh, Y., Knauerhase, R., Brett, P., Bowman, M., Wen, Z., and Pu, C. An analysis of performance interference effects in virtual environments. In Performance Analysis of Systems Software, 2007. ISPASS 2007. IEEE International Symposium on (april 2007), pp. 200 –209. Koziolek, H. Towards an architectural style for multi-tenant software applications. In Proc. Software Engineering (SE’10) (February 2010), vol. 159 of LNI, GI, pp. 81–92. Koziolek, H. The SPOSAD architectural style for multi-tenant software applications. In Proc. 9th Working IEEE/IFIP Conf. on Software Architecture (WICSA’11), Workshop on Architecting Cloud Computing Applications and Systems (July 2011), IEEE, pp. 320–327. Kupperberg, M., Herbst, N., Kistowski, J., and Reussner, R. Defining and quantifying elasticity of resources in cloud computing and scalable platforms. Tech. rep., Karlsruhe Institute of Technology, 2011. L’Ecuyer, P., and Buist, E. Simulation in java with SSJ. In Proceedings of the 37th conference on Winter simulation (2005), WSC ’05, Winter Simulation Conference, pp. 611–620. Lin, H., Sun, K., Zhao, S., and Han, Y. Feedback-control-based performance regulation for multi-tenant applications. In Proceedings of the 2009 15th International Conference on Parallel and Distributed Systems (Washington, DC, USA, 2009), ICPADS ’09, IEEE Computer Society, pp. 134–141. Mell, P., and Grance, T. The NIST definition of cloud computing. digital, 2011. Mietzner, R., Unger, T., Titze, R., and Leymann, F. Combining different multi-tenancy patterns in service-oriented applications. In Enterprise Distributed Object Computing Conference, 2009. EDOC ’09. IEEE International (sept. 2009), pp. 131 –140. Momm, C., and Krebs, R. A qualitative discussion of different approaches for implementing multi-tenant SaaS offerings. In Proceedings of Software Engineering 2011 (SE2011), Workshop(ESoSyM-2011) (2011). Schroeter, J., Cech, S., Goetz, S., Wilke, C., and Assmann, U. Towards modeling a variable architecture for multi-tenant SaaS-applications. In Proceedings of Sixth International Workshop on Variability Modelling of Software-Intensive Systems (VaMoS ’12) (2012). Zhang, Y., Wang, Z., Gao, B., Guo, C., Sun, W., and Li, X. An effective heuristic for on-line tenant placement problem in SaaS. Web Services, IEEE International Conference on 0 (2010), 425–432.