Application (SBA) is a complex task as multiple software and hardware components are involved such as business process engine, application server, server ...
International Journal of Applied Engineering Research ISSN 0973-4562 Volume 11, Number 6 (2016) pp 3897-3904 © Research India Publications. http://www.ripublication.com
Metrics for Monitoring a Hierarchical Service-Based System Sridevi Saralaya* Assistant Professor, Department of Computer Science & Engineering, St. Joseph Engineering College, Vamanjoor, Mangalore 575 028, Karnataka, India. Rio D’Souza Professor & Head, Department of Computer Science & Engineering, St. Joseph Engineering College, Vamanjoor, Mangalore 575 028, Karnataka, India. Vishwas Saralaya Associate Professor, Department of Microbiology, Kasturba Medical College, Manipal University, Light House Hill Road, Mangalore 575 001, Karnataka, India. appropriate metrics. When target values of performance indicators cannot be met, business analysts need to know the causes for such deviations. As performance indicators may be influenced by several factors, a clear insight into metrics at various levels help the domain experts to analyze causes for deviations. Defining performance indicators for a Service-Based Application (SBA) is a complex task as multiple software and hardware components are involved such as business process engine, application server, server software, hardware, network bandwidth, transport, messaging protocols etc. The behavior of services in a composite business process are not only determined by the software program, but also affected by factors such as hardware resources, the number of simultaneous client requests, available bandwidth and appropriateness of the input. Defining metrics that help to precisely measure attributes of a SBA is a challenging job due to unpredictable and dynamic nature of service infrastructure. Hence we observe that defining metrics for a SBA is a complex task due to dynamism, unpredictability and dependencies on various other components. Performance metrics of SBS can be associated with several levels of abstraction. Therefore in order to tackle such complexity we can visualize an SBA as made up of three abstract layers, namely Business Process Management (BPM) layer, Service Composition and Coordination (SCC) layer and Service Infrastructure (SI) layer [2]. We organize performance metrics according to three levels of abstraction namely, the business process workflow, services involved and associated infrastructure. We define metrics for each layer in view of identifying relationship between metrics, where a metric in one layer may be the cause for a metric abnormality in other layers. The metrics at higher level can be obtained by aggregation of metrics at the lower level. For example, the end-to-end execution time of the business process workflow depends on the sum of execution time of each invoked service. The performance of a service depends on the number of simultaneous requests and properties of the hosting server such as CPU load, Processor speed, Memory availability etc. Business process metrics emphasize on statistical indicators such as average execution time of the business process,
Abstract The dynamic nature of service infrastructure causes the Quality of Service (QoS) of Service-Based Systems (SBS) to be unpredictable during execution. This necessitates monitoring and analysis tools which collect, measure and analyse metrics that characterise performance of a SBS from diverse facades in order to recognize elements that contribute to anomalies. To have a clear insight into the working of a business process, performance metrics should be defined and measured from multiple facets of the SBS. Existing approaches which attempt to manage performance of a SBS focus on metrics of the business process, services or infrastructure resources. There is a lacuna in studies which define and assimilate metrics from all levels in order to gain a holistic view of the business process performance. In this study we define metrics at design-time to manage performance and obtain metrics from all the levels of an SBS during execution using Complex Event Process (CEP) paradigm. The empirical results demonstrate that our approach has negligible effect on the performance of the SBS. Keywords: Metrics, Service-Based System, Monitoring, Complex Event Processing.
Introduction A key aspect of the business process lifecycle is to continuously monitor adherence to business requirements and progress towards business objectives which help in continuous optimization of the process. In order to do so, appropriate performance indicators or metrics have to be defined and observed. A business metric is a quantifiable measure that is used to track and access the status of a specific business process. Every area of business has specific metrics that should be monitored. The term Business Activity Monitoring (BAM) was coined by Gartner [1] to describe technology that provides “Event-driven and Real-time access to (and analysis of) c ritical bus iness pe rformance i ndicators”. As stated by Buytendijk [1] BAM is not just developing the appropriate technology and processes, but also focusing on defining
3897
International Journal of Applied Engineering Research ISSN 0973-4562 Volume 11, Number 6 (2016) pp 3897-3904 © Research India Publications. http://www.ripublication.com average number of times an activity exceeds execution time, number of times an activity is invoked or cost per invocation. Performance metrics of the service layer concentrate on response time, reliability of service invocation and its availability. Infrastructure metrics involve Technology metrics and People metrics. People metrics are significant when an inordinate proportion of manual activities are involved. Technology metrics are important when the business process involves computer systems, application software and automated devices. Infrastructure metrics accentuate on obtaining CPU load, free memory available, role responsible for performing a service, etc. Existing approaches which attempt to manage performance indicators focus on metrics of any one of business process, service or infrastructure layer. There are very few studies which define and integrate metrics at all layers in order to gain a holistic view of the business process performance. Metrics have to be precise and practical in order to diagnose causes for performance anomaly. Hence metrics should be based on SMART criteria which specify five significant characteristics for defining performance indicators which are Specific, Measurable, Attainable, Realistic and Time-sensitive [3]. Metrics should be specific and should not be vague; metrics should be clear, concrete and measurable against standards or requirements. Metrics should be attainable, reasonable and should not be out of reach. Metrics should be realistic in the execution environment, helping in identifying capability of the services and/or resources. Metrics should be limited to a time frame which dictate the scope within which the metric has to be monitored. Defining the metrics at design-time should be followed by obtaining values of the metrics with least intrusion to the SBA being monitored. In this study we define metrics for the three layers of abstraction of a Service-Based Application (SBA) and obtain these metrics from all the levels of the SBA during run-time using CEP technology. The contributions of this study are: • Identifying components for each level and defining metrics for them. • Accumulating (Measuring) metrics from all levels by using CEP paradigm.
Pedrinaci and Keynes [6]. A domain-independent engine is developed to compute metrics which help in assessing and improving a business process. In the study conducted by Ladan the inadequacies of the existing quality metrics of web services are indicated [7]. The authors stipulate that web service QoS metrics such as performance and availability are complex metrics which depend on many factors and cannot be defined using simple formulae. Another study by Del-R´ıoOrtega et al. emphasizes the need for defining appropriate Process Performance Indicators (PPIs) in order to evaluate an organisation’s performance [8]. The authors propose a metamodel known as PPINOT which helps in defining PPI’s in an unambiguous manner by technical as well as non-technical users. Wetzstein and Leymann define a metric model to measure KPI’s of a semantic business process using Ontologies [9]. Under the second category, Mayer et al. derive dependencies between metrics of a process, metrics of services invoked and metrics related to operations implementing the services based on functional dependencies between them [10]. The impact of processing time metric of a service operation on the execution time of a process is demonstrated with a university case study. The study by Her et al. accentuate the necessity for welldefined metrics that are precise and practical, which help in effective diagnosis of service performance [11]. Service response time metric is computed by summation of eighteen different metrics. The practicality of the approach is demonstrated with a hotel reservation case study. In yet another study [12] an approach for modelling of performance metrics for business processes implemented using BPEL is presented. An engine-independent event model is defined for collecting process performance metrics (PPM). PPM’s are categorised as instance and aggregate metrics. The authors also define cross-process metrics based on two process instances with varying process models. Leitner et al. ascertain correlation between high-level performance metrics and lowlevel infrastructure metrics for applications deployed on the cloud [13]. Low-level metrics are collected and aggregated into high-level application metrics based on CEP technology. Such metric dependencies are utilised for decision making to scale cloud infrastructure resources. A multi-level service monitoring framework which obtains event data of services deployed on the cloud is proposed in the study conducted by Baresi and Guinea [14]. The authors introduce a declarative language named mlCCL-Multi-layer Collection and Constraint Language which can be used to collect, aggregate and analyse the obtained data in order to identify performance deviations. From the existing studies in the area of defining metrics and deriving dependencies between them we see that there is a gap in defining and relating metrics for all the layers of a SBS. In this study we try to address these causes.
Related Work Related work can be considered under two categories: i) Defining metrics ii) Deriving dependencies between metrics. Under the first category, Repp et al. propose metrics based on transport layer parameters for timely detection of web service anomalies [4]. The authors emphasize the importance of obtaining web service performance information ahead of time by cross-layer analysis of the TCP-HTTP protocol stack rather than waiting for its propagation through the protocol stack. In the study conducted by Choi et al. a quality model for evaluating services from a consumer’s perspective is defined [5]. The authors define metrics for seven quality attributes of a service which are Availability, Performance, Reliability, Usability, Discoverability, Adaptability and Composability. With a case study the authors demonstrate the method of measuring the quality metrics. Metrics are defined using Ontologies which helps in analysis of the business process by
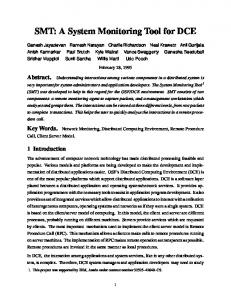
Case Study For the case study, we consider a Blood bank centre as a composite business process (figure 1) composed of activitiesBlood collection and Bar Coding, Testing and Validating, Reporting and Dispatching. Blood is collected from multiple donors and tested before it can be provided to the needy. It has to be tested for infections such as HIV, HBV, HCV, Malaria
3898
International Journal of Applied Engineering Research ISSN 0973-4562 Volume 11, Number 6 (2016) pp 3897-3904 © Research India Publications. http://www.ripublication.com and Syphilis. For such testing, automated computerised kits known as ELISA Processor and ELISA Reader are employed. The output provided by the ELISA Processor are input to the ELISA Reader which reads the intensity of reactions, plots the readings on a graph based on which results of the tests are determined. The results are expressed as positive (reactive), negative (non-reactive) or invalid. When the result cannot be determined from the graph it is considered as invalid. This could be due to numerous reasons such as contamination of the blood sample, improper storage and inaccurate functioning of ELISA Processor or ELISA Reader or handling by inexperienced technicians. Now we visualise the three layers of abstraction for the Blood bank composite business process as an SBA-The three activities-Blood collection and Bar Coding, Testing and Validating, Reporting and Dispatching can be visualised as the activities of BPM layer (figure 1). SCC layer consists of Sample Collection & Bar Coding Service, Preservation Service, ELISA Testing Service, ELISA Reader Service, Validation Service, Reporting and Billing Services. The SI layer constitutes the infrastructure such as computer systems for Billing and Reporting service, databases involved, ELISA Processor and Reader for performing the tests, Refrigerator for storing the blood samples, in-built plotter of the ELISA reader etc. There are several properties which the provider of the Blood Bank needs to monitor. 1. Once a Sample is collected, the result should be ready within 4 hours (BPM). 2. Specimen should be stored in the temperature range of 20C-80C (SI). 3. Determine the waiting time between collection of a sample and start of the test (BPM). 4. Time taken to generate the report after confirmation of the test result. (SCC). 5. Average time taken by Testing and Validation activity (BPM). 6. Count the number of times the output of the Testing device was positive (BPM). 7. Average execution time of the Blood bank process (BPM).
Metrics and Measurement A critical step in successfully managing execution of a business process is monitoring its performance and its adherence to requirements. Two key questions which help in effective monitoring of performance are: 1. What should be measured?-Establishing performance metrics aligned with business process objectives help us to identify components of the process and their attributes to be measured. 2. How to measure?-Instituting performance measurement procedures help in determining the means to obtain the measure. In this study we focus on (i) establishing effective, quantified performance metrics based on SMART criteria, aligned with business process objectives and (ii) requirements and procedure for measuring them. Metrics of a business process should be defined by considering how they help to access the status of the business process. The metrics or indicators that are to be defined for an SBA depend on requirements of the SBA compartmentalized into sub-requirements from each of the abstraction layer. We refer to any business activity, service or resource whose performance is to be measured as a monitored object. Multiple properties of a monitored object may have to be measured, with each property measured by a specific metric. Metrics that can be directly obtained by measuring a monitored object are Primitive metrics whereas those obtained by performing some calculations on primitive metrics data are known as Derived metrics. Layered Performance Indicator Model The metrics for the SBA can be categorised into i) Key Performance Indicators (KPI’s) ii) Process Performance Indicators (PPI’s) iii) Service Level Indicator (SLI’s) and iv) Service Infrastructure Indicators (SII’s) which help to assess performance and the causes of deviations of SBS (figure 2). A business process is accomplished by a sequence of activities in the BPM level. In-order to verify the total execution time of the business process, the execution time of each activity should be monitored in this layer. The metric that can be defined for the BPM layer known as P rocess P erformance Indicators (PPI’s) is the execution time of each activity and end-to-end total time of the business process. Each activity in the BPM level is realised by either a single service or a set of services in the SCC level. Hence in order to obtain execution time of each activity in the BPM level, the execution time of all the associated services should be observed in the SCC level known as Service L evel I ndicators (SLI’s). Hence execution time of each service becomes a metric in the middle level. To execute a service, a set of infrastructure is required which can be human resource or computational hardware and software. In case of human resource, metrics that can be defined are ‘Role’ responsible for executing a certain activity. In case of computational systems, metrics that can be defined are CPU utilisation, free Memory, temperature range etc.
Figure 1: Layers of abstraction of a SBA
3899
International Journal of Applied Engineering Research ISSN 0973-4562 Volume 11, Number 6 (2016) pp 3897-3904 © Research India Publications. http://www.ripublication.com known as Service Infrastructure L evel I ndicators (SII’s). KPI’s of the business process measure vital activities that indicate progress towards achieving strategic goals of the organization. PPI’s, are quantifiable metrics which are measured directly by data acquired from process instances during execution of a SBS. Some studies do not distinguish between KPI’s and PPI’s [15] whereas some consider PPI’s as a distinct form of goal based KPI’s. While PPI’s capture a single facet of a process, KPI’s help to gauge the success of the business process in its entirety. KPI-is a metric or a group of metrics that help to comprehend how the business process is performing against the objectives of an organisation. KPI’s are metrics, but not normal metrics. All metrics are not KPI’s. KPIs are built out of metrics which are in-turn created out of measures.
requirements (like CPU, memory) to execute the service, temperature range to be maintained, the role responsible for the execution of an activity etc. Table 2 presents metrics for the components of the infrastructure layer.
Table 1: Components of the Service Infrastructure Layer and their properties to be monitored
• • •
Properties Current Server load Current Available Memory on a Host Current memory usage of a Host Number of Process Instances Number of Service Instances
•
Temperature
• • • • •
Temperature Role Responsible for operation Memory Role Responsible for operation In-built Plotter characteristicsInk, Paper
Monitored Object Hosting Server
Application Server Specimen Storage Device ELISA Processor
ELISA Reader
• •
Table 2: Performance metrics for Service Infrastructure Layer Category Figure 2: Hierarchy of Performance Indicators
Metrics at Service Infrastructure Level Infrastructure Level Metrics are important as business processes and services involve human resource and technology (computer systems, application server and softwares). Examples for computer infrastructure metrics are Availability, Uptime, downtime, Memory available and CPU utilisation. Infrastructure Metrics also involve People metrics when manual activities are involved such as validation of results, approval of an activity and role responsible for executing an activity. SBA’s are usually executed on a computing node with constrained resources like processor and memory. The performance of the SBA is affected by the status of these resources such as average CPU load and available memory. The liveliness of the hosting server affects service availability and invocability. The states of these resources have to be monitored by the providers in order to ensure that the QoS values specified in the SLA are not violated. Table 1 presents the possible components of the infrastructure layer and their properties. The elements of the service infrastructure to be monitored are resources such as computer systems which host the service, automated devices which provide services such as Bar-Code Readers, RFID Readers, Printers, Testing Kits, ELISA Processor & Reader, Specimen Storage devices and people responsible for performing a service. The properties of the elements to be monitored are: minimum hardware
Hosting Server-DI
Metric Name Processing load
CPU-DI
CPUUsage
Unit
Description
Memory-DI Free Memory
Percentage Percentage of time spent on User activity Percentage of CPU time spent on execution of a Service Percentage/ Free memory MBytes available
Memory Usage
Memory consumed by a Service
Percentage • Number of Process Instances • Number of Service Instances Temperature Celsius Room temperature ELISA in which the ELISA Processor-DS processor is operated Temperature Celsius Temperature for Specimen storing Specimens Storage-DS Application Server-DI
Processing load
Qualified Manual Technician /Human DI-Domain Independent, DS-Domain Specific
3900
International Journal of Applied Engineering Research ISSN 0973-4562 Volume 11, Number 6 (2016) pp 3897-3904 © Research India Publications. http://www.ripublication.com Metrics at Service Composition Level Service Composition Layer consists of a set of services responsible for accomplishing each activity of the business process layer. The components that are to be observed in this layer are-each service that is invoked and its i) time-based properties such as time of invocation, time of completion and total execution time; ii) data related properties such as output value of a service or the output graph of a ELISA Reader service. Table 3 details the objects of the SCC layer and their properties to be monitored. Table 4 presents performance metrics of service composition layer. Table 3: Components of the Service Composition Layer and their properties. Monitored Object Service-DI
Properties • Memory Required • Memory Consumed • Processor Time • Number of Instances • Execution Time • Temperature Range
Specimen Storage Device-DS ELISA Processor-DS • • • • ELISA Reader-DS • • • • •
service completion event and the service invocation event. Before a service can be invoked there might be some delay such as queuing delay and setup delay [16]. Queuing delay refers to the time dissipated waiting in a queue. For e.g. in the case of HIV blood test, queuing delay refers to the time spent waiting for enough number of samples to arrive before the task can be executed. Setup delay refers to the time expanded in loading samples into the wells, calibrating the device, checking the internal/external controls etc. ii. Derived metrics-also known as Aggregated or Numerical Metrics-of a service provide the summarized information of a service over a period of time that can be utilized to evaluate the overall performance of the service. E.g.: average execution time, Number of times deviation in execution time observed, Number of times result was invalid, Number of times output was not reliable. Metrics at Business Process Level The business process workflow is a combination of multiple activities to accomplish the business task. The components to be monitored at this level are activities and the process as shown in Table 5. In order to compute the execution time of any activity, the timestamp of the events Activity_Start_Event and Activity_End_Event of each activity has to be observed. Table 6 presents performance metrics of the business process layer.
Time Consumed Output Result Setup Time Delay Time Time Consumed Graph output Plotter Ink Memory Available Memory Consumed for storing the result readings
Table 5: Components of the Business Process Layer and their properties. Monitored Object Properties • Process Execution Time Process • Number of Instances • Set of Activities Activities • Activity Execution Time • Role Responsible
Table 4: Performance metrics for Service Composition Layer Category Metric Unit Description Name Execution Seconds Time taken to complete a Service service execution calculated Execution Time by (Service_End_EventTime-DI Service_Start_Event) Elapsed The elapsed time of the Time invoked service Delay Time
Throughput Service Output-DI Rate Reliability
Table 6: Performance metrics for Business Process Layer Category Process Execution Time-DI
The time expended before execution of a service, which can be fragmented into queuing delay and setup time of the service Number of successful service instance over time Number of requests made to the service Number of times service output was valid over the total number of requests
Activity Execution Time-DI
i. Primitive Metrics-Execution Time of each service is calculated by the difference in timestamps between the
3901
Metric Unit Description Name End-toSec/min/hr The total time taken to End Time complete the business process calculated based on the workflow structure. Elapsed The time since the Time process was invoked (started execution) Reliability Number of times process output was appropriate Execution Sec/min/hr Time taken to complete Time an activity execution calculated by sum of execution time of each service in the activity Elapsed The elapsed time of the Time invoked activity
International Journal of Applied Engineering Research ISSN 0973-4562 Volume 11, Number 6 (2016) pp 3897-3904 © Research India Publications. http://www.ripublication.com DI-Domain Independent, DS-Domain Specific The total execution time of the business process is calculated based on the workflow pattern [15]. For a sequential pattern (figure 3) the business process execution time is the sum of execution time of each service in the composition.
causality between events. CEP technology is equipped with tools and techniques for handling such problems. It helps users to define and utilise relationships between events in realtime. Event Processing Language (EPL) is a language similar to SQL for processing stream of data arriving during execution. Unlike SQL where queries are executed against the stored data, EPL stored queries are automatically triggered against the arriving continuous stream of event data. An approach for obtaining the metrics from the events published during execution of the SBA may be represented as in Figure 5. The Event, Metric and Indicator classes are defined below:
≤
Definition 1 - Event is defined as a tuple (EN, EId, ET) where: • EN is the name of the event, • EId is the event identifier, • ET indicates the time stamp when the event occurred,
Figure 3: Sequential Pattern The execution time of the parallel path is the execution time of the service which takes maximum time to complete (figure 4). Therefore the total execution time of the business process is T (Sa) + Max i ∈ {1... n}{T(Si)} + T (Sb).
An event is characterised by a name, identifier and timestamp of its occurrence. Taxonomy of the events that may occur in the layered SBA is shown in figure 6. Invocation of a service triggers Service_Start_Event and completion of an event triggers Service_End_Event. Similarly as soon as a process is started triggers the Process_Start_Event and its completion Process_End_Event. Infrastructure events such as Memory_Status, CPU_Load and Temperature values are sampled from the resources at regular intervals.
Figure 4: Parallel Pattern
Metrics Measurement using CEP The metrics model created during design-time should be deployed to the monitoring infrastructure and the metric values of the business process have to be measured during run-time. Important points that have to be considered during collection of data from a system being monitored are: i) NonIntrusiveness-this characteristic helps to identify the degree of invasiveness of the CEP code with the SBA to obtain the metrics ii) the overhead involved in extracting the metrics-as such monitoring logic requires computational resources (memory, CPU etc.), the cost of resources should not outweigh benefits obtained from monitoring. Our monitoring framework uses complex event processing technology (CEP) which helps in collecting data in real-time to calculate higher-level metrics based on data obtained from low-level metrics [17]. Event is an occurrence of something which is important to the system under consideration. The basis for obtaining metric value is to treat events as first-class citizens in an SBA which help in collection and recording of events generated at run-time. Before the concept of CEP was instituted, whenever a cause for a deviation had to be determined, a huge amount of log files had to be explored. There was no means to determine the
Figure 5: Metrics obtained from events during execution of SBA
Figure 6: SBS Event Hierarchy Below is an example of the EPL statement that logs the timestamp of the 'Service_Start_Event' when service ELISA Testing Service of process P1 is invoked. Select SL.serviceid=' ELISA_Testing_Service’, SL.processid, SL.event_timestamp from
3902
International Journal of Applied Engineering Research ISSN 0973-4562 Volume 11, Number 6 (2016) pp 3897-3904 © Research India Publications. http://www.ripublication.com com.espertech.esper.example.epsr.eventbean.Service_Log.win :time(30 min) as SL where SL.serviceid=' ELISA_Testing_Service' and SL.processid=’p1’ and SL.event_type='service_start_event';
Values of some performance indicators will have to be obtained by aggregation or by applying some statistical functions to the obtained metrics. For e.g. Values of the requirements 5-7 as stated in Case Study section, are stored as performance Indicator Values in a repository. The metric and the performance indicator values obtained from the CEP statements are stored in metric repository for later analysis. Below is the EPL query for requirement 5-Find the average execution time of the activity Testing and Validation-The time taken for Testing and Validation activity is the summation of execution time of three service-ELISA Testing Service, ELISA Reader Service and Validation Service. This highlevel BPM metric is obtained by aggregation of the lowerlayer execution time metric of the SCC layer. The query gives average execution time of the activity Testing and V alidation for the last 8 hours. Insert into performance_indicator Select A. processid, A.activityid,sum(A. event_timestamp-B. event_timestamp) as exc_time, ‘activity exec time’ as metric, current_timestamp.format() current_time from com.espertech.esper.example.epsr.eventbean.Service_Log(eve nt_type='service_start').win:time(30 min) as A, com.espertech.esper.example.epsr.eventbean.Service_Log(eve nt_type='service_end').win:time(30 min) as B where A.processid=B. processed AND A. serviced=B. serviced AND A.processid=’p1’ and A.activityid=’ Testing and Validation’; Select avg(exc_time) avg_exec_time from metrics.win:time(8 hr) where A.activityid=’Testing and Validation’ and metric=’ service exec time’ ;
Definition 2 - Metric is defined as a tuple (MN, MId, V, U, MT, OId) where: • MN is the name of the metric, • MId is the metric identifier, • V is the Value of the metric, • U is the unit of the metric ∈ (percentage, integer) • MT indicates the time stamp when the value was obtained, • OId refers to the monitored object which yields the metric ∈ (Process, Service, Node) Each metric is obtained by a Measure function which is a CEP statement that yields the value of the metric. One or more events may be required for the reckoning of a Metric. For e.g. the Service_Execution_Time metric is obtained by computing the difference between the timestamp of the events Service_End_Event and Service_Start_Event. The PPI metrics are the metrics related to the BPM layer. The metric we consider at this level are Process_Execution_Time, the value for this primitive metric can be obtained by tracking the events Process_Start_Event and Process_End_Event. Process_Execution_Time metric can also be obtained as a derived metric by computing the sum of execution time of each service in the SCC layer. This is an example of obtaining the higher level metric Process_Execution_Time by aggregating the Sevice_Execution_Time metric from the lower SCC level. Similarly, the SLI metrics are Service_Execution_Time and Progress_Status. PPI metric Service_Execution_Time is obtained by finding the difference in timestamps of the monitored events Service_Start_Event and Service_End_Event calculated by (Service_End_TimeService_Star_ Time). The SIL metrics are Server_Availability, free_memory_available, Temperature and CPU_Load. These values are sampled at pre-defined intervals and stored in the repository. Below is the EPL query which finds the execution_ time metric for the Report generation service. Insert into metrics Select A.serviceid, A. processid, A.activityid, (A. event_timestamp-B. event_timestamp) as exc_time, ‘service exec_time’ as metric, current_timestamp.format() current_time from com.espertech.esper.example.epsr.eventbean.Service_Log(eve nt_type='service_start').win:time(30 min) as A, com.espertech.esper.example.epsr.eventbean.Service_Log(eve nt_type='service_end').win:time(30 min) as B where A.processid=B. processed AND A. serviced=B. serviceid AND A.serviceid=' Report generation ' and A.processid=’p1’
Implementation A Business process can be defined using modelling languages like BPMN 2.0i and executed using engines like Activiti or Cammunda. The extensions provided by Cammundaii engine known as Execution Listeners are configured to capture events from BPM and SCC layer. The resource details of the hosting server such as available memory and CPU utilisation are obtained by sampling the values at pre-defined intervals using Sigariii APIs. The metric and indicator values have to be obtained dynamically from the SBS during execution without interrupting its normal operations. The events are gathered by instrumenting the BPMN process with Execution Listeners which call the Java code when the registered events are triggered. Open source Esper CEP engineiv and Event Processing Language (EPL) are used to process the events. Esper can handle large volume of events both in real-time and also from historical logs. Below we provide some example EPL queries for obtaining metrics. 1. Display the number of times ‘Validation S ervice’ has exceeded the SLA execution time. Select count(A.serviceid) from com.espertech.esper.example.epsr.eventbean.metrics.win:time (8 hr) as A, com.espertech.esper.example.epsr.eventbean.Threshold.win:ti me(30 min) as B where A.serviceid=B.serviceid and
Definition 3 - Indicator is defined as a tuple (IN, I Id, I V, I T) where: • IN is the name of the metric, • PId is the identifier for the indicator, • IV is the value of the indicator, • IT indicates the time stamp when the value was obtained.
3903
International Journal of Applied Engineering Research ISSN 0973-4562 Volume 11, Number 6 (2016) pp 3897-3904 © Research India Publications. http://www.ripublication.com A.exc_time>B.threshold_value and A.serviceid=' Validation Service'; 2. Find the average execution time of the Blood testing business process-KPI Metric. This higher level metric is obtained by first calculating the end-to-end execution time of each business process instance which is an aggregation of execution time of each activity/service; this is followed by finding the average of the end-to-end time of multiple instances of the process. Insert into process_log Select sed.processid, sum(exec_time) as total_exec_time, sed.captured_date from service_exec_details sed Where sed.processid=’bp1’ And sed.captured_date > ( current_timestamp.minus (1000*60*24)) Select avg(total_exec_time) from process_log where captured_date > (current_timestamp.minus (1000*60*24)) 3. Display average CPU utilisation over a 2 minutes time window once in 30 seconds when it exceeds 75% threshold. Select avg(resource_value) from pattern [ every com.espertech.esper.example.epsr.eventbean.Resource_Log.w in:time (2 min) (resource_property='cpu_utilization' and resource_value > 75 and serviced=’s1’ and nodeid=’n1’) where timer:interval(30 sec) ]
[6]
[7]
[8]
[9]
[10]
[11]
Conclusion This study presents a novel and generic approach for efficient and dynamic collection of metrics from a layered ServiceBased Application. The method for defining metrics is based on categorising them into various levels of abstraction. The technique to obtain metrics from all levels is based on CEP paradigm which is non-invasive with the code of the SBS and does not introduce any overhead to the SBS under consideration.
[12]
[13]
References [1]
[2]
[3]
[4]
[5]
[14]
D. Flint and F. Buytendijk, “How BAM Can Turn a Business Into a Real-Time Enterprise,” AV-15-4650, no. March. 2002. R. Kazhamiakin, P. Marco and A. Zengin. "Cross-layer adaptation and monitoring of service-based applications." In Service-Oriented Computing. ICSOC/ServiceWave 2009 Workshops, pp. 325-334. Springer Berlin Heidelberg, 2010. A. Shahin and M. A. Mahbod, “Prioritization of key performance indicators: An integration of analytical hierarchy process and goal setting,” Int. J. Product. Perform. Management., vol. 56, no. 3, pp. 226-240, 2007. N. Repp, R. Berbner, O. Heckmann, and R. Steinmetz, “A Cross-Layer Approach to Performance Monitoring of Web Services,” In Emerging web services technology, pp. 21-32, 2007. S. W. Choi, J. S. Her, and S. D. Kim, “Modeling QoS Attributes and Metrics for Evaluating Services in SOA Considering Consumers ’ Perspective as the First Class
[15]
[16]
[17]
Requirement,” in 2007 IEEE Asia-Pacific Services Computing Conference, pp. 398-405, 2007. C. Pedrinaci and M. Keynes, “Ontology-based Metrics Computation for Business Process Analysis.”, Proc. of the 4th International Workshop on Semantic Business Process Management, pp. 43-50. ACM, 2009. M. I. Ladan, “Web Services Metrics : A Survey and A Classification,” in 2011 International Conference on Network and Electronics Engineering IPCSIT, vol. 11, pp. 93-98, 2011. A. Del-R´ıo-Ortega, M. Resinas, C. Cabanillas, and A. Ruiz-Cort´es, “On the Definition and Design-Time Analysis of Process Performance Indicators,” Information. Systems., vol. 38, no. 4, pp. 470-490, 2012. B. Wetzstein and F. Leymann, “Towards Measuring Key Performance Indicators of Semantic Business Processes,” pp. 227-238, In Business Information Systems, pp. 227-238. Springer Berlin Heidelberg, 2008. C. Mayerl, K. M. Huner, J.-U. Gaspar, C. Momm, and S. Abeck, “Definition of Metric Dependencies for Monitoring the Impact of Quality of Services on Quality of Processes,” 2007 2nd IEEE/IFIP Int. Work. BusinessDriven IT Manaement., pp. 1-10, May 2007. J. S. Her, S. W. Choi, S. H. Oh, and S. D. Kim, “A Framework for Measuring Performance in ServiceOriented Architecture,” Third International Conference on Next Generation Web Services Practices, pp. 55-60, 2007. B. Wetzstein, S. Strauch, and F. Leymann, “Measuring Performance Metrics of WS-BPEL Service Compositions,” 2009 Fifth Int. Conf. Networking Service, pp. 49-56, 2009. P. Leitner, C. Inzinger, W. Hummer, B. Satzger, and S. Dustdar, “Application-level performance monitoring of cloud services based on the complex event processing paradigm,” 2012 Fifth IEEE Int. Conf. Service-Oriented Computing and Applications (SOCA), IEEE, pp. 1-8, 2012. B. Luciano and S. Guinea. "Event-based multi-level service monitoring." 2013 IEEE 20th International Conference on Web Services (ICWS), IEEE, pp. 83-90, 2013. M. Christof, M. Gebhart, and S. Abeck. "A modeldriven approach for monitoring business performance in web service compositions." Fourth International Conference on Internet and Web Applications and Services, ICIW'09. IEEE, pp. 343-350, 2009. J. Cardoso, A. Sheth, J. Miller, J. Arnold, and K. Kochut, “Quality of service for workflows and web service processes,” Journal of Web Semanics., vol. 1, no. 3, pp. 281-308, 2004. Luckham, David. The power of events. Vol. 204. Reading: Addison-Wesley, 2002.
i http://www.omg.org/spec/BPMN/2.0/PDF ii https://camunda.com/ iii https://support.hyperic.com/display/SIGAR/Home iv http://www.espertech.com/esper/
3904