Alexander J. Probst, Pek Yee Lum, Bettina John, Eric A. Dubinsky,. Yvette M. Piceno ...... Gilbert, J.A., Steele, J.A., Caporaso, J.G., Steinbruck, L.,. Reeder, J.
Microarrays
Current Technology, Innovations and Applications
Edited by Zhili He Caister Academic Press
Chapter from:
Microarrays
Current Technology, Innovations and Applications Edited by Zhili He ISBN: 978-1-908230-49-2 (hardback) ISBN: 978-1-908230-59-1 (ebook)
Single user only. This chapter must not be reproduced, copied, stored in a retrieval system, or distributed by any means, electronic, mechanical, photocopying, email, internet or otherwise. © Caister Academic Press
Microarray of 16S rRNA Gene Probes for Quantifying Population Differences Across Microbiome Samples
5
Alexander J. Probst, Pek Yee Lum, Bettina John, Eric A. Dubinsky, Yvette M. Piceno, Lauren M. Tom, Gary L. Andersen, Zhili He and Todd Z. DeSantis
Abstract Deciphering microbial communities and their role in Earth’s biosphere is crucial for addressing challenges in human health, agriculture, bioremediation and other natural processes. While next-generation sequencing platforms are still under development to improve accuracy, read length and sequencing depth, microarray-based methods have become an attractive alternative for 16S rRNA gene microbial community comparisons. The hybridization method is well-established in the laboratory. Thus, main areas of improvement lie with the development of enhanced bioinformatics and statistical procedures for microarray data, rather than with improvements to the platform itself. In this communication we applied recently-developed bioinformatics tools to re-analyse G3 PhyloChip™ DNA microarray data acquired from deep ocean samples collected during the 2010 Deepwater Horizon oil spill in the Gulf of Mexico. We show that data collected with the G3 PhyloChip assay can be analysed at various stages of resolution, from individual probes to pairs of probes to quartets of probes and finally at the commonly used probe-set level where each probe-set is associated with one operational taxonomic unit (OTU). Our analysis methods comprised topological data analysis (TDA) to facilitate the detection of outlier bio-specimens and the reconstruction of empirical OTUs (eOTUs) in an unsupervised manner, without the need for pre-defined reference OTUs (rOTUs). We observed that the quartet level provided sufficient resolution for identifying a subtle outlier sample with TDA, while the eOTU reconstruction was useful for
annotation of the taxa associated with significant population changes in the elevated hydrocarbon waters. The presented methods will improve the deduction of important biological processes from G3 PhyloChip experiments. Introduction Microorganisms represent the greatest biomass of Earth’s biosphere. They have the largest metabolic variety of all organisms and consequently contribute profoundly to carbon, nitrogen, sulfur and phosphorus cycling on the planet (Falkowski et al., 2008). These cycles are necessary to maintain life across all kingdoms, support environmental homeostasis by bioremediation of pollutants, and process nutrients in the human gut as examples. In their natural habitat, microorganisms have been shown to act as a community rather than as monospecies with independent metabolism, although some exceptional cases have been posited (Chivian et al., 2008). Communities are assemblages of tens to thousands of species, whose individual populations fluctuate based on changes in local stimuli. Thus far, we have incomplete knowledge of community dynamics and the impact on metabolic networks, since microbiologists have mostly studied microbes under artificial laboratory conditions where typically single strains of bacteria or archaea are monitored. The diversity of strains observed in a laboratory is limited by our knowledge of nutrient, temperature, and atmospheric needs of a given organism. Consequently, it is not surprising that the number of microorganisms that can be cultured under artificial laboratory conditions was estimated to be only 1% of all bacteria
100 | Probst et al.
and archaea that had been discovered via cultureindependent molecular techniques (Amann et al., 1995; Colwell, 1997). Recent metagenomic studies, however, increase the discovery of biological dark matter and help illuminate uncultured microorganisms (Castelle et al., 2013; Marcy et al., 2007; Rinke et al., 2013; Wrighton et al., 2012). A recently documented example of uncultured archaea and bacteria interdependence is the metabolic pathway of anaerobic methane oxidation. Here, archaea are able to oxidize methane, which is found in high amounts in the deep ocean, because of the exergonic redox potential produced by bacteria through active sulfate reduction (Moran et al., 2008; Orphan et al., 2001). Neither of the two organisms has been grown in pure culture under laboratory conditions because of their strong interdependence via synthophy (Morris et al., 2013). Based on the low cultivability of most microbes and their interdependence as a community, examining all microorganisms’ population dynamics simultaneously, or tracking the whole microbiome, in the natural environment or within clinical studies is desirable. The urgency of applying whole-microbiome methods is growing as diseases have become linked to the microbiome (Cho and Blaser, 2012). Determination of the microorganisms undergoing population changes in response to a stimulus is the primary step in the elucidation of metabolic interactions within a community. For example, renal disease is known to raise systemic urea and was hypothesized to influence nitrogen metabolic flux in the gut mucosal environment. As a first step in mapping the microbial enzymatic pathways consequently up-regulated, populations of all known bacteria were profiled from faeces of uraemic patients and compared to control patients to determine the significantly increased populations within Halomonadaceae, Moraxellaceae, Polyangiaceae and other families (Vaziri et al., 2013). The field of microbial ecology aims to understand microorganisms in their natural habitat and how they interact with biotic (e.g. other organisms) and abiotic factors (e.g. temperature). Similar to all branches of ecology, microbial ecology collects data on population shifts in order to propose hypotheses towards further understanding their
mechanisms. Some examples to date include the study of healthy and diseased states as investigated by the Human Microbiome Project (Wortman et al., 2010), between wild type and knock-out mice (Frantz et al., 2012; Noval Rivas et al., 2013), between soils in dissimilar biomes as investigated by the Earth Microbiome Project (Gilbert et al., 2010a,b) and between contaminated and pristine waters as investigated by bioremediation scientists (Dubinsky et al., 2012; Lin et al., 2006). The most useful techniques are those that provide reproducible detection of population changes across a diverse range of all known bacteria. Furthermore, those techniques should not be limited to monitoring only the dominant populations, but should be sensitive to shifts in minority populations as well, since some microbes are 10,000-fold less abundant than majority members. The method employed in thousands of published manuscripts to collect data on population dynamics is the amplification, classification and quantification of 16S rRNA genes from an entire community. The 16S rRNA gene with its nine hyper-variable regions spread over approximately 1.5 kb is ideal for straightforward amplification using primers that flank the hyper-variable spans. Typically, the amplification step creates over 1 µg of amplicons comprising 10 billion to a trillion double-stranded DNA molecules. The base sequence differences allow taxonomic identification (DeSantis et al., 2006). The quantities of each taxa-specific amplicon can be compared across patient groups, biomes, etc. Initial enumerations with cloning and sequencing of the 16S rRNA gene amplicons sampled tens to thousands of molecules per specimen (as an example see Radosevich et al., 2002). Later, massive parallel amplicon sequencing, or next-generation sequencing (NGS) popularized by Roche and Illumina platforms, allowed molecular barcoding of multiple biospecimens followed by inexpensive clone-less sequencing of multiple biospecimens that simultaneously enabled the routine sampling of 10K to 100K short 16S rRNA molecules per specimen ( Jumpstart HMP Consortium, 2012). By 2006 general NGS optimism was at its peak due to a series of successful shotgun genome sequencing projects where short overlapping reads were assembled into a consensus genome
PhyloChip Analysis of Disparate Microbiomes | 101
(Moore et al., 2006). The optimism was extended to 16S applications with the assumption that sequencing quality, lengths, and depths would continue to improve so that in standard production individual reads could reliably be associated with specific taxa. In fact, it was demonstrated in silico that short 250 base subsegments of Sanger-derived 16S rRNA genes could allow identification of many genera (Liu et al., 2008) and it was expected that real NGS reads would perform similarly. As NGS 16S rRNA gene sequence data sets were published, the limitations of NGS protocols became better understood. As commonly practised, barcoding and multiplexing samples in cost-saving work-flows results in both (1) barcode biases, where perceived community structure could be influenced by the barcode assigned (Alon et al., 2011; Berry et al., 2011) and, (2) non-uniform sampling depth, where some samples within a multiplexed experiment are sampled at only ~1/10th to ~1/100th as thoroughly as other samples (HMP Consortium, 2012b), creating difficulties in comparative metrics of alpha-diversity. Currently, it is not expected that NGS results would be reproducible for the human microbiome or other complex communities (Zhou et al., 2011, 2013), both due to the limitations of sequencing only thousands to millions of reads out of the billions generated (Caporaso et al., 2012b; Haegeman et al., 2013) and due to base-calling errors not explained by quality scores making individual bases or read segments difficult to filter (Engelbrektson et al., 2010; Kunin et al., 2010). Diversity, or specifically richness, is largely inflated by the NGS technique itself (Kunin et al., 2010; Quince et al., 2009; Reeder and Knight, 2009) adding unverifiable ribotypes to compositional data. High numbers of chimeras are created but are difficult to identify (Edgar et al., 2011; Haas et al., 2011) and the filtering stringency affects alpha-diversity. The previously held assumption that 16S rRNA NGS allowed a true representation of the community structure (percentage of community attributed to each taxon population) within a sample has now been called into question since the comparison of the same 21 member ‘even’ mock community (HMP Consortium, 2012a) processed through both
Roche and Illumina platforms gave surprisingly different perceptions of what organisms dominated the community. For example, depending on the protocol, Staphylococcus aureus was perceived as comprising from 2.8% to as much as 50.1% of genomic DNA where a known proportion of approximately 5% was prepared (Edgar, 2013). This unsettling recent report will surely generate further mock community experiments and protocol refinement since it was based on gDNA preparations in separate laboratories, which may contribute to the unexpectedly high 17-fold variation. Since NGS readings of 16S rRNA gene amplicons do not produce an unambiguous documentation of the underling community, results should be interpreted only in comparisons to samples processed with the exact same protocol. In 2010, the third generation of broadspectrum phylogenetic microarrays, the G3 PhyloChip, was introduced to the field of environmental microbiology (Hazen et al., 2010). Prior to this, the second generation, or G2 PhyloChip (DeSantis et al., 2007) had been applied to the study of urban aerosols (Brodie et al., 2007), clean room environments (Probst et al., 2010), CO2 elevated soil communities (He et al., 2012) and various human clinical samples (MaldonadoContreras et al., 2011; Saulnier et al., 2011). G2 PhyloChip probes were designed to complement only the sense strand of the contemporary knowledge base of sequences (DeSantis et al., 2006). The G3 chip is preferred over the G2 due to the broadening of 16S rRNA gene sequence diversity uncovered in recent years (McDonald et al., 2012). Compared to the second generation of the PhyloChip, the G3 contains a greater diversity of probes complimenting both strands, sense and anti-sense, of 16S rRNA gene sequences for greater sensitivity to population dynamics across diverse taxa. The array comprises a square grid of 1,016,064 features containing 994,980 different probes complementing all known taxa, cultured and yet-to-be-cultured, within both the Archaea and Bacteria. It contains mis-matching probes that serve as controls for each complementing probe and replicate probes for internal assessment of signal variation (Hazen et al., 2010). The PhyloChip approach overcomes many of the NGS difficulties by separating each
102 | Probst et al.
biospecimen on physically separate arrays, eliminating barcode biases and avoiding nonuniform sampling depth otherwise introduced by multiplexing. The most attractive feature of the PhyloChip approach is the ability to expose up to 1 trillion amplicons to the probes. Since the probes are spatially separated, data are collected from each probe in each experiment, allowing minority community components to be measured. It is impossible in the foreseeable future for NGS workflows to take routine measurements on the minority components since typically ~1 million (which is only 1 millionth of 1 trillion) or fewer molecules are represented in the data. The ability of the PhyloChip G3 array to track changes in bacterial and archaeal abundance was evaluated using a latin-square quantitative design with 26 different microbial species mixed in 26 randomized concentration levels from 1× to 0.0005×, replicated three times on different days. Technical variation, or the variation in replicate measurements for the identical probe sequence, was low (CV = 0.097) and the correlation between analyte concentration and fluorescence signal was high (r = 0.941) (Hazen et al., 2010), indicating that the PhyloChip G3 is reproducibly sensitive to changes in microbial abundance within complex samples across four orders of magnitude. So far, the PhyloChip G3 has been successfully used on samples of a great variety of different biotopes, such as human microbiome (Renwick et al., submitted), sulfidic freshwater springs (Probst et al., 2013), low biomass clean room environments (Cooper et al., 2011; Vaishampayan et al., 2013), animal models of disease (Lam et al., 2012; Miezeiewski et al., submitted), high-altitude bioaerosols (Smith et al., 2013), coral reefs (Kellogg et al., 2012, 2013), citrus plant leaves (Zhang et al., 2013), hot springs (Briggs et al., 2013), wastewater treatment reactors (Wang et al., 2013), biofuel reactors (Wu and He, 2013), and soils (Ding et al., 2013; Hayden et al., 2012; Mendes et al., 2011). The first published G3 study examined water samples from the Gulf of Mexico during the Deepwater Horizon oil spill (Hazen et al., 2010), one of the greatest environmental catastrophes in the history of the production and conversion of fossil fuels. Approximately 4.1 million barrels of oil were released into the Gulf of Mexico between
April and July 2010, which comprised a variety of liquid hydrocarbons (saturated, aromatic and polar) and gaseous components (Camilli et al., 2010; Hazen et al., 2010; Kessler et al., 2011; Reddy et al., 2012; Valentine et al., 2010). From a microbiological perspective, the catastrophe has been studied with many different tools including metagenomics and metatranscriptomics to understand its effects on the natural environment of the ocean (Baelum et al., 2012; Dubinsky et al., 2013; Hazen et al., 2010; Mason et al., 2012; Redmond and Valentine, 2012; Rivers et al., 2013; Valentine et al., 2010). In this book chapter, we re-analysed PhyloChip G3 data collected during the Deepwater Horizon oil spill using a novel bioinformatics technique as well as a topology-based approach called TDA (Lum et al., 2013). Rather than using probe-sets complimenting database reference-based OTU, or ‘rOTU’, scoring (Hazen et al., 2010), we employed a detailed, non-OTU, probe-by-probe approach as well as an empirical approach to define OTUs, or ‘eOTUs’, using taxonomically related probes highly correlated in observed fluorescence intensity (FI) across samples. We also present two intermediate pipelines and their effects on outlier determination and biological interpretation. Moreover, the metadata for each sample is utilized to find significant influences of environmental factors on the microbiome structures observed. The analysed dataset was acquired from 17 samples, 10 taken within and 7 outside the oil plume generated from the rupture point. The analysis methods herein are presented as a resource for microbial community ecologists and bioinformaticists when considering the benefits of low-level versus high-level data analysis. We present the benefits of probe-level analysis for finely separating samples into subgroups and the benefits of probe-set level analysis for taxonomic annotation of population dynamics. PhyloChip G3 data analysis PhyloChip data are compact and rich in information According to current standard protocols, 500 ng of PCR product are amplified from one sample,
PhyloChip Analysis of Disparate Microbiomes | 103
fragmented and hybridized onto a single array. Assuming an average GC content of 54% (based on the entire Greengenes database release August 2012) and approximately 1465 bp amplicons of the 16S rRNA gene, 3.3 + E11 molecules are assayed with one single array, which is at least one hundred times more molecules compared to even the deepest sequencing technologies such as dedicating an entire run of 16 lanes and two flow cells in an Illumina HiSeq 2000 (http://www. illumina.com/systems/hiseq_comparison.ilmn; Table 5.1). As far as the authors are aware, no sequencing facility is operating at this depth for routine 16S rRNA amplicon analysis. Moreover, the raw data of one single PhyloChip uses only 26 Mb of storage, which converts to approximately 8 × 10−5 bytes per molecule assayed (Table 5.1). In comparison to data from platforms that are based on 16S rRNA gene sequencing, microarray data is compact, easy to move across data networks, and rich in information, making the PhyloChip technology suitable for high-resolution microbial community profiling. In the analysis steps presented in the following sections, the data is examined as (1) single probes, (2) probe-pairs, (3) sense and antisense pairs combined as probequartets and (4) as larger sets of probes associated with an eOTU (= taxonomically classified set of probes). We demonstrate that the compact microarray data is well-suited to data mining and elucidates microbial community changes at all four resolutions. Sinfonietta for empirical OTU discovery Previously, PhyloChip probe florescence from samples collected from the Deepwater Horizon oil spill (Hazen et al., 2010) was compared to approximately 60,000 bacterial and archaeal
reference OTUs spanning the entire Greengenes database (DeSantis et al., 2006). The analysis method presented at that time, termed ‘PhyCA’, was restricted to these pre-defined OTUs and pre-defined sets of probes for each OTU. In the method presented here, termed Sinfonietta, the probes are placed into probe sets after the data is collected, coupling the microarray’s sensitivity to shifts in abundance with exploring microbial communities beyond a reference database. In Sinfonietta, the empirical finding of eOTUs is a multi-stage process. The first stage of pixel summarization of the florescent image, background subtraction, noise estimation and array scaling were conducted as previously described (Hazen et al., 2010). Array fluorescence intensity (FI) of each pixel in an image was collected as integer values ranging from 0 to 65,536 providing 216 distinct FI values. The summary of FI for each single probe feature on the array was calculated by ranking the FI of the central 9 of 64 image pixels and using the value of at 75th percentile. Background was defined as the mean feature FI in the least bright 1% of features in each of 25 equally divided sectors of the image. The background was subtracted separately in each sector. Next, all probes on the array were scaled by multiplication with a single factor so that average FI of the probes perfectly matching the non-16S spike control mix were equal. The Sinfonietta method provides the options to evaluate the probes, probe-pairs, probequartets and/or probe-sets (eOTUs). In the least summarized option, values from redundant probes were averaged, and then all values were log2-transformed to generate the simple probelevel table representing the responses of 994,980 probes across 17 samples. Pairs of probes are two probes with similar but non-identical sequences
Table 5.1 Comparison of data and information storage of different community profiling platforms Feature
PhyloChip G3
454 GS FLX+
Illumina HiSeq 2000 (paired-end)
Illumina MiSeq (paired-end)
Number of molecules assayed
3.30 × 10¹¹
1.00 × 10⁶
3.00 × 10⁹
1.00 × 10⁷
Disc space required of raw data in Gigabytes
0.025 GB
0.7 GB
30 GB
10 GB
Disc space per molecule assayed in Bytes
8.26 × 10⁻⁵
7.34 × 10⁴
1.07 × 101
1.07 × 10³
104 | Probst et al.
which align along ≥23 bases with ≥1 mismatch or gap as determined by blastn (Altschul et al., 1990) (-word_size 8 -dust no -perc_identity 92 -evalue 0.005 -penalty −1). Although all probes can produce minor fluorescence from non-specific hybridization, if a sequence-specific hybridization has occurred the probe complementing the target will be brighter than its mis-matching mate as has been observed in 70% of controlled experiments using pairs (Furusawa et al., 2009). As a general caution, perfect matching probes (PM) were considered positive if they fulfilled the following criteria in comparison to their corresponding mis-matching probes (MM). (A) PM/MM≥1.5, (B) PM-MM≥50*N and r≥0.95, where N is the array specific noise, and r indicates the response score (Hazen et al., 2010). In total, the FI values for 32,011 pairs passed these thresholds in three or more samples. To invoke greater stringency, the two strands of the double-stranded PCR products were leveraged to remove pairs if both sense pairs and anti-sense pairs (collectively termed a probequartet) did not pass the above criteria. Of the 32,011 pairs, 20,891 passed the quartet filter. Within-sample ranked FIs of PM probes from the 20,891 probe-quartets were then used for empirical probe-set discovery. Individual probes were clustered into probe-sets by correlating the ranked FI across all samples and by taxonomic relatedness. In cases where multiple solutions were possible, higher correlation coefficients were preferred over lower correlation coefficients, taxonomic relatedness at lower taxonomic level was preferred over higher ranks, and sets with higher number of probes were favoured over sets with lower numbers of probes. Probe sets contained at least five probes with an average pair-wise correlation coefficient of ≥0.85. After the probe-sets were assembled, each probe-set for each sample was binary-scored with a 1 if ≥80% of the probe pairs assigned passed in that sample, otherwise a 0 was assigned. In total, 909 probe-sets scored a 1 in at least one of the 17 samples and the eOTUs of each probe set were annotated against Greengenes with the aid of a Naïve Bayesian algorithm applied to the 9-mers contained in all probes of the set. Bootstrap cut-off was set to 80% for all taxonomic levels. Afterwards, the mean ranked FI of all probes in one eOTU was determined for each
sample. These values are referred to as HybScores (hybridization scores) and used as abundance data of eOTUs. Topological data analysis Topological data analysis (TDA) functions as a geometric approach to identify small scale and large scale patterns within datasets. By understanding the shape of the data, which ultimately results in signal detection, this method is unsupervised in that it requires no initial hypotheses Three key characteristics of topology are essential for making the identification of shapes successful for assessing very subtle signals in complex data sets. These key characteristics are coordinate freeness, deformation invariance and compressed representation of shapes (Lum et al., 2013). For the Deepwater Horizon dataset we employed TDA for identifying outlier samples. Using TDA, the 17 samples were binned into overlapping buckets (in other words, samples can be placed in one or more buckets) according to the Gaussian density and then data points in the buckets were clustered into nodes according to their degree of cosine similarity. The calculated topological network was displayed using nodes and edges (Fig. 5.1), where nodes can contain multiple samples and samples can appear in multiple nodes. Nodes are connected by edges when they have samples in common. Nodes that do not contain any shared elements are classified as singletons. Considering the response of 994,980 individual probes simultaneously from 17 different arrays (10 designated plume samples, 7 non-plume samples), TDA identified two major networks, one comprising of plume samples and the other of non-plume samples. Sample OV01106 (designated as non-plume sample) forms a separate node (a singleton) and could be considered neither plume nor non-plume representative. Comparing the plume and the non-plume networks derived from probes, pairs or quartet (Fig 5.1A–C), we notice that the two main networks do not share samples and the non-plume cluster has lower Gaussian density values than the plume cluster. A possible interpretation is the nonplume network represents the high inter-sample dissimilarity within the pristine deep-sea microbial community and the inter-sample diversity is
PhyloChip Analysis of Disparate Microbiomes | 105
B) Pair (32,011)
A) Probe (994,980)
Non Plume
Non Plume Plume
Plume
C) Quartet (20,891)
D) eOTU (909) Plume
Non Plume Plume
OV01106
OV01106
OV01106
OV01106 Non Plume Gaussian density
Figure 5.1 Topological network of 17 samples generated using the Iris software (Ayasdi Inc.). Each node (circle) represents a group of samples with high cosine similarity. Node diameter corresponds to the number of samples in each node. An edge (line between nodes) connects any nodes that have samples in common. Node colour indicates Gaussian density of the samples (red is high, blue is low). The four panels represent the topological outcomes using 4 types of input from the same biological samples: (A) all 994,980 unique 25-mer probes, (B) 32,011 responsive probe pairs, (C) 20,981 responsive probe quartets and (D) 909 probe sets (one set for each eOTU). According to these parameters, the relative relatedness of these samples are such that non-plume samples form a strong subcluster and plume samples form another subcluster. There is one sample (arrow, singleton) that does not cluster with either the plume or non-plume samples in panels A, B and C.
attenuated by the plume chemical content, where the relationships between the microbial communities are tighter. In contrast to probe-, pair- and quartet-level, the analysis at set-level uses the re-construction of empirical OTUs (eOTUs) from clustering probe quartets. Concatenated probe sequences are classified using a Bayesian-algorithm against the Greengenes taxonomy (McDonald et al., 2012), allowing phylogenetic assignments of eOTUs. 909 eOTUs were identified in the entire dataset and their abundances (in units of fluorescence intensity) in each sample were used for TDA. When conducting TDA on probe-level data, pair-level data or quartet-level data, OV01106 was clearly an outlier compared to the other groups, but from the eOTU-level TDA, OV01106 was similar to both plume and non-plume samples.
Close examination of the metadata revealed that although sample OV01106 was classified as non-plume based on the fluorescence of the water sample measured immediately after collection, subsequent hydrocarbon analysis revealed that OV01106 contained the highest octadecane concentration of all non-plume samples (Hazen et al., 2010). The slightly increased hydrocarbons may have altered the microbial community, which was detected by the highly sensitive TDA analysis based on probe-, pair- and quartet-level FI. Overall, the observations suggest that the PhyloChip hybridization data contains subtle dissimilarities that can be overlooked when over-summarizing all the probe responses into probe-sets. Regardless, all four levels agreed that only sample OV01106 did not belong unambiguously to one group or the other.
106 | Probst et al.
Multivariate statistical analysis of PhyloChip data as revealed by PhyCA-Stats™ Multivariate statistical procedures can be applied to the set-level (eOTUs) based on either their hybridization scores (abundance values) or on binary metrics (presence/absence). These statistics use dissimilarity metrices to calculate the relationship between samples based on the abundance or binary metrics of the entire microbiomes observed. A detailed description of these methods can be found in for example (Kuczynski et al., 2010). In brief, microbial profiles of all samples are inter-compared in a pair-wise fashion to determine a dissimilarity score, resulting in a distance matrix. Two examples used herein are the UniFrac distance metric as published in (Lozupone and Knight, 2005) and the Bray–Curtis Index. While UniFrac utilizes the phylogenetic distance between eOTUs to determine the distance between communities, Bray–Curtis employs a pair-wise normalization by dividing the sum of differences by the sum of all abundances. UniFrac distance measure is either weighted (based on abundance scores) or unweighted (based on binary), whereas the Bray– Curtis Index calculated from a binary data results in the Sørensen Index. Based on the distance matrix two-dimensional ordination analyses or hierarchal clustering maps in form of dendrograms are popular methods for displaying inter-sample relationships. Two examples of ordination methods used in this book chapter are principal coordinate analysis (PCoA) and non-metric multidimensional scaling (NMDS). PCoA uses the dissimilarity values and NMDS the rank of the dissimilarity values to position samples in relative distance to each other. Applying these analysis tools to the microarray data set produced during the Deepwater Horizon oil spill (Hazen et al., 2010) provided evidence for microbial community changes of samples inside compared to outside the oil plume. A set of these ordinations is depicted in Figs. 5.2 and 5.3. PCoA and NMDS plots based on abundance dissimilarities clearly demonstrate a separation of the microbiomes of the plume and non-plume samples along NMDS 1 or PCoA 1 axis. These results are in agreement with reference based PhyloChip
rOTU analyses published previously (Hazen et al., 2010). Not all factors influencing changes in the community structure can be grasped from ordination analysis or hierarchal clustering methods. Microbial communities are generally exposed to multiple environmental factors, each of which has a variable degree of influence on community structure. One method to determine if numeric or categorical factors are associated with the observed microbial communities is the Adonis test. Adonis, also called PERMANOVA, utilizes the sample-to-sample distance matrix directly, not a derived ordination or clustering outcome. Low P-values across categorical variables would indicate that samples from different categories are generally more dissimilar in their microbiomes than samples from the same category. Low P-values for continuous variables, such as age, would indicate the samples from patients that are more similar in age have generally more similar microbiomes. Similar to NMDS and PCoA, the Adonis test can utilize any dissimilarity metric, including UniFrac and Bray–Curtis Index. During the sampling cruise of the R/V Ocean Veritas and the R/V Brooks McCall after the Deepwater Horizon oil spill, multiple environmental factors were collected. These factors encompassed plume/ non-plume, fluorescence, latitude, longitude, sampling depth, acridine orange direct count, phosphate, ammonia nitrogen concentration, dissolved inorganic carbon, total phospholipid fatty acids, phospholipid fatty acids trans/cis ratio, phospholipid fatty acids 16:1w5c/16:1w7c ratio, octadecane and docosane concentration. Adonis testing based on weighted UniFrac measures of eOTU data demonstrated a highly significant influence of the oil spill on the microbial community structure (P-value 0.001 for plume versus non-plume, Table 5.2); fluorescence, which was used to detect crude oil (Hazen et al., 2010), was also found to be associated with a significant change in the microbial community. Similarly, concentrations of hydrocarbons (octadecane, docosane) in the samples showed a highly significant association with microbial community profiles. Other factors like sampling depth or the total amount of phospholipid-derived fatty acids were also found to be significant but with higher
PhyloChip Analysis of Disparate Microbiomes | 107
A
B O
O O
O O
O
PCoA2
NMDS2
O
O
O
O
O
O
O
O
O
O
O
O
O O
O O O
O
NMDS1
PCoA1
C
D O
O
O
O O
O
O
PCoA2
NMDS2
O
O
O O
O O
O
O
O
O O
O
O
O O
O
NMDS1
O
PCoA1
Figure 5.2 Ordination analysis based on abundance scores of eOTUs present in at least one of the samples. All ordination methods show a separation of plume (closed circles) and non-plume (open circles) samples along NMDS1 and PCoA1, respectively. Consequently, different microbial community structures are present in plume and non-plume samples. However, non-plume sample OV01106 places between plume and non-plume groups. (A) NMDS based on Weighted Unifrac distance between samples given abundance of 909 taxa present in at least one sample with stress = 0.0239. (B) PCoA based on Weighted Unifrac distance between samples given abundance of 909 taxa present in at least one sample. Axis 1: 85% of variation explained. Axis 2: 5% of variation explained. (C) NMDS based on Bray–Curtis distance between samples given abundance of 909 taxa present in at least one sample with stress = 0.0321. (D) PCoA based on Bray– Curtis distance between samples given abundance of 909 taxa present in at least one sample. Axis 1: 84% of variation explained. Axis 2: 4% of variation explained.
P-values. Phospholipids are generally a microbial biomarker and are used to estimate microbial community changes via lipidomics (Hazen et al., 2010) or to estimate microbial abundance. An overview of Adonis P-values and the multiple factors tested is presented in Table 5.2. As mentioned above, set-level based
analysis also allows also presence/absence calling of eOTUs recorded as the binary variable 1 or 0. Considering binary metrics, the non-plume sample OV01106 was depicted as a possible boundary sample. Due to sample OV01106, incomplete separation of the microbiomes was observed along NMDS1 and PCoA1 axis (Fig.
108 | Probst et al. O
O
O
O
O
O
O
O
O O O
PCoA2
NMDS2
O
O O
O O O
O
O O
O
A
O
O
B
O
NMDS1
PCoA1
O
O
O
O O
O
O O O O O
O O O
PCoA2
NMDS2
O
O
O
O O O
O O
O
C
NMDS1
D
O
PCoA1
Figure 5.3 Ordination analysis based on binary metrics of eOTUs. In contrast to abundance based ordinations (Fig. 5.2), in three out of four ordination methods plume and non-plume microbiomes are not separated along NMDS1/PCoA1 axis due to the non-plume sample OV01106. This sample is considered an outlier. (A) NMDS based on Unweighted Unifrac distance between samples given presence/absence of 909 taxa present in at least one sample with stress = 0.0381. (B) PCoA based on Unweighted Unifrac distance between samples given presence/absence of 909 taxa present in at least one sample. Axis 1: 43% of variation explained. Axis 2: 14% of variation explained. (C) NMDS based on Bray–Curtis distance between samples given presence/absence of 909 taxa present in at least one sample with stress = 0.0477. (D) PCoA based on Bray–Curtis distance between samples given presence/absence of 909 taxa present in at least one sample. Axis 1: 40% of variation explained. Axis 2: 18% of variation explained.
5.3). This same sample was also categorized as an outlier in TDA (Fig. 5.1) and placed close to plume samples in abundance and binary based ordinations of eOTUs (Figs. 5.2 and 5.3). Presence/absence, or incidence of eOTUs, allows comparison of microbial richness. The number of eOTUs present in plume samples decreased
significantly (P = 0.02, ANOVA) compared to the number of eOTUs in non-plume samples. This result is in accordance with significant P-values in Adonis testing (Table 5.2) and with the previous rOTU-based analysis (Hazen et al., 2010). In the aforementioned reference, presence/absence of rOTUs and fluorescence microscopy showed a
PhyloChip Analysis of Disparate Microbiomes | 109
Table 5.2 Adonis P-values based on weighted Unifrac measures of abundance scores of eOTUs. Factors with significant P-values (bold) were associated with microbial community changes Factor
Details
P-value
Plume versus non-plume
Sample category determined by fluorescence
0.001
Fluorescence
In situ fluorescence intensity
0.001
Latitude
–
0.065
Longitude
–
0.593
Depth
Sampling depth
0.037
AODC
Acridine orange direct count
0.096
Phosphate
Total phosphate
0.419
Ammonia (N)
Total ammonia nitrogen
0.115
d13C_DIC
Dissolved inorganic carbon 13C isotope value
0.222
Total_PLFA
Total phospholipid fatty acids
0.041
PLFA_trans_cis
PLFA_trans/cis (ratio)
0.224
X16.1w5c_16.1w7c
PLFA 16:1w5c/16:1w7c (ratio)
0.009
Octadecane
Normalized octadecane concentration
0.002
Docosane
Normalized docosane concentration
0.001
very restricted microbial community profile in samples of high hydrocarbon content. Identification of taxa enriched in plume samples With its 1.1 million probes tracking more than 3.0 × 10¹¹ 16S rRNA gene molecules per sample, PhyloChip G3 technology is highly suited for multivariate statistical analysis to display differences between samples. Furthermore, univariate statistics, like a Welch test, can be applied to each individual probe/pair/quartet/set across samples allowing the identification of taxa that significantly increase or decrease in one sample category compared to other. Since TDA identified OV01106 as a boundary sample and both NMDS and PCoA supported that finding, OV01106 was removed from univariate analysis. Table 5.3 provides an overview of the percentage of passing taxa at each of four resolution levels and at each of seven taxonomic levels. Two different corrections for multiple testing were applied and, with the most stringent correction (Benjamini–Hochberg), on average 81.9% of the taxa passed the Welch test. The lowest percentage was retrieved for species level considering probes and the highest percentage for phylum level and eOTUs. In general, with increasing taxonomic summarization
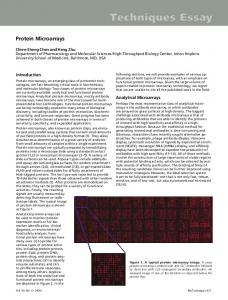
(species → genus → family → order → class → phylum) and with increasing probe summarization (probe → pair → quartet → set) the greater the percentage of taxa passed the univariate significance test. Using phylogenetic affiliations, eOTU analysis provides relative abundances for each taxon identified in a sample set. Employing a parametric Welch test, 104 eOTUs were identified to have significantly increased within-plume samples compared to non-plume samples. In contrast, approximately six times as many taxa decreased in abundance within the plume, concordant with the significant richness decrease noted above. Taxa that were significantly lower in abundance in oil-contaminated samples included many Archaea. Archaeal probe sets complementary to Nitrosopumilus, known for ammonia-oxidation in the ocean, or to members of the Thermoplasmata marine group II were observed to produce significantly lower FI in plume samples demonstrating that the microbial community of non-contaminated seawater was strongly altered by the spill. A selection of the 25 taxa with the most significant abundance increase and an additional 25 taxa with the most significant decrease is depicted in Fig. 5.4 as a heatmap. Dendrograms were calculated by grouping eOTUs with similar abundance changes across samples and applying
110 | Probst et al.
Table 5.3 Proportion of the community with significant changes in abundance observed between non-plume and plume samples. Data was summarized by probe-, pair-, quartet- and set/eOTU-level considering aggregated fluorescence intensities (FI) at various taxonomic levels. For instance, 23,680 responsive pairs belonged to 721 different families. Family sums of FI were compared and approximately 81% of the families exhibited a significant abundance change between plume and non-plume samples depending on the FDR procedure implemented. Outlier sample OV01106 was excluded from all comparisons Data Resolution
Rank
Per cent of Count Per cent of taxa Per cent of taxa taxa passing passing Welch test after of taxa passing Welch test considered Welch test1 permutational FDR penalty2 after BH FDR penalty3
Probe-level
Each probe
994,980
NA
NA
NA
Species
4187
73.4%
73.4%
42.8%
Genus
2112
82.0%
81.2%
80.8%
Family
833
87.9%
87.0%
87.3%
Order
464
91.2%
90.7%
91.2%
Class
253
96.0%
96.0%
88.1%
Phylum
93
97.8%
97.8%
97.8%
Each pair
23,680
72.8%
71.0%
69.5%
Species
2036
76.0%
75.2%
73.8%
Genus
1493
79.0%
78.2%
76.9%
Family
721
82.4%
82.1%
80.6%
Order
410
83.9%
83.2%
82.7%
Class
232
87.9%
87.1%
87.1%
Phylum
88
96.6%
96.6%
95.5%
Pair-level
Quartet-level Each quartet
Set-level/ eOTU
20,891
53.5%
53.0%
51.2%
speCies
1453
75.5%
74.3%
73.5%
Genus
1146
78.9%
77.9%
76.5%
Family
631
81.1%
80.3%
79.4%
Order
376
83.2%
82.4%
82.2%
Class
222
86.5%
85.6%
86.5%
Phylum
85
92.9%
92.9%
92.9%
eOTU HybScore
910
82.1%
76.9%
81.0%
Species
259
82.6%
80.7%
82.2%
Genus
244
84.0%
82.4%
83.6%
Family
207
87.0%
86.0%
86.5%
Order
140
91.4%
90.7%
90.0%
Class
102
94.1%
94.1%
94.1%
Phylum
61
98.4%
98.4%
98.4%
Welch test at P