APPLIED PHYSICS LETTERS 89, 181926 共2006兲
Microbeam high angular resolution x-ray diffraction in InGaN / GaN selective-area-grown ridge structures A. A. Sirenkoa兲 Department of Physics, New Jersey Institute of Technology, Newark, New Jersey 07102
A. Kazimirov, S. Cornaby, and D. H. Bilderback Cornell High Energy Synchrotron Source (CHESS), Cornell University, Ithaca, New York 14853
B. Neubert, P. Brückner, and F. Scholz Optoelectronics Department, University of Ulm, 89081 Ulm, Germany
V. Shneidman Department of Physics, New Jersey Institute of Technology, Newark, New Jersey 07102
A. Ougazzaden Georgia Institute of Technology/GTL, UMI 2958 Georgia Tech-CNRS, 57070 Metz, France
共Received 6 August 2006; accepted 20 September 2006; published online 3 November 2006兲 GaN-based 6-m-wide ridge waveguides with InGaN / GaN multiple-quantum-wells 共MQWs兲 produced by metal organic vapor-phase epitaxy in the regime of selective-area growth have been studied with microbeam high angular resolution x-ray diffraction and reciprocal-space mapping. Variation of the strain from 0.9% to 1.05% and a factor of 3 for the thickness enhancement of the MQW period have been measured for different widths of the oxide mask surrounding the GaN-based ridges. Only when the trapezoidal shape of the ridge cross section is taken into account can the difference between the experimentally measured thickness enhancement and predictions of the long-range gas-phase diffusion model be reconciled. © 2006 American Institute of Physics. 关DOI: 10.1063/1.2378558兴 Selective-area growth1–4 共SAG兲 is a powerful technique for monolithic integration of multifunctional structures with complementary optical and electronic properties. The structural quality and optical efficiency of GaN-based materials can be improved using the SAG technique taking advantage of the strain relaxation and reduced piezoelectric field at the sidewalls of selectively grown ridges.5–7 Adequate characterization tools, such as synchrotron radiation based microbeam high-resolution x-ray diffraction 共HRXRD兲,8–11 are required for detailed analysis of the fundamental growth mechanisms of GaN-based SAG structures. In this letter we apply nondestructive HRXRD technique and reciprocal-space-mapping 共RSM兲 analysis with a spatial resolution on a micron scale to determine the thickness, strain, and composition variation in various SAG ridge structures with InGaN / GaN multiplequantum-wells 共MQWs兲. Samples were grown on a c-plane sapphire substrate using low-pressure metal organic vapor-phase epitaxy in a single-wafer Aixtron system.7 Planar growth of a 共0001兲 oriented GaN template layer was followed by deposition of SiO2 mask arrays. The width of the oxide mask stripes A varied between 2 and 20 m for different arrays of 20 identical oxide stripes separated by the same opening B of 6 m ¯ 0典 direction. The second growth and oriented along the 具112 step was a selective epitaxy process inside the 6-m-wide open parts of the wafer producing trapezoidal ridges with the ¯ 01其 orientation of 共0001兲 orientation of the top plane and 兵11 the sidewalls. SAG ridges consisted of a few micron thick n-GaN layer grown at 1020 ° C followed by the active region grown at 800 ° C and a thin GaN:Mg top layer grown again a兲
Electronic mail:
[email protected]
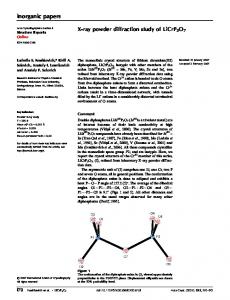
at 1020 ° C. The multiple-quantum-well active region had five InGaN quantum wells 共N = 5兲 separated by GaN barriers. HRXRD characterization was carried out at the A2 beamline at CHESS 共Fig. 1兲 equipped with a one-bounce focusing capillary BSG7 with the x-ray beam size of 10 m, tip-to-focus working distance of 30 mm, and divergence of 800 arc sec.12 The diffraction measurements were performed at an energy of 12.4 keV. SAG ridges were oriented along the diffraction plane so that in each measurement we collected diffracted signal from a single ridge.13 High angular resolution was provided by a combination of a perfect Ge共111兲 crystal analyzer and a two-bounce Ge共111兲 channel cut crystal with the full width at half maximum 共FWHM兲 of the “intrinsic” rocking curve of 13 arc sec. The channel cut crystal was positioned between the capillary and the sample to condition the incident beam for the high-resolution RSM analysis.11 By performing -2 scans, where and 2 denote rotation angles of the sample and the detector arm, respectively, the diffraction profiles were measured around 0 0 0 2 reflection of GaN with Bragg = 11.12 deg over a wide range of ⌬ ⬇ 1 deg.
FIG. 1. 共Color online兲 HRXRD setup at the CHESS A2 beamline consists of the upstream slit S1, ion chambers IC, Si共111兲 monochromator, XFlash fluorescence detector, one-bounce focusing capillary, single-bounce Ge共111兲 analyzer, and Ge共111兲 channel cut crystals.
0003-6951/2006/89共18兲/181926/3/$23.00 89, 181926-1 © 2006 American Institute of Physics Downloaded 10 Nov 2006 to 128.84.183.73. Redistribution subject to AIP license or copyright, see http://apl.aip.org/apl/copyright.jsp
181926-2
Sirenko et al.
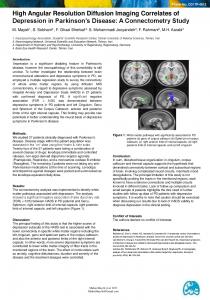
FIG. 2. 共Color online兲 共a兲 X-ray diffraction 共solid squares兲 from the InGaN / GaN MQW 6-m-wide SAG ridges for arrays with different widths of the oxide mask A marked next to the curves 共2 m, 4 m,…兲. The diffraction curves are vertically offset for clarity. The substrate GaN 0002 peak is at Bragg = 11.12 deg. The arrow shows the shift of the zeroth-order MQW global-strain peak. Simulated HRXRD spectra for the SAG structures with A = 2, 4, 6, and 8 m are shown with solid curves.
Figure 2 shows diffraction profiles measured in the center of the SAG ridges for the ridges with different width, of the oxide mask: A = 2 , 4 , 6 , . . . , 14 m. The separation of the superlattice peaks 共e.g., between “−2” and “−1” peaks兲 determines the MQW period P = WW + WB, while the relative position of the MQW zeroth-order peak with respect to the GaN 0 0 0 2 layer peak corresponds to the global strain of the MQW structure: S = WWSW / 共WW + WB兲, where WW共B兲 and SW are the thickness and strain of the well 共barrier兲, respectively. The 共N − 1兲 Kiessig fringes between the superlattice “ −1” and “0” peaks indicate a high angular resolution of our setup and an efficient suppression of the diffused background. Similar to the procedure applied before to InP-based SAG structures,10 we determined the thickness of the individual well and barrier layers using RADS-MERCURY BEDE software based on the dynamic diffraction theory for x-ray diffraction.14 No MQW-related XRD signal was detected for the structures with the width of the oxide mask A more than 14 m. Our scanning electron microscopy 共SEM兲 results show that the ridges grown with this periodicity are not trapezoidal, but purely triangular without a flat MQW region at the top.7 The main parameters of investigated SAG MQWs are shown in Fig. 3. An increase of the oxide mask width from 2 to 12 m resulted in the changes of the MQW period P from 16 to 46 nm 关Fig. 3共a兲兴. Correspondingly, the width of the well and barrier layers increases, as shown in Fig. 3共b兲. The thickness enhancement for InGaN quantum wells WW共A兲 ⫻关nm兴 = 3.8共1 + 0.3A关m兴兲 is very close to that for the GaN barrier WB共A兲关nm兴 = 5.6共1 + 0.3A关m兴兲, where the interpolated values of the well and barrier thickness for the unmasked growth 共A = 0兲 are 3.8 and 5.6 nm, respectively, and 0.3 nm/ m is the slope determined with the error bar of ±0.03 nm/ m. As it is known for selective growth of III-V arsenideand phosphide-based compounds 共e.g., InGaAsP兲, the vertical and lateral vapor-phase diffusion processes 共VVP and LVP, respectively兲 and the surface migration of the metal organic precursors are the three main mechanisms with dif-
Appl. Phys. Lett. 89, 181926 共2006兲
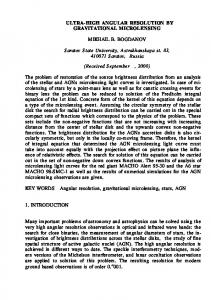
FIG. 3. 共Color online兲 共a兲 Period of the MQWs vs A 共diamonds兲. The solid and dashed straight lines represent different models for the growth enhancement 共see text for details兲. 共b兲 The thickness of the quantum wells WW 共down triangles兲 and barriers WB 共up triangles兲. The dashed straight lines represent linear fits to the experimental data. 共c兲 Left scale: Composite strain S of the 6-m-wide MQW SAG structures. Right scale: The indium composition in the InGaN quantum wells. 共d兲 FWHM for the MQW 共diamonds兲 and GaN peaks 共stars兲 measured along the qy direction in the RSMs 共see Fig. 5兲.
ferent characteristic lengths that result in the thickness enhancement and compositional changes in the SAG regime.2,3,9,15,16 The gas-phase diffusion model allows accurate calculations of the VVP and LVP effects with characteristic diffusion lengths Dv / k in the range of 20– 200 m, while the surface migration effect is important for the analysis of the ridge shape and composition on the scale of a few microns.9,15 Analysis of the thickness enhancement for the experimentally measured MQW period P 关Fig. 3共a兲兴 is simplified in our case by the periodic array geometry of the oxide mask. Indeed, the gas-phase diffusion model, which otherwise requires the knowledge of the diffusion lengths Dv / k for the group-III precursors 共In, Ga兲, has a simple analytical solution for periodic arrays. In this case, the growth enhancement P / P0 is limited by the mask load and for the SAG process with Dv / k共In, Ga兲 Ⰷ A + B it cannot exceed 共A + B兲 / B, where P0 corresponds to the unmasked growth. However, the corresponding dependence 关solid line in Fig. 3共a兲兴 demonstrates a significant discrepancy with our experimental points. We attempted to compensate for this difference by introducing a correction factor taking into account the real trapezoidal shape of the ridge cross section—a complication that is usually ignored in the gas-phase diffusion model. As one can see in Fig. 4, the actual width of the MQW section that is located at the top of the ridge 共marked with b兲 is less than the nominal distance between the oxide mask stripes B. Correspondingly, the growth enhancement should be changed to 共A + B兲 / b.17 Indeed, the straight dashed
FIG. 4. SEM photograph of the SAG ridges with A = 4 m and B = 6 m. The MQW section of the structure with five InGaN wells is not well resolved on the top facet due to a low 共⬃0.12兲 fraction of indium. Downloaded 10 Nov 2006 to 128.84.183.73. Redistribution subject to AIP license or copyright, see http://apl.aip.org/apl/copyright.jsp
181926-3
Appl. Phys. Lett. 89, 181926 共2006兲
Sirenko et al.
FIG. 5. 共Color online兲 Reciprocal-space map for 0 0 0 2 reflection with the GaN substrate peak and MQW satellite peaks marked according to their order. The horizontal arrow shows the FWHM of the satellite MQW peak.
line in Fig. 3共a兲, which is calculated for b = 4 m, shows a better agreement with experiment. Thus, our results demonstrate that the long-range gas-phase diffusion model alone cannot provide a reliable quantitative description of experiment for the micron-wide ridge formation in the SAG regime for nitrides. Surface migration, which results in a different growth rate on the trapezoidal ridge facets, has to be taken into account. Figure 3共c兲 shows that the global strain of the MQW structures changes from 0.9% to 1.05% when A varies from 2 to 12 m. Here the MQW strain is expressed in terms of the perpendicular d-spacing mismatch 共S = ⌬d / d兲 with respect to the GaN substrate. It is natural to attribute this effect to the variation of indium composition in the InGaN quantum wells. The indium composition could be straightforwardly determined from the diffracted profiles 共Fig. 2兲, but first we need to provide an additional proof that the measured strain is elastic, especially for the ridges with the wide oxide mask. Indeed, the quantum well width WW increases strongly with increasing A and for A = 10 m the total thickness of InGaN layers NWW approaches 75 nm, which is close to the critical thickness of 75± 7 nm for In0.15Ga0.85N single layers grown on GaN.18 However, our earlier photoluminescence studies7 and x-ray data show no indication that the quantum wells change from strained to relaxed. RSM is an ideal tool to study strain and its relaxation in lattice-mismatched heterostructures. Figure 5 shows RSM for the SAG ridge with A = 4 m. The MQW peaks are marked according to their order. The FWHM for the MQW peaks measured along the qy direction 共close to the direction in the angular space兲 is very close to that for the GaN peak. Figure 3共d兲 shows that similar values of FWHM were observed for all investigated SAG ridges indicating that no additional mosaic spread was introduced during the SAG process compared to the mosaicity of the GaN template substrate. Note that a significant increase of the FWHM values for MQWs in Fig. 3共d兲 should be expected in the case of developing strain relaxation. We therefore conclude that all our MQWs are pseudomorphically strained as a consequence of the fairly thick GaN barriers between InGaN quantum
wells, which decouple the quantum wells and hence increase the critical thickness of the whole package. Assuming that the measured strain in MQWs is indeed elastic, the indium composition in the InGaN quantum wells changes from 0.12 to 0.15 in the SAG structures with A between 2 and 10 m 关Fig. 3共c兲兴. The observed increase of indium composition can imply that the gas-phase diffusion coefficient of indium is smaller than that for gallium. Additional contribution to the observed increase of In composition at the top facet could be due to a relatively high rate of In interfacet migration 共from ¯ 01其-oriented sidewalls to 0001-oriented top facet兲 com兵11 pared to that for Ga.19 In the future, we plan to determine Dv / k共In, Ga兲 and the interfacet migration rates by performing accurate cross-section HRXRD studies of GaN-based SAG ridges with a submicron size of the x-ray beam. The Cornell High Energy Synchrotron Source is supported by the National Science Foundation and the National Institutes of Health/National Institute of General Medical Sciences under Award No. DMR-0225180. 1
J. J. Coleman, R. M. Lammert, M. L. Osowski, and A. M. Jones, IEEE J. Sel. Top. Quantum Electron. 3, 874 共1997兲. T. Van Caenegem, I. Moerman, and P. Demeester, Prog. Cryst. Growth Charact. Mater. 35, 263 共1997兲. 3 M. Gibbon, J. P. Stagg, C. G. Cureton, E. J. Thrush, C. J. Jones, R. E. Mallard, R. E. Pritchard, N. Collis, and A. Chew, Semicond. Sci. Technol. 8, 998 共1993兲. 4 M. A. Alam, R. People, E. D. Isaacs, K. Evans-Lutterodt, T. Siegrist, T. Pernell, J. Vandenberg, S. K. Sputz, S. N. G. Chu, D. V. Lang, L. Smith, and M. Hybertsen, Appl. Phys. Lett. 74, 2617 共1999兲. 5 L. S. Wang, S. Tripathy, B. Z. Wang, J. H. Teng, S. Y. Chow, and S. J. Chua, Appl. Phys. Lett. 89, 011901 共2006兲. 6 O. Ambacher, J. Phys. D 31, 2653 共1998兲. 7 B. Neubert, P. Brückner, F. Habel, F. Scholz, T. Riemann, J. Christen, M. Beer, and J. Zweck, Appl. Phys. Lett. 87, 182111 共2005兲. 8 A. Kazimirov, A. A. Sirenko, D. H. Bilderback, Z-H. Cai, B. Lai, R. Huang, and A. Ougazzaden, J. Phys. D 39, 1 共2006兲. 9 A. A. Sirenko, A. Kazimirov, A. Ougazzaden, S. O’Malley, D. H. Bilderback, Z.-H. Cai, B. Lai, R. Huang, V. Gupta, M. Chien, and S. N. G. Chu, Appl. Phys. Lett. 88, 081111 共2006兲. 10 A. A. Sirenko, A. Kazimirov, R. Huang, D. H. Bilderback, S. O’Malley, V. Gupta, K. Bacher, L. J. P. Ketelsen, and A. Ougazzaden, J. Appl. Phys. 97, 063512 共2005兲. 11 A. Kazimirov, R. Huang, D. Bilderback, A. A. Sirenko, and A. Ougazzaden, J. Phys. D 37, L1 共2004兲. 12 D. H. Bilderback and E. Fontes, AIP Conf. Proc. 417, 147 共1997兲. 13 Since the x-ray beam of 10 m is wider than the top part of the trapezoidal ridge, all diffraction curves have an additional contribution from the masked part of the GaN substrate and the sidewalls. However, this contribution does not affect the x-ray data analysis for the top part of the MQWs. 14 M. Wormington, C. Panaccione, K. M. Matney, and K. D. Bowen, Philos. Trans. R. Soc. London, Ser. A 357, 2827 共1999兲. 15 S. Kitamura, K. Hiramatsu, and N. Sawaki, Jpn. J. Appl. Phys., Part 2 34, L1184 共1995兲. 16 F. Scholz, D. Ottenwälder, M. Eckel, M. Wild, G. Frankowsky, T. Wacker, and A. Hangleiter, J. Cryst. Growth 145, 242 共1994兲. 17 As it has been shown in Ref. 7, the MQW growth on the ridge sidewalls is a much slower process and thus its contribution is neglected in this qualitative analysis. 18 C. A. Parker, J. C. Roberts, S. M. Bedair, M. J. Reed, S. X. Liu, and N. A. El-Masry, Appl. Phys. Lett. 75, 2776 共1999兲. 19 M. Funato, T. Kotani, T. Kondou, Y. Kawakami, Y. Narukawa, and T. Mukai, Appl. Phys. Lett. 88, 261920 共2006兲. 2
Downloaded 10 Nov 2006 to 128.84.183.73. Redistribution subject to AIP license or copyright, see http://apl.aip.org/apl/copyright.jsp