Biogeosciences, 11, 6739–6753, 2014 www.biogeosciences.net/11/6739/2014/ doi:10.5194/bg-11-6739-2014 © Author(s) 2014. CC Attribution 3.0 License.
Microbial food web dynamics during spring phytoplankton blooms in the naturally iron-fertilized Kerguelen area (Southern Ocean) U. Christaki1 , D. Lefèvre2 , C. Georges1 , J. Colombet3 , P. Catala4,5 , C. Courties6,7 , T. Sime-Ngando3 , S. Blain4,5 , and I. Obernosterer4,5 1 INSU-CNRS,
UMR8187 LOG, Laboratoire d’Océanologie et des Géosciences, Université du Littoral Côte d’Opale, ULCO, 32 avenue Foch, 62930 Wimereux, France 2 Aix Marseille Université, CNRS/INSU, IRD, Mediterranean Institute of Oceanography (MIO), UM110, 13288 Marseille, France 3 INEE-CNRS, UMR6023, LMGE, Laboratoire Microorganismes: Génome et Environnement – Clermont Université, Université Blaise Pascal, 63177 Aubière CEDEX, France 4 CNRS, UMR7621, Laboratoire d’Océanographie Microbienne, Observatoire Océanologique, 66650 Banyuls-sur-mer, France 5 Sorbonne Universités, UPMC Univ Paris 06, UMR7621, Laboratoire d’Océanographie Microbienne, Observatoire Océanologique, 66650 Banyuls-sur-mer, France 6 CNRS, UMS2348, Laboratoire d’Océanographie Microbienne, Observatoire Océanologique, 66650 Banyuls-sur-mer, France 7 Sorbonne Universités, UPMC Univ Paris 06, UMS2348, Laboratoire d’Océanographie Microbienne, Observatoire Océanologique, 66650 Banyuls-sur-mer, France Correspondence to: U. Christaki (
[email protected]) Received: 2 April 2014 – Published in Biogeosciences Discuss.: 16 May 2014 Revised: 23 October 2014 – Accepted: 23 October 2014 – Published: 5 December 2014
Abstract. Microbial food web dynamics were determined during the onset of several spring phytoplankton blooms induced by natural iron fertilization off Kerguelen Island in the Southern Ocean (KEOPS2). The abundances of heterotrophic bacteria and heterotrophic nanoflagellates, bacterial heterotrophic production, bacterial respiration, and bacterial growth efficiency, were consistently higher in surface waters of the iron-fertilized sites than at the reference site in HNLC (high nutrient low chlorophyll) waters. The abundance of virus-like particles remained unchanged, but viral production increased by a factor of 6 in iron-fertilized waters. Bacterial heterotrophic production was significantly related to heterotrophic nanoflagellate abundance and viral production across all sites, with bacterial production explaining about 70 and 85 %, respectively, of the variance of each in the mixed layer (ML). Estimated rates of grazing and viral lysis, however, indicated that heterotrophic nanoflagellates accounted for a substantially higher loss of bacterial production (50 %) than viruses (11 %). Combining these results with
rates of primary production and export determined for the study area, a budget for the flow of carbon through the microbial food web and higher trophic levels during the early (KEOPS2) and the late phase (KEOPS1) of the Kerguelen bloom is provided.
1
Introduction
The Southern Ocean has a unique geography with major implications for the global ocean circulation and climate system. It is also the largest HNLC (high nutrient low chlorophyll) ocean where iron limits phytoplankton primary production, resulting in a large stock of unused major inorganic nutrients (Martin and Fitzwater, 1990). A pronounced shift to larger phytoplankton cells, in particular diatoms, has been generally observed upon natural (Blain et al., 2007; Pollard et al., 2009) or artificial (Boyd et al., 2007; Smetacek et al., 2012) iron additions. Natural and artificial iron fertilization
Published by Copernicus Publications on behalf of the European Geosciences Union.
6740
U. Christaki et al.: Microbial food web dynamics during spring phytoplankton blooms
Figure 1. KEOPS2 study area from October to November 2011. Chl a (colour scale), surface velocity fields (arrows), the polar front (PF, black line), and the position of the different stations: stations 1–11 of the north–south transect (TNS); stations 1–9 of the east– west transect (TEW). The Chl a rich stations: A3, on the Kerguelen plateau visited twice; F-L and E-4W north and south of the polar front; and “E” stations sampled in a quasi-Lagrangian manner (E-1, E-2, E-3, E-4E, and E-5) within a complex meander south of the polar front. The reference HNLC station (R-2) is not shown as it is out of the area of the map (66.692743 ◦ E longitude, 50.38954 ◦ N latitude). Map is courtesy of Y. Park and colleagues. To note that, the chlorophyll content represented on the map corresponds to the last week of the KEOPS2 cruise.
studies have suggested regional variability in the ecosystem response to iron addition and in the carbon export (Blain et al., 2007; Pollard et al., 2009; Boyd et al., 2007). Although the underlying mechanisms are not fully understood, the variability in carbon export seems to be connected to the duration, the mode and magnitude of iron supply (De Baar et al., 2005; Boyd et al., 2007). The ratio of carbon exported from the surface layer to primary production is in part determined by microbial food web processes. Variable fractions of primary production are channelled through heterotrophic bacteria, and most of this phytoplankton-derived organic carbon is respired to carbon dioxide (CO2 ). The question on how much carbon fixed by primary production is mineralized within the microbial food web, and what part of this particulate organic carbon is made available for higher trophic levels or export, is important in the present context. For a better understanding of the role of the microbial food web for the fate of organic carbon, a comprehensive picture of the biomass, productivity, and mortality of heterotrophic bacteria is required. While the measurement of bacterial heterotrophic production (BP) in natural and artificial iron-fertilization studies has been regularly undertaken, measurements of bacterial respiration (BR) and growth efficiency have been rare (Obernosterer et al., 2008, BonillaFindji et al., 2008). The role and relative importance of bacteria in the carbon flow also needs to be completed by the Biogeosciences, 11, 6739–6753, 2014
fate of BP through grazing by protists and viral lysis. Grazing channels part of the bacterial carbon to higher trophic levels, while viral induced mortality of bacteria is reported to lead to an increase in BR and finally to a decrease in carbon export (Middelboe and Lyck, 2002; Bonilla-Findji et al., 2008). The oceanographic cruise KEOPS1 (Kerguelen Ocean and Plateau Study, January–February 2005) demonstrated that the 3-month spring phytoplankton bloom above the Kerguelen plateau is sustained from below by low level supplies of iron and other nutrients (Blain et al., 2007). KEOPS1 took place during the third month of the bloom, from its peak to its decline. Heterotrophic bacteria were more abundant in the bloom, and revealed substantially higher rates of production and respiration than in surrounding HNLC waters (Christaki et al., 2008). Heterotrophic bacteria processed a significant portion of primary production, with most of it being rapidly respired (Obernosterer et al., 2008). Furthermore, while heterotrophic nanoflagellates did not seem to efficiently control BP in the bloom (Christaki et al., 2008), viruses enhanced the role of bacteria as oxidizers of organic matter, hence as producers of CO2 (Bonilla-Findji et al., 2008; Malits et al., 2014). The KEOPS2 cruise aimed to complement the findings of KEOPS1 above the Kerguelen plateau, and gain new insights on the biogeochemistry and ecosystem response to iron fertilization by extending the study area to the offshore waters east of Kerguelen Island. The sampling strategy covered spatially diverse fertilized regions at early bloom stages (October– November 2011). The main objective of the present study was to provide for the first time insight into seasonal dynamics of the microbial food web functioning in the context of natural Fe fertilization of the Southern Ocean. The major biogeochemical and biological parameters reported in this study are full depth profiles of microbial stocks (viruses, heterotrophic bacteria, and heterotrophic nanoflagellates), bacterial production, potential bacterial grazing, and viral lysis, while respiration was measured at selected depths in surface waters.
2 2.1
Methods Sample collection
The present study was carried out during the KEOPS2 cruise from 15 October to 20 November 2011. Water samples for this study were collected at 10 stations along a north–south transect (TNS; stations 1, 2, 3, 4, 5, 6, 7, 8, 9, 10) and at seven stations along an east–west transect (TEW; Stations 1, 2, 3, 4, 5, 7, 8) (Fig. 1, Table 1), both covering the bloom area above and off the Kerguelen plateau, (Park et al., 2014) and providing an overview of the region. In addition to the “historical” A3 station situated on the Kerguelen plateau (Blain et al., 2008), a further seven main stations were sampled in www.biogeosciences.net/11/6739/2014/
U. Christaki et al.: Microbial food web dynamics during spring phytoplankton blooms
6741
Table 1. Overview of the parameters determined in the present study. VLPs: virus-like particles; HB: heterotrophic bacteria; HNF: heterotrophic nanoflagellates; BP: bacterial heterotrophic production; BR: bacterial respiration; TNS: north–south transect; TEW: east–west transect; main stations: R-2, A3, E-4W, F-L, E-1, E-2, E-3, E-5, E-4E; ML: mixed layer; ZML : depth of the mixed layer. Parameter
Station
Depth Layer
VLP, HB, HNF BP BR HNF grazing on bacteria Virus induced bacterial mortality
TNS, TEW and main stations Main stations Main stations except E-2 Main stations Main stations
Surface-bottom Surface-bottom ML ML, ZML –200 m, > 200 m Surface-bottom
Table 2. Brief description of the main stations. The depth of the mixed layer (ZML ) is based on a difference in sigma of 0.02 to the surface value. The mean ZML (±SD) of all CTD casts performed during the occupation of the stations is given. For chlorophyll a and major inorganic nutrients mean values ±SD for the mixed layer are given. A3-1 and A3-2 refer to two consecutive visits of station A3. ∗ : a single cast was preformed at E-2 Date (2011)
Longitude (◦ E)
Latitude (◦ S)
Depth (m)
ZML (m)
Chl a (µg L−1 )a
− NO− 3 + NO2 (µM)b
PO3− 4 (µM)b
Si(OH)4 (µM)c
R-2
26/10
66.692743
50.38954
2450
105 ± 15
0.25 ± 0.08
26.0 ± 0.2
1.83 ± 0.03
12.3 ± 0.3
A3-1 F-L E-4W A3-2
20/10 07/11 10/11 16/11
72.080388 74.807422 71.429833 72.055283
50.62953 48.61992 48.76628 50.62417
475 2690 1398 528
168 ± 11 38 ± 7 61 ± 11 153 ± 15
0.62 ± 0.17 4.00 ± 1.58 2.38 ± 0.31 2.03 ± 0.34
29.7 ± 0.5 20.5 ± 1.9 25.4 ± 1.0 26.2 ± 0.4
2.00 ± 0.03 1.06 ± 0.21 1.79 ± 0.10 1.78 ± 0.03
23.7 ± 0.8 7.7 ± 0.8 18.5 ± 1.2 18.9 ± 0.5
E-1 E-2 E-3 E-4E E-5
30/10 01/11 04/11 13/11 19/11
72.186833 72.077083 71.966828 72.566683 71.899917
48.45783 48.52343 48.70215 48.71500 48.4115
2050 2003 1923 2210 1920
72 ± 38 43* 38 ± 9 74 ± 8 46 ± 13
0.94 ± 0.08 0.78 ± 0.50 0.63 ± 0.08 1.11 ± 0.41 1.15 ± 0.07
25.7 ± 0.5 27.3 ± 0.6 26.2 ± 0.7 24.6 ± 1.9 25.4 ± 0.2
1.75 ± 0.05 1.84 ± 0.13 1.79 ± 0.01 1.62 ± 0.18 1.74 ± 0.04
15.1 ± 0.4 15.9 ± 2.0 15.2 ± 0.2 12.3 ± 3.0 11.7 ± 0.2
Station
Note: ZML at station E-2 is derived from a single CTD profile. a Lasbleiz et al. (2014). b Blain et al. (2014). c Closset et al. (2014)
the fertilized region (E-4W, F-L, E-1, E-2, E-3, E-4E, E-5, Fig. 1, Tables 1 and 2). Two of these main stations were chosen due to their high concentrations of surface chlorophyll, one located north (station F-L), and one located south of the southern branch of the polar front (E-4W). Based on the trajectories of two surface drifters, the other five main stations were sampled in a quasi-Lagrangian manner within a complex meander south of the polar front (E-1, E-2, E3, E-4E, and E-5). Station A3 was visited twice (A3-1 and A3-2) during the onset of the bloom (KEOPS2), which complemented previous investigations following the decline of the phytoplankton bloom (KEOPS1). The reference site (station R-2) in high nutrient low chlorophyll waters (HNLC) was situated west of the plateau (Table 2). All water samples were collected with 12 L Niskin bottles mounted on a rosette equipped with a CTDO Seabird SBE911-plus. Sampling for microbial parameters presented here was performed at 11–14 depths at each station.
www.biogeosciences.net/11/6739/2014/
2.2
Abundances of microbial components and heterotrophic nanoflagellate grazing
The abundance of virus-like particles (VLPs) of heterotrophic bacteria [(HB) – sensus stricto heterotrophic Bacteria + Archaea)] and HNF (heterotrophic nanoflagellates) were determined by flow cytometry. Subsamples (2.5 mL for VLP and HB, and 4.5 mL for HNF) were fixed with a transmission electron microscope (TEM) grade glutaraldehyde (final concentration 1 %) for VLP and HNF; and with formaldehyde (2 % final concentration) for HB. VLP and HB, and HNF were refrigerated for 10 to 20 min and 2 h, respectively, then frozen in liquid nitrogen and stored at −80 ◦ C until analysis. Counts of VLP and HB were made using a FACSCalibur flow cytometer (BDBiosciences) equipped with an air-cooled laser, providing 15 mW at 488 nm with the standard filter set-up. VLP and HB were stained with SYBRGreen I, as described in detail in Marie et al. (1999) and Brussaard (2004). Populations of VLP and HB differing in fluorescence intensity were distinguished on plots of side scatter versus green fluorescence (530 nm wavelength, fluorescence channel 1 of the Biogeosciences, 11, 6739–6753, 2014
6742
U. Christaki et al.: Microbial food web dynamics during spring phytoplankton blooms
instrument). Flow cytometry list modes were analysed using CellQuest Prosoftware (BD Bioscences, version 4.0). HNF were stained with SYBRGreen I and analysed according to Christaki et al. (2011) with a FACSCanto (BD-Biosciences). To establish the size of cells of the three cytometric populations identified during this study (HNF1, HNF2, and HNF3, Fig. S1 in the Supplement), cells from each population were sorted with a FACSAria cell sorter (BDBiosciences). The sorted cells (1000–3000 cells per sample) were collected on Nuclepore filters (0.2 µm pore size, 25 mm diameter), and examined using a Zeiss AX10 microscope at 1000×. The mean biovolume of each cytometric population was calculated based on the linear dimensions of the cells, applying a prolate spheroid equation. Clearance rates (nl HNF−1 h−1 ) were estimated based on 105 biovolume−1 h−1 (Fenchel, 1982; Christaki et al., 2001). The potential of HNF grazing accounting for the relative loss of bacterial heterotrophic production (BP) was then calculated as % BP loss = bacterial cells “cleared” L1 h−1 × 100 / bacterial cells produced L−1 h−1 .
(1)
The number of bacterial cells produced was calculated from BP, as determined by leucine incorporation (see below), using a conversion factor of 12.4 fg C cell−1 (Fukuda et al., 1998). 2.3
Phage-infected bacteria and burst size
For observations on the Transmission Electron Microscope (TEM), the 4.5 mL subsamples collected at different depths were pooled before ultracentrifugation for the following layers: the mixed layer (ML); from the bottom of the mixed layer to 200 m and the layer from below 200 m to the bottom. This operation resulted in one TEM observation per layer per station (Fig. S2 in the Supplement). Bacterial cells were harvested by ultracentrifugation onto 400 mesh copper electron microscope grids with carbon-coated Formvar film using a Beckman Coulter SW40Ti swing-out-rotor at 70 000× g for 20 min at 4 ◦ C. Each grid was then stained for 30 s with uranyl acetate (2 % w/v) and examined in a JEOL 1200EX TEM operated at 80 kV at a magnification of 20 000–40 000×. For each grid, 600 bacterial cells per sample were examined to determine the frequency of visibly infected bacterial cells (FVICs), and the number of mature phages inside each host i.e. burst size (BS). A bacterium was considered infected if it contained five or more phages. Burst size in each of the 30 samples was defined as the average number of viral particles in all visibly infected cells. This is likely the minimum burst size, as more viral particles may accumulate within an infected cell before it lyses. To estimate viral induced bacterial mortality as a % of the bacterial production (VIBM), the frequency of infected cells (FIC with data given as percentages) was first calculated from the freBiogeosciences, 11, 6739–6753, 2014
quency of FVIC according to Weinbauer et al. (2002): FIC = 9.524 × FVIC − 3.526.
(2)
The proportion of the total bacterial mortality that was due to virally induced lysis was calculated according to Binder (1999): VIBM = (FIC + 0.6 FIC2 ) / (1 − 1.2 FIC).
(3)
Viral production (VP) was estimated according to Weinbauer et al. (2003): VP(VLP L−1 h−1 ) = FIC(%) × BS × BP / 100.
(4)
The BS used in the equation was the BS of each of the 30 samples observed with the TEM. 2.4
Bacterial production, respiration, and bacterial growth efficiency
The incorporation of 3 H leucine was used to estimate BP. Leucine concentrations and incubation times were tested on board and adjusted for different depths in order to obtain a sufficient radioactivity signal and to maintain linear uptake during the incubation. At each depth, 20 mL triplicate samples and a trichloroacetic acid (TCA)-killed control were incubated with a mixture of L-[4.5-3 H] leucine (Perkin Elmer, 144 Ci mmol−1 ) with nonradioactive leucine added at final concentrations of 7 and 13 nM for the upper 150 m, 13 and 7 nM for the 150–300 m depth layer, and 9 nM of 3 H leucine alone below 300 m. Samples were incubated in the dark at in situ temperature. Incubation times were 3 h (0–150 m), 6 h (150–300), and 8 h (below 300 m). Incubations were terminated by adding ice-cold TCA (5 % final conc.), filtering through 0.22 mm Millipore cellulose acetate filters, and rinsing three times with 3–4 mL ice-cold 5 % TCA. After dissolving the filters in 1 mL ethyl acetate, 10 mL of Ultima Gold scintillation cocktail (Packard) were added and the samples were radioassayed. The incubation times (3–10 h) were tested to satisfy linear incorporation with time. Three stations inside and outside the bloom were checked at 5, 150, 500, and 750 m depths, by concentration kinetics (4, 6, 12, 20, and 40 nM), to ensure that there was no isotopic dilution. The theoretical conversion factor of 1.55 kg of C mol−1 was used to convert leucine incorporation rates to prokaryotic carbon production (Kirchman, 1993). Bacterial respiration was determined at all main stations, except R-2 and E-2, at one to three depths within the ML (Table 1) as described in Obernosterer et al. (2008). At station R-2, bacterial respiration rates were estimated from both dark community respiration (unfiltered seawater) and the fraction of dark community respiration accounted for by bacterial respiration as determined for the iron-fertilized sites (see Sect. 3.3). Briefly, rates of respiration were determined from dissolved oxygen consumption in 24 h dark incubations of 0.8 µm filtered samples. Dissolved oxygen was determined www.biogeosciences.net/11/6739/2014/
U. Christaki et al.: Microbial food web dynamics during spring phytoplankton blooms by Winkler titration using a PC-based system with a photometric endpoint detector (Lefèvre et al., 2008). Bacterial growth efficiency was determined from in situ bacterial production and respiration rates as BGE = (BP + BR) / BR) × 100.
(5)
We used a respiratory quotient of 1, as determined for the Kerguelen study region during KEOPS1 (Lefèvre et al., 2008) to convert oxygen units to carbon units. 3 3.1
Results Study sites
The hydrographic conditions during KEOPS 2 are reported in detail in Park et al. (2014). The “historical” A3 station situated above the Kerguelen plateau (Blain et al., 2007, 2008) was characterized by a deep ML (ZML , depth of the mixed layer from 150 to 170 m) (Fig. 2). Here mean concentrations of Chl a in the ML increased from 0.6 to 2.0 µg L−1 between the first and second visit three weeks later (Table 2). Stations F-L and E-4W revealed mean concentrations of 4.0 and 2.3 µg L−1 Chl a, respectively, constrained in shallow ML (∼ 40 m at station F-L and 60 m and station E-4W). The closely geographical positioned stations E-1, E-3, E-4E, and E-5 were visited between 30 October and 19 November in a quasi Lagrangian manner, and showed concentrations of Chl a between 0.6 and 1.2 µg L−1 in the ML (ZML 40 m to 70 m) (Table 2). Temperature in the ML were highest at station F-L (4.2 ◦ C, Fig. 2), indicating the influence of subAntarctic waters. Station E-4W was located at the shelf break in a region with very strong currents. E4-W received Fe-rich waters from the Kerguelen Island and Plateau (A3 station area) which mixed with polar front waters while travelling northeast (Fig. 1). The reference site (station R-2) in high nutrient low chlorophyll waters (HNLC) revealed comparatively low mean concentrations of Chl a (0.3 µg L−1 ), and a surface temperature of 2.1 ◦ C (Fig. 2) in the ZML (∼ 100 m). The water mass below 200 m in the sampled area was characterized by winter waters from south of the polar front. The macronutrient concentrations in the mixed layer were 20–30 µM for nitrate plus nitrite, 1–2 µM for phosphate, 8– 24 µM for silicic acid (Table 2, Blain et al., 2014; Closset et al., 2014) and dissolved iron ranged between 0.08 and 0.35 nM (Quéroué et al., 2014). According to KEOPS2’s microscopical observations and pigment analysis, Bacillariophyceae dominated the phytoplankton community in the blooms (Sackett et al., 2014, Lasbleiz et al., 2014). In particular, Fragilariopsis kerguelensis, Pseudonitzschia spp., Eucampia antarctica, and Chaetoceros spp. were found to be the four dominant diatom taxa (Sackett et al., 2014).
www.biogeosciences.net/11/6739/2014/
3.2
6743
Distribution of microbial community components
VLP, HB, and HNF abundances in the upper 200 m were of the order of 109 , 108 , and 105 particles cells L−1 , respectively (Fig. 3, Table 3). HB abundance, the %HNA (high nucleic acid) containing bacterial cells, and HNF abundances were significantly higher in the upper 200 m of the fertilized stations compared to the HNLC-site R-2 (Mann–Whitney, p < 0.05); this difference disappeared below 200 m (Table 3). The abundance of VLP was not significantly different between sites at any of the depth layers considered (Table 3). The variation between HNLC and Fe-fertilized sites was most pronounced for HNF (range ∼ 200–900 S× 103 L−1 ), if compared to VLP (range 1.4– 1.7 × 10⁹ L−1 ), and HB (range 2.7–4.7 × 10⁸ L−1 ). HNF were distinguished in the three cytometrically identified subpopulations HNF1, HNF2, and HNF3 based on their cytometric signatures (Fig. 1). The individual cell biovolumes determined after cell sorting of each of these populations were 3.9 ± 1.6 µm3 for HNF1, 36.9 ± 9.3 µm3 for HNF2, and 62.2 ± 41.1 µm3 for HNF3 µm3 (all sites and depths pooled). The calculated clearance rates were 0.4 ± 0.2, 3.7 ± 0.4 and 6.2 ± 1.3 nl HNF−1 h−1 for HNF1, HNF2, and HNF3, respectively. Size-specific clearance rates differed only slightly among bloom sites, and no significant differences between the Fe-fertilized sites and HNLC waters were detected (Mann–Whitney tests, p > 0.05). The relative abundances of these cytometrically identified subpopulations were similar among sites and throughout the water column accounting for roughly 46 % for HNF1, 52 % for HNF2, and 2 % for HNF3 of the total HNF abundance (Table 3). 3.3
Bacterial production, growth rates, respiration, and growth efficiency
BP and bacterial growth rates were 5.2 nmol C L−1 d−1 and 0.018 d−1 in the ML at station R-2, and they were overall higher in the Fe-fertilized region. BP ranged between 9.9 and 133.8 nmol C L−1 d−1 and bacterial growth rates varied between 0.025 and 0.210 d−1 (mean ML at stations A3-1 and F, respectively) (Fig. 4 and Table 4). At station A3, BP and bacterial growth rates increased 4- to 5fold between the first (9.9 nmol C L−1 d−1 and 0.025 d−1 , mean, ML) and the second visit (39.6 nmol C L−1 d−1 and 0.122−1 ). Within the stationary meander, BP and bacterial growth rates increased over time, from 30 nmol C L−1 d−1 and 0.068 d−1 at station E-1, to 54.7 nmol C L−1 d−1 and 0.116 d−1 at station E-5. The bacterial production below 200 m varied from 0.07 to 2.18 nmol C L−1 d−1 for all stations (mean 0.55 ± 0.40 nmol C L−1 d−1 ), which represented between 4.6 and 25 % (mean 16.5 ± 7.0 %) in Fe-fertilized stations, and 43 % at station R-2 of the 0– 1000 m integrated bacterial production (data not shown). Bacterial respiration rates varied by 8-fold among the Fefertilized sites, with lowest and highest rates at station Biogeosciences, 11, 6739–6753, 2014
6744
U. Christaki et al.: Microbial food web dynamics during spring phytoplankton blooms
Figure 2. Profiles of temperature and Chl a as derived from in vivo fluorescence for the reference HNLC station (R-2); A3 (first and second visit), F-L, E-4W; and E stations first (E-1), and last visit (E-5). Table 3. Bulk abundances and relative contributions of cytometrically identified subpopulations of virus-like particles (VLPs), heterotrophic bacteria (HB) and heterotrophic nanoflagellates (HNF). Mean values ±SD of three depth layers for the iron-fertilized sites (Fe) and the HNLC site (R-2) are given. %GF: percent high and low green fluorescence VLPs; %HNA and %LNA: percent high and low DNA containing HB. HNF-1, -2, -3 populations were discriminated by flow cytometry and sized by epifluorescence microscopy after cell-sorting in each cytometric group (see also Fig. S1). ML: mixed layer; ZML : depth of the mixed layer; ZML –200: bottom of the mixed layer to 200 m; > 200 m: below 200 m to the bottom of each station. Asterisks indicate significant differences between iron-fertilized sites and station R-2 (Mann–Whitney *: p < 0.05, **: p < 0.001 ***: p < 0.0001). Layer
ML ZML –200 m > 200 m
VLP (×109 L−1 ) R-2
Fe
R-2
Fe
R-2
1.7 ± 0.2 1.3 ± 0.2 0.4 ± 0.1
1.4 ± 0.2 1.1 ± 0.4 0.5 ± 0.1
19.6 ± 3.5 22.8 ± 4.3 22.8 ± 4.3
19.9 ± 2.6 21.9 ± 3.2 24.2 ± 2.4
79.8 ± 2.9 76.9 ± 4.2 77.2 ± 4.3
80.1 ± 2.6 78.1 ± 3.2 75.8 ± 2.4
%HNA
%LNA
Fe
R-2
Fe
R-2
Fe
R-2
4.7 ± 0.9 3.1 ± 0.4 1.2 ± 0.3
2.7 ± 0.3 2.1 ± 0.8 * 1.1 ± 0.2
59.0 ± 5.3 55.4 ± 1.1 56.7 ± 2.2
47.3 ± 2.5*** 53.5 ± 4.6 55.7 ± 2.1
41.5 ± 4.7 44.6 ± 1.1 43.3 ± 2.2
52.7 ± 2.5*** 46.5 ± 4.6 44.3 ± 3.7
HNF (103 L−1 )
ML ZML –200 m > 200 m
% Low GF
Fe
HB (×108 L−1 )
ML ZML –200 m > 200 m
% High GF
%HNF-1
%HNF-2
%HNF-3
Fe
R-2
Fe
R-2
Fe
R-2
Fe
R-2
903 ± 549 367 ± 122 84 ± 37
227 ± 71 * 170 ± 82 * 60 ± 26
49 ± 6 44 ± 10 46 ± 11
47 ± 5 45 ± 5 48 ± 6
48 ± 6 54 ± 10 53 ± 11
51 ± 4 52 ± 7 51 ± 2
3±3 2±2 1±2
2±4 3±3 1±1
E-1 (mean ML 0.23 ± 0.06 µmol C L−1 d−1 , n = 3) and E5 (1.73 µmol C L−1 d−1 , n = 1), respectively (Table 5). At the Fe-fertilized sites bacterial respiration accounted on average for 59 ± 20 % of dark community respiration. We estimated bacterial respiration at station R-2 to vary between 0.25 ± 12 µmol C L−1 d−1 (n = 4) (dark community respiration in unfiltered seawater) and 0.14 ± 0.07 µmol C L−1 d−1 (i.e the 59 % of dark community respiration) (Table 5). Due
Biogeosciences, 11, 6739–6753, 2014
to the lower contribution of phytoplankton and HNF to overall microplankton biomass in HNLC compared to Fefertilized waters, the contribution of bacterial to dark community respiration is likely to be higher at station R-2 than the mean value determined for the Fe-fertilized sites. We therefore use the respiration rate in unfiltered seawater as an upper estimate for bacterial respiration throughout the manuscript (Table 5). The cell-specific respiration revealed
www.biogeosciences.net/11/6739/2014/
U. Christaki et al.: Microbial food web dynamics during spring phytoplankton blooms
6745
Figure 3. Distribution of the abundance of virus (VLPs – virus-like particles), heterotrophic bacteria (HB), and heterotrophic nanoflagellates (HNF) along the north–south (TNS) and east–west transects (TEW; cf. Fig. 1) of KEOPS2. The red vertical line “PF” denotes the position of the polar front. Table 4. Bacterial production, cell-specific bacterial production, and bacterial growth rates in surface waters. Mean values ±SD for the mixed layer are given. Station R-2 A3-1 A3-2 F-L E-4W E-1 E-3 E-4E E-5
Number of samples (n) 4 5 5 2 3 3 2 2 2
Cell-specific BP (fmol C cell−1 d−1 )
µ(d−1 )
(nmol C L−1 d−1 ) 5.2 ± 0.2 9.9 ± 0.3 39.6 ± 1.3 133.8 ± 3.3 58.3 ± 3.4 30.3 ± 1.65 52.3 ± 3.4 83.0 ± 2.6 54.7 ± 4.0
0.019 ± 0.003 0.025 ± 0.007 0.126 ± 0.015 0.217 ± 0.005 0.097 ± 0.012 0.071 ± 0.002 0.098 ± 0.007 0.147 ± 0.009 0.119 ± 0.005
0.018 ± 0.003 0.025 ± 0.007 0.122 ± 0.015 0.210 ± 0.005 0.094 ± 0.012 0.068 ± 0.003 0.095 ± 0.006 0.143 ± 0.009 0.116 ± 0.005
BP
a similar pattern with lowest rates at stations E - 1 (mean ML 0.54 ± 0.13 fmol O2 cell−1 d−1 , n = 3), and highest rates at station E-5 (3.76 fmol O2 cell−1 d−1 , n = 1) (Table 5). BGE ranged between 3 and 18 % in the ML of the fertilized sites (mean 10 ± 5 %, n = 14). One exceptionally high value of 28 % at the base of the ML at station F-L was registered. At station R-2, BGE was 3 ± 1 % (n = 4) based on respiration rates in unfiltered seawater. Assuming BR accounts for 59 % of dark community respiration, as described above, would increase the BGE at stations R-2 to 4 ± 2 %.
www.biogeosciences.net/11/6739/2014/
3.4
Bacterial losses and viral production
The potential grazing capacity estimated by the clearance rates of HNF revealed losses of BP of 50, 70, and 85 % for the ML, the ZML –200 m, and the > 200 m layers, respectively (Fig. 5a). In surface waters (ML) the loss of BP due to grazing varied between ∼ 30 and ∼ 60 % at the fertilized stations, with the exception of station A3-1 where this value was 80 %. The BP loss due to grazing at station R-2 accounted for about 70 % of the bacterial production (Fig. 5a). BP loss due to viral lysis was comparatively low, and varied from Biogeosciences, 11, 6739–6753, 2014
6746
U. Christaki et al.: Microbial food web dynamics during spring phytoplankton blooms
Table 5. Bacterial respiration, cell-specific bacterial respiration, and growth efficiency (BGE) in surface waters. Mean values ±SE are given. At station R-2, respiration rates of unfiltered samples were used. (*) Bacterial respiration rates have been converted from O2 into C units using a RQ value of 1. Station
Depth (m)
Bacterial respiration (µmol C L−1 d−1 )∗
Cell-specific bacterial respiration (fmol C cell−1 d−1 )
BGE (%)
R-2
20 40 80 100
0.19 ± 0.09 0.40 ± 0.06 0.27 ± 0.08 0.12 ± 0.05
0.77 1.41 0.90 0.43
2±1 2±0 2±1 4±1
A3-2
20 50 70
0.61 ± 0.23 1.08 ± 0.51 0.19 ± 0.07
2.26 4.20 0.54
6±2 3±1 18+6
F-L
10 20 50
0.91 ± 0.50 1.82 ± 0.28 0.25 ± 0.23
1.50 3.00 0.39
13 ± 6 7±1 28 ± 19
E-4W
30 50
0.95 ± 0.51 0.84 ± 0.22
1.57 1.39
6±3 7±2
E-1
15 20 65
0.27 ± 0.17 0.26 ± 0.21 0.17 ± 0.30
0.62 0.60 0.40
11 ± 6 11 ± 8 15 ± 9
E-3
10 20 46
0.25 ± 0.34 0.96 ± 0.61 1.43 ± 0.32
0.49 1.89 2.83
17 ± 19 5±3 3±1
E-4E
30 50
0.72 ± 0.13 0.65 ± 0.44
1.28 1.16
11 ± 2 11 ± 7
E-5
20
1.73 ± 0.46
3.76
3±1
Figure 4. Bacterial production (nmol C L−1 d−1 ) at the main stations in the 0–200 m layer. Station R; A3-1, and 2; F-L, and E4W (a); and “E” stations (b).
Biogeosciences, 11, 6739–6753, 2014
undetectable to 24 % of BP in the ML (Fig. 5b). The viral induced loss of BP were 11, 2, and 2 % for the ML, ZML – 200 m, and > 200 m layers, respectively (Fig. 5b). A higher percent of viral mortality was encountered in the ML at stations E-4E, E-2, E-1, and R-2. Overall there was no difference in the percent loss of BP induced by grazing and viral lysis between the Fe-fertilized sites and the HNLC site R2 (Fig. 5a, b). The sum of bacterial mortality due to HNF grazing and viral lysis varied from 47 % at station E-1, to 100 % at stations E-3 and E-5. Together, grazing and viral lysis accounted for an average of 83 % bacterial mortality at all stations (Fig. 5a, b). The empirically estimated burst size of bacteria (BS) was 22 ± 15 virus cell−1 (mean ± SD, n = 30), and varied from 6 (A2, in the ML) to 88 (F-L, in the ZML –200 m) without any specific pattern related to Fefertilization or depth. Viral production (VP) calculated based on the BS and BP (Eq. 4) was 2 ± 1 and 0.34 ± 0.07 × 10⁸ viruses L−1 d−1 in the ML of the fertilized stations, and at station R-2, respectively. Combining these results revealed several significant relations (Table 6). In the ML, HB and BP were significantly related to Chl a. BP and the abundance of HNF were significantly related in the three layers considered, with BP
www.biogeosciences.net/11/6739/2014/
U. Christaki et al.: Microbial food web dynamics during spring phytoplankton blooms
80
60
60
60
40
40
40
20
20
20
0
0
0
30
30
25
25
25
20
20
20
15
15
15
10
10
10
5
5
5
0
(b)
*
Zm
0
*
* * *
R A3-1 A3-2 FL E4W E1 E2 E3 E4E E5
30
Zm-200
0
R A3-1 A3-2 FL E4W E1 E2 E3 E4E E5
100
80
Table 6. Determination coefficients (r 2 ) of log-log linear regressions of bacterial heterotrophic production (BP), viral production (VP), virus-like particles (VLPs), heterotrophic bacterial abundance (HB), heterotrophic nanoflagellates abundances (HNF) and chlorophyll a (Chl a). ML: mixed layer, *: p < 0.05, **: p < 0.001 ***: p < 0.0001, ns: not significant.
*
* * *
R A3-1 A3-2 FL E4W E1 E2 E3 E4E E5
100
80
R A3-1 A3-2 FL E4W E1 E2 E3 E4E E5
100
R A3-1 A3-2 FL E4W E1 E2 E3 E4E E5
120
R A3-1 A3-2 FL E4W E1 E2 E3 E4E E5
Loss of Bacterial Production (% )
(a)
120
120
>200
Figure 5. Heterotrophic nanoflagellate (a) and virus (b) mediated mortality of bacteria, as a percentage of bacterial production meaFigure 5 sured in the mixed layer (ML), from the bottom of the mixed layer to 200 m (ZML –200 m), and between 200 and 1000 m (> 200 m). The vertical line denotes the median value for each layer. Error bars in (a) indicate the standard deviation of the mean values of each layer. No error bars in (b) since the values are issue of TEM observations of the pooled samples in each layer (see also methods). *: undetectable, the % FVIC was < 0.4 resulting in negative values of %FIC (Eq. 1).
explaining up to 79 % of the HNF variability (r 2 = 0.79). While BP and VLP – except in the ZML –200 m layer – showed little relation, BP and VP showed highly significant relations in the first 200 m, and a weaker, but still significant relation in the deep layer. It is worth noting that the relations with VP were insignificant when an overall mean BS of 22 virus cell−1 was applied, but became highly significant when the specific BS for each sample was applied. VP and HB abundance were significantly related in the upper 200 m, however the determination coefficient was relatively low (r 2 = 0.5). The relation between BP and BR was significant with BP explaining ∼ 50 % of the BR variance (r 2 = 0.51). The relation between VP and BR was weaker, but still significant (r 2 = 0.32). Notably, there was no detectable relation between VP and VLP at any depth. The stocks of HB were significantly related to the stocks of VLP and HNF at all layers, with strongest relations between HB and HNF below the ML (Table 6).
4 4.1
Discussion Variability of the response, and comparison to other fertilization studies in the Southern Ocean
To date, six artificial mesoscale, and two detailed natural iron fertilization studies have been conducted in the Southern Ocean and microbial food web dynamics have been conwww.biogeosciences.net/11/6739/2014/
6747
Parameter 1
Parameter 2
n
r2
ML ZML –200 m 200–1000 m
BP
VP
27 41 24
0.86*** 0.66*** 0.25 *
ML
BP
BR
20
0.51 **
ML ZML –200 m 200–1000 m
BP
HB
27 61 51
0.51*** 0.83*** 0.43***
ML ZML –200 m 200–1000 m
BP
VLP
27 61 51
0.01 ns 0.17** 0.012 ns
ML ZML –200 m 200–1000 m
BP
HNF
27 61 51
0.68*** 0.79*** 0.20*
ML
BP
Chl a
27
0.57***
ML ZML –200 m 200–1000 m
VP
HB
27 41 24
0.50*** 0.47*** 0.01 ns
ML ZML –200 m 200–1000 m
VP
VLP
27 41 24
0.001 ns 0.02 ns 0.006 ns
ML
VP
BR
20
0.32*
ML ZML –200 m 200-1000 m
HB
VLP
27 61 51
0.29* 0.27*** 0.11*
ML ZML –200 m 200–1000 m
HB
HNF
27 61 51
0.20* 0.84*** 0.46***
ML
HB
Chl a
27
0.40*
Layer
sidered in part in these studies (Table 7). The most commonly determined microbial parameters, such as HB abundances and BP, are generally enhanced upon iron fertilization. However, remarkable variability in the extent of the response exists among different regions of the Southern Ocean (Table 7). During KEOPS2, a patchwork of blooms induced by large-scale natural iron fertilization above the plateau and in the oceanic region off Kerguelen Island was investigated (Blain et al., 2014). The results obtained from KEOPS2 add to previous studies by providing an extensive description of microbial food web dynamics during the onset of spring phytoplankton blooms under varying hydrographic and biogeochemical conditions. Biogeosciences, 11, 6739–6753, 2014
6748
U. Christaki et al.: Microbial food web dynamics during spring phytoplankton blooms
Table 7. Comparison of bacterial parameters following natural and artificial iron-fertilization. Ranges of bacterial abundance and production are given for the wind mixed layer of the respective study. All rates of bacterial production are derived from [3 H]leucine-incorporation, except for Hall and Safi (2001) who applied [3 H]thymidine-incorporation. Outside – values reported for HNLC waters; inside – values reported for iron-fertilized patches. –: not done, a BP values given in this paper as pM leu h−1 were converted into µg C L−1 d−1 according to Kirchman (1993), b not given in the paper, c calculated from cell production based on a 23.3 fg cell−1 used by the authors, d max. value in the patch, mean value outside the patch extrapolated from Fig. 10, Landry et al. (2000). Bacterial abundance (×108 cells L−1 )
Natural Southern Ocean
Artificial Southern Ocean
Subarctic Pacific
Equatorial Pacific
KEOPS2 (50◦ S, 72◦ E) KEOPS1 (50◦ S, 72◦ E) CROZEX (45◦ S, 50◦ E) EisenEx (48◦ S, 21◦ E) SOIREE (61◦ S, 140◦ E) SOFEX-North (56◦ S,172◦ W) SOFEX-South (66◦ S, 171◦ W) SAGE (46.5◦ S, 172.5◦ W) LOHAFEX (47◦ S ,16◦ W) SEEDS I (49◦ N, 165◦ E) SEEDS II (48◦ N, 166◦ E) IronEx II (5◦ S 105◦ W)
HNF abundance (×106 cellsŁ−1 )
Bacterial production (µg C L−1 d−1 )
Viral abundance (×109 cells L−1 )
Temp. (◦ C)
Time elapsed since start of bloom (d)
outside
inside
outside
inside
inside
inside
outside
inside
Reference
2
≈ 28
2.7
4.7
0.2
0.9
0.1
0.2–1.6
1.4
1.7
This study
3–4
≈ 60
2
6
0.8
1.1
0.5
1.1–3
3.9
12.5
6
≈ 60
5
9
–
–
0.42
3.6
–
–
Christaki et al. (2008); Bonilla-Findji et al. (2008) Zubkov et al. (2007)
3–4
22
3–4
2–6
–
–
0.2–0.5
0.2–1
2.1
4.3
2
13
2–4
2–4
0.4
1.1
< 0.5
0.4–1.1
–
–
Arrieta et al. (2004); Weinbauer et al. (2009) Hall and Safi (2001)
7
40
4–5
7–10
–
–
0.2
0.4
–
–
Oliver et al. (2004)
−1
22
3
3–5
–
–
0.2
0.2–0.3
–
–
Oliver et al. (2004)
11.5
15
0.9–3.2
1.2–1.7
–
–
0.9
0.4–1.4
–
–
Kuparinen et al. (2011)
7
18
1.1–1.4
1.1–1.4
–
–
1
1–2a
–
–
Thiele et al. (2012) Suzuki et al. (2005); Saito et al. (2005) Higgins et al. (2009)
6–9
13
5
8
2.1
5.8
–
–
–
–
8–12
12
4–7
5–10
–
–
b
2–7c
23–45
22–64
25
14
7
11
∼2
3.9d
2–3
2–8
–
–
Natural iron fertilization of the Southern Ocean induced rapid responses of members and fluxes of the microbial food web. The intensity of the response and its variability among sites were most pronounced in the 200 m surface layer, and this likely reflects the hydrographic and biogeochemical characteristics at the given sites. The depth of the mixed layer (ZML ) varied considerably, extending down to 170 m above the plateau at station A3, and to 40 m north of the polar front at station F-L. To note that although surface Chl a concentration, which is a proxy for phytoplankton biomass, varied by a factor of 6 in the ML among sites, the integrated Chl a at A3-2 and F-L stations were similar (Lasbleiz et al., 2014). Noticeable differences in surface temperature, a key factor that drives microbial metabolism, were also detected in the ML (1.6–4.2 ◦ C). Our results showed the BP response to be strong and varied, accounting for increases of mean values in the ML of up to 13-fold between bloom stations (e.g. A3-1 compared to F-L, Table 4), and up to 26fold between bloom stations and HNLC station R-2 (e.g. FL compared to R-2, Table 4). This enhancement in BP, together with that observed during CROZEX (9-fold; Zubkov et al., 2007) and KEOPS1 (6-fold; Christaki et al., 2008), was much higher than the enhancement reported from artificial fertilization experiments (roughly 2-fold; Table 7). During KEOPS2, BR was up to 8-fold enhanced by iron fertilization and varied by a factor of 8 among sites among bloom stations. During the late bloom phase, above the
Biogeosciences, 11, 6739–6753, 2014
Landry et al. (2000); Cochlan (2001)
plateau, bacterial respiration was about 3-fold higher in the bloom than in HNLC waters (Obernosterer et al., 2008), but to the best of our knowledge, no BR rates are available for comparison from other fertilization studies in the Southern Ocean. In contrast to bacterial metabolism, the abundance of HB increased overall to a lesser extent (roughly 2-fold), and thus similarly to those reported previously in natural and artificial iron fertilization studies (Table 7). Besides bulk abundance, the %HNA bacteria were also significantly higher in the ML of fertilized stations (59 %) relative to the HNLC reference site R-2 (47 %; Table 3). Oliver et al. (2004) reported a relatively minor increase of the fraction of HNA cells (up to 45 %) within the iron-fertilized patch during SOFeX. By contrast, the % HNA bacteria accounted for up to 80 % of total bacterial abundance at the late stage of the Kerguelen bloom at station A3 (Obernosterer et al., 2008). The smaller increase in HB abundance indicates efficient top-down control of these members of the microbial food web that are markedly stimulated by natural iron fertilization. Although HNF showed significantly higher abundances in the 200 m surface layer in the fertilized stations compared to station R-2, the HNF size distribution, resulting from sorted cell observations, was remarkably stable, with the two smaller sized populations contributing > 45 % each, at all stations and depths (Table 3). The few existing studies reporting on viral abundance during iron fertilization experiments
www.biogeosciences.net/11/6739/2014/
U. Christaki et al.: Microbial food web dynamics during spring phytoplankton blooms (Higgins et al., 2009; Weinbauer et al., 2009) have pointed to a higher viral stock in fertilized stations. However, this was not the case in the present study, where the total number of VLPs was similar in fertilized sites and HNLC waters. On average ∼ 80 % of the VLPs during KEOPS2 showed low green fluorescence, and were most probably bacteriophages. The high green fluorescence VLPs represented ∼ 20 % of total VLPs in the study area, and according to Brussaard et al. (2008); this group may represent larger algal viruses. Although viral stocks did not differ across stations in this study, VP was about 6 times higher in the ML of the fertilized stations compared to HNLC waters. This result is in line with observations from the late bloom phase (KEOPS1, Malits et al., 2014) and artificial iron fertilization experiments (Higgins et al., 2009; Weinbauer et al., 2009). Contrary to previous observations (Weinbauer et al., 2009), the trend of higher bacterial and viral production in iron-fertilized waters was not accompanied by a higher virus induced loss of BP. Lysogeny was not considered in the present study. The proportion of the lysogenized bacterial population can vary extensively from undetectable to 100 % (Weinbauer and Suttle, 1996; Williamson et al., 2002). Across a system study, lysogeny was highest in deep sea waters (Weinbauer et al., 2003) where the contact rate between infective phages and hosts is too low to sustain the lytic lifestyle (Paul et al., 2002). The only study on lysogeny during artificial Fe-fertilization experiments in the Southern Ocean did not observe differences inside and outside the patch (Weinbauer et al., 2009). During KEOPS1 the fraction of lysogenic cells was 8 and 6 % of the total bacterial cells infected by viruses in the bloom, and in HNLC waters, respectively (Malits et al., 2014). Based on these observations (Weinbauer, 2009, Malits et al., 2014), and this paper’s independently obtained results (such as the low viral abundance and the low frequency of infected cells) supports the idea that the loss of BP due to lysis was low at the onset of the phytoplankton bloom. Notably, viruses and HNF revealed opposite vertical trends, with HNF grazing increasing and viral lysis decreasing with depth. 4.2
Microbial food web dynamics in response to iron fertilization
The extent of change of the microbial parameters considered in the present study at different fertilized sites across variable hydrographic and biological regimes appears to have been induced primarily by changes in heterotrophic bacterial activity. Based on the microbial parameters obtained during this study, the following scenario is proposed: typical Southern Ocean characteristics are low phytoplankton biomass and low rates of BP, as was the case at stations R-2 and A3-1. Fe-fertilization stimulates BP; either directly or indirectly, through phytoplankton derived DOM. For the KEOPS2 study region, bottle incubation experiments revealed that both single additions of Fe and C, in the form of glucose, stimulated bacterial heterotrophic production and www.biogeosciences.net/11/6739/2014/
6749
growth, suggesting co-limitation by these elements (Obernosterer et al., 2014). The strong correlation between BP, VP, and HNF abundance, and the correlation between VP and HB, suggests that the enhanced BP drives HNF and viral activity. However, the overall loss of BP due to grazing and lysis decreases upon Fe fertilization (to about 50 % of BP), indicating that bacterial growth rates are higher than loss rates, allowing the build-up of bacterial biomass. A notable aspect is that HNF responded more rapidly, and grazing became the dominant top-down factor at the early bloom stage. This pattern contrasts to observations from the late bloom stage, where viralinduced lysis accounted for most of the bacterial loss (Malits et al., 2014). This scenario agrees with observations of rapid growth of HNF at low temperatures (Duarte et al., 2005), and the “kill the winner” model (Thingstad, 2000) that predicts viruses to rise following blooms of their specific bacterial hosts. Indeed, the composition of the bacterial community changed markedly during the bloom above the plateau (West et al., 2008; Obernosterer et al., 2011). Taken together, these results suggest that the mechanism of natural fertilization through the continuous supply of iron strongly affects bacterial heterotrophic metabolism, and as a consequence HNF grazing, with important consequences for the cycling of carbon through the microbial food web. 4.3
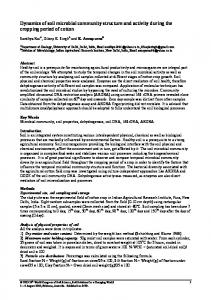
Implications of microbial food web dynamics for carbon cycling in the bloom above the Kerguelen plateau
The investigation of the spring phytoplankton bloom located in the southeastern part above the Kerguelen plateau during two distinct phases has provided, for the first time, insight into seasonal dynamics of the microbial food web functioning in the context of natural Fe fertilization of the Southern Ocean. Combining our results with rates of primary production, mesozooplankton activity, and export determined during the KEOPS project allowed us to propose a budget for the flow of carbon through microbial and higher trophic levels in the southeastern bloom (A3 station, Fig. 6). The main purpose of the carbon budget presented here (Fig. 6) is to place the microbial loop in the context of the food web and to compare the fluxes to the potential export and/or accumulation of phytoplankton biomass during the early and late phases of the bloom. Gross community production (GCP) integrated over the ML was about 3.6-fold higher during the early (344 mmol C m−2 d−1 ) than the late bloom phase (95 mmol C m−2 d−1 , Fig. 6), however, the fraction of GCP that passed through heterotrophic bacteria, that is the bacterial carbon demand (BCD), increased from 21 % at the onset of the bloom to 44 % at the late bloom stage (BCD absolute values, 72 and 42 mmol C m−2 d−1 , Fig. 6). BR revealed also marked seasonal differences (Fig. 6). The higher rates of respiration at the onset of the bloom Biogeosciences, 11, 6739–6753, 2014
6750
U. Christaki et al.: Microbial food web dynamics during spring phytoplankton blooms Virus
Virus
0.2
6 3
Bacteria
HNF
66
72
95
Phytoplankton
Meso zooplankton
200
DIC
1.5
Phytoplankton
HNF
33
42
DIC
1.5
344
3
Bacteria
Meso zooplankton
32
12.5
6.5
~0
220-440 ?
?
?
200m
?
200m 4
25
Figure 6. Schematic presentation of the carbon flow through the microbial and higher trophic level food webs during the early (KEOPS2) and late stage of the bloom (KEOPS1) at the southeast bloom above the Kerguelen plateau (station A3). KEOPS1 values are the mean obtained from four consecutive visits at station A3, except for dark community respiration for which only the first three visits were considered. Black arrows indicate the transfer of carbon between microbial and/or higher trophic level food web components, and export. Dashed black arrows going back to “phytoplankton” and “mesozooplankton” indicate possible accumulation of their biomass per day once the respiration and export were subtracted (for details cf. Sect. 4.3). Arrows in grey indicate rates of respiration. Numbers in italics are based on the following estimations: (i) the transfer from HNF to mesozooplankton is calculated from bacterial grazing assuming a 50 % transfer efficiency. (ii) the mesozooplankton ingestion and respiration rates were calculated from the respective rates during the late bloom phase and extrapolated according to the depth of the mixed layer (ZML ). All fluxes are integrated over the ML and units are mmol C m−2 d−1 . Late bloom data from Carlotti et al. (2008), Christaki et al. (2008), Lefèvre et al. (2008), Obernosterer et al. (2008), Savoye et al. (2008) and Malits et al. (2014). Early bloom data from Planchon et al. (2014) and Carlotti et al. (2014) for GCP the O2 -measured fluxes have been converted into C-fluxes using PQ = 1.8 KEOPS2 unpublished data. DIC: dissolved inorganic carbon, ZML : depth of the mixed layer.
(66 mmol C m−2 d−1 , Fig. 6) as compared to the late bloom stage (33 mmol C m−2 d−1 , Fig. 6) result mainly from the deeper ZML (153 m vs. 67 m), because on a volumetric basis, rates were in a similar range during both bloom phases (cf. Obernosterer et al., 2008). The ratios between the BCD and GCP were in the same range at the different phytoplankton bloom sites (BCD : GCP ∼ 0.1–0.5), and overall lower than those observed during the late bloom phase (BCD : GCP ∼ 0.3–0.7) (Table 1 in the Supplement). These latter estimates are similar to those reported for spring phytoplankton blooms in the polar frontal zone, the marginal ice zone, and the southern Antarctic Circumpolar Current (0.3 to 0.6; Lochte et al., 1997). To estimate the fraction of primary production that is processed by heterotrophic bacteria most studies report on the ratio BP : PP. For KEOPS, this ratio was on average 0.04 ± 0.02 for the early phytoplankton blooms compared to an average of 0.10 ± 0.03 for the late bloom phase at station A3 (Table 1 in the Supplement). At the HNLC site R-2 the BP : PP ratio was 0.045. Except for the late bloom stage at A3, the ratios reported here are in the same range as those reported for the Ross Sea (0.04; Ducklow, 2000) and the Arctic Ocean, when pri-
Biogeosciences, 11, 6739–6753, 2014
mary production was greater than 10 mmol C m−2 d−1 (0.06, Kirchman et al., 2009). Even though the absolute values of BP transferred to HNF and to mesozooplankton were the same during the early and the late bloom (3 and 1.5 mmol C m−2 d−1 , respectively, Fig. 6) the grazing induced consumption of BP was more important during the early than the late phase of the bloom (50 and 36 %, respectively). Interestingly, viral activity showed the opposite pattern, since viral induced mortality changed significantly over time, becoming the dominant top-down control of BP during the late bloom phase (Fig. 6, Malits et al., 2014). This suggests that a larger proportion of BP was channelled to HNF and to higher trophic levels during the early bloom, while most of BP returns to DOM through the viral shunt during the late bloom (Wilhelm and Suttle, 1999). These contrasting scenarios have important implications for organic matter and nutrient cycling. During the early stage of the bloom, the different loss terms of GCP were bacterial: (i) (66 mmol C m−2 d−1 ), other microplankton (41+1.5 mmol C m−2 d−1 ) and mesozooplankton (24 mmol C m−2 d−1 ) respiration, (ii) 0.2 mmol C m−2 d−1 to dissolved pool through bacteria lysis and, (iii) while 11 (i.e ingestion – respiration of
www.biogeosciences.net/11/6739/2014/
U. Christaki et al.: Microbial food web dynamics during spring phytoplankton blooms microzooplankton) and 1.5 mmol C m−2 d−1 , respectively, were transferred directly or through the microbial food web to mesozooplankton for biomass accumulation or export through faecal pellet production. Subtracting the sum of the above terms from GCP yields 200 mmol C m−2 that remained available in the water column for phytoplankton biomass accumulation and/or export (Fig. 6). Comparison to the POC flux (4 mmol C m−2 d−1 at 200 m, Planchon et al., 2014), indicates that a minor fraction of this GCP was exported during the early stage of the bloom. Assuming the accumulation of the POC stock (2190 mmol C m−2 , Lasbleiz et al., 2014) over 5–10 days provides an estimate for phytoplankton biomass accumulation of 220–440 mmol C m−2 d−1 (Fig. 6). During the late stage of the bloom, organic carbon lost through bacterial, micro- and mesozooplankton respiration amounted to 51 mmol C m−2 d−1 , while 5 and 1.5 mmol C m−2 d−1 , respectively, were transferred directly or indirectly to mesozooplankton. Thus, 32 mmol C m−2 of GCP were not processed in the water column (Fig. 6). This value is similar to the POC flux of 25 mmol C m−2 d−1 at 200 m (Savoye et al., 2008), and thus our carbon budget indicates a negligible potential for phytoplankton biomass accumulation during the late bloom phase (Fig. 6). Primary production was measured at one time point during the onset of the bloom at A3 station, and the error associated to the integrated flux is 10 %. Daily fluxes are more likely variable due to the influence of environmental factors, such as light intensity, which could in part account for the observed discrepancy. Concluding, the concurrent investigation of several parameters has provided insight into two key roles of heterotrophic bacteria, and the microbial food web functioning, at the onset and late phase of the spring phytoplankton bloom induced by natural iron fertilization in the Southern Ocean. First, during the early bloom phase the tight link between HNF and heterotrophic bacteria resulted in a more efficient transfer of the BP towards the higher trophic levels. Even though the amount of bacterial carbon transferred did not represent a major flux, it accounted for a larger percentage of BP. Second, the bacterial response was dominated by an increase in respiration that was not accompanied by a respective enhancement of BP, pointing to an inefficient utilization of DOM at the onset of the bloom. Due to the low BGE, and the deep mixed layer above the plateau, heterotrophic bacteria represent a major source of CO2 at the early bloom phase. This picture differs from that obtained during the late bloom phase, where BGE was higher, but the viral shunt prevented an efficient transfer of the BP to higher trophic levels. This study highlights the variability of the bacterial contribution to organic matter remineralization and export according to the trophic dynamics at different seasons, underlying varying mechanisms channelling organic matter. To improve our understanding of microbial dynamics, further investigation into time series over the season will be necessary in order to www.biogeosciences.net/11/6739/2014/
6751
determine the timing and factors that induce the changes in channelling organic matter in the upper ocean. The Supplement related to this article is available online at doi:10.5194/bg-11-6739-2014-supplement.
Acknowledgements. KEOPS was financed by INSU-CNRS, IPEV and ANR and the French Ministry of Higher Education through a PhD grant. We thank our many colleagues who participated in the collection of various data sets, the KEOPS coordinator S. Blain, the chief scientist on board B. Quéguiner and the crew aboard the R/V Marion Dufresne for their help in the successful completion of the cruise. We also thank www.englisheditor.webs.com for the paper’s English proofing. The colour products for the Kerguelen area were produced by Ssalto/Duacs and CLS with support from Cnes. Edited by: B. Quéguiner
References Arrieta, J. M., Weinbauer, M. G., Lute, C., and Herndl, G. J.: Response of bacterioplankton to iron fertilization in the southern ocean, Limnol. Oceanogr., 49, 799–808, 2004. Binder, B.: Reconsidering the relatioship between virally indiced bacterial mortality and frequency of infected cells, Aquat. Microb. Ecol., 18, 207–215, 1999. Blain, S., Quéguiner, B., Armand, L., Belviso, S., Bombled, B., Bopp, L., Bowie, A., Brunet, C., Brussaard, C., Carlotti, F., Christaki, U., Corbiere, A., Durand, I., Ebersbach, F., Fuda, J. L., Garcia, N., Gerringa, L., Griffiths, B., Guigue, C., Guillerm, C., Jacquet, S., Jeandel, C., Laan, P., Lefèvre, D., Lo Monaco, C., Malits, A., Mosseri, J., Obernosterer, I., Park, Y. H., Picheral, M., Pondaven, P., Remenyi, T., Sandroni, V., Sarthou, G., Savoye, N., Scouarnec, L., Souhaut, M., Thuiller, D., Timmermans, K., Trull, T., Uitz, J., van Beek, P., Veldhuis, M., Vincent, D., Viollier, E., Vong, L., and Wagener, T.: Effect of natural iron fertilization on carbon sequestration in the southern ocean, Nature, 446, 1070– 1074, 2007. Blain, S., Quéguiner, B., and Trull, T.: The natural iron fertilization experiment keops (kerguelen ocean and plateau compared study): An overview, Deep-Sea Res. Pt. II, 55, 559–565, 2008. Blain, S., Oriol, L., Capparos, J., Guéneuguès, A., and Obernosterer, I.: Distributions and stoichiometry of dissolved nitrogen and phosphorus in the iron fertilized region near Kerguelen (Southern Ocean), this volume, 2014. Bonilla-Findji, O., Malits, A., Lefèvre, D., Rochelle-Newall, E., Lemée, R., Weinbauer, M. G., and Gattuso, J.-P.: Viral effects on bacterial respiration, production and growth efficiency: Consistent trends in the southern ocean and the mediterranean sea, Deep-Sea Res. Pt. II, 55, 790–800, 2008. Boyd, P. W., Jickells, T., Law, C. S., Blain, S., Boyle, E. A., Buesseler, K. O., Coale, K. H., Cullen, J. J., de Baar, H. J. W., Follows, M., Harvey, M., Lancelot, C., Levasseur, M., Owens, N. P. J., Pollard, R., Rivkin, R. B., Sarmiento, J., Schoemann, V.,
Biogeosciences, 11, 6739–6753, 2014
6752
U. Christaki et al.: Microbial food web dynamics during spring phytoplankton blooms
Smetacek, V., Takeda, S., Tsuda, A., Turner, S., and Watson, A. J.: Mesoscale iron enrichment experiments 1993–2005: Synthesis and future directions, Science, 315, 612–617, 2007. Brussaard, C. P. D.: Optimization of procedures for counting viruses by flow cytometry, Appl. Environ. Microbiol., 70, 1506–1513, 2004. Brussaard, C. P. D., Timmermans, K. R., Uitz, J., and Veldhuis, M. J. W.: Virioplankton dynamics and virally induced phytoplankton lysis versus microzooplankton grazing southeast of the kerguelen (southern ocean), Deep-Sea Res. Pt. II, 55, 752–765, 2008. Carlotti, F., Botha, D., Nowaczyck, A., and Lefèvre, D.: Structure, biomass, feeding and respiration of the mesozooplankton community during KEOPS, Deep-Sea Res. Pt. II, 55, 720–733, 2008. Carlotti, F., Jouandet, M.-P., Nowacsyk, A., Harmelin-Vivien, M., Lefèvre, D., Guillou, G., Zhu, Y., and Zhou, M.: Mesozooplankton structure and functioning during the onset of the Kerguelen Bloom during Keops2 survey, this volume, 2014. Christaki U., Giannakourou, A., Van Wambeke, F., and Gregori, G.: Nanoflagellate predation on auto- and heterotrophic picoplankton in the oligotrophic Mediterranean Sea, J. Plankton Res., 23, 1297–1310, 2001 Christaki, U., Obernosterer, I., Van Wambeke, F., Veldhuis, M., Garcia, N., and Catala, P.: Microbial food web structure in a naturally iron fertilized area in the southern ocean (Kerguelen plateau), Deep-Sea Res. Pt. II, 55, 706–719, 2008. Christaki, U., Courties, C., Massana, R., Catala, P., Lebaron, P., Gasol, P., and Zubkov, M. V.: Optimized routine flow cytometric enumeration of heterotrophic flagellates using SYBR Green I, Limnol. Oceanogr. Methods, 9, 329–339, 2011. Closset, I., Lasbleiz, M., Leblanc, K., Quéguiner, B., Cavagna, A.J., Elskens, M., Navez, J., and Cardinal, D.: Seasonal evolution of net and regenerated silica production around a natural Fefertilized area in the Southern Ocean estimated with Si isotopic approaches, Biogeosciences, 11, 5827–5846, doi:10.5194/bg-115827-2014, 2014. Cochlan, W. P.: The heterotrophic bacterial response during a mesoscale iron enrichment experiment (ironex II) in the eastern equatorial pacific ocean, Limnol. Oceanogr., 46, 428–435, 2001. de Baar, H. J. W., Boyd, P. W., Coale, K. H., Landry, M. R., Tsuda, A., ASSMY, P., Bakker, D. C. E., Bozec, Y., Barber, R. T., Brzezinski, M. A., Buesseler, K. O., Boye, M., Croot, P. L., Gervais, F., Gorbunov, M. Y., Harrison, P. J., Hiscock, M. R., Laan, P., Lancelot, C., Law, C. S., Levasseur, M., Marchetti, A., Millero, F. J., Nishioka, J., Nojiri, Y., van Oijen, T., Riebesell, U., Rijkenberg, M. J. A., Saito, H., Takeda, S., Timmermans, K. L., Veldhuis, M. J. W., Waite, A. M., and Wong, C. S.: Synthesis of iron fertilization experiments: From the iron age in the age of enlightenment, J. Geophys. Res., 110, C09S16, doi:10.1029/2004JC002601, 2005. Duarte, C. M., Agusti, S., Vaqué, D., Agawin, N. S. R., Felipe, J., Casamyor, E., and Gasol, J. M.: Experimental test of bacteria–phytoplankton coupling in the Southern Ocean, Limnol. Oceanogr., 50, 1844–1854, 2005. Ducklow, H.: Bacterial production and biomass in the oceans, in: Microbial Ecology of the Oceans, edited by: Kirchman, D. L., Wiley-Liss, Inc., 85–121, 2000. Fenchel, T.: Ecology of heterotrophic microflagellates II, Bioenergetics and growth, Mar. Ecol. Prog. Ser., 8, 225–231, 1982.
Biogeosciences, 11, 6739–6753, 2014
Fukuda, R., Ogawa, H., Nagata, T., and Koike, I. I.: Direct determination of carbon and nitrogen contents of natural bacterial assemblages in marine environments, Appl. Environ. Microbiol., 64, 3352–3358, 1998. Hall, J. A. and Safi, K.: The impact of in situ Fe fertilisation on the microbial food web in the Southern Ocean, Deep-Sea Res. Pt. II, 48, 2591–2613, 2001. Higgins, J. L., Kudo, I., Nishioka, J., Tsuda, A., and Wilhelm, S. W.: The response of the virus community to the seeds ii mesoscale iron fertilization, Deep-Sea Res. Pt. II, 56, 2788–2795, 2009. Kirchman, D. L., Morán, X. A. G., and Ducklow, H.: Microbial growth in the polar oceans – role of temperature and potential impact of climate change, Nat. Rev. Microbiol., 7, 451–459, 2009. Kirchman, D. L.: Leucine incorporation as a measure of biomass production by heterotrophic bacteria, in: Handbook of methods in aquatic microbial ecology, edited by: Kemp, P. F., Sherr, B. F., Sherr, E. B., and Cole, J. J., Lewis Publishers, Boca Raton, F-L, 509–512, 1993. Kuparinen, J., Hall, J., Ellwood, M., Safi, K., Peloquin, J., and Katz, D.: Bacterioplankton responses to iron enrichment during the SAGE experiment, Deep-Sea Res. Pt. II, 58, 800–807, 2011. Landry, M. R., Ondrusek, M. E., Tanner, S. J., Brown, S. L., Costantinou, J., Bidigare, R. R., Coale, K. H., and Fitzwater, S.: Biological response to iron fertilization in the eastern equatorial Pacific (IronEx II), I. Microplankton community abundances and biomass, Mar. Ecol. Prog. Ser., 201, 27–42, 2000. Lasbleiz, M., Leblanc, K., Blain, S., Ras, J., Cornet-Barthaux, V., Hélias Nunige, S., and Quéguiner, B.: Pigments, elemental composition (C, N, P, and Si), and stoichiometry of particulate matter in the naturally iron fertilized region of Kerguelen in the Southern Ocean, Biogeosciences, 11, 5931–5955, doi::10.5194/bg-115931-2014, 2014. Lefèvre, D., Guigue, C., and Obernosterer, I.: The metabolic balance during a phytoplankton bloom induced by natural iron fertilization in the Southern Ocean (Kerguelen Plateau), Deep-Sea Res. Pt. II, 55, 766–776, 2008. Lochte, K., Bjørnsen, P. K., Giesenhagen, H., and Weber, A.: Bacterial standing stock and production and their relation to phytoplankton in the Southern Ocean, Deep-Sea Res. Pt. II. 44, 321– 340, 1997. Malits, A., Christaki, U., Obenosterer, I., and Weinbauer, M. G.: Enhanced viral production and virus-mediated mortality of bacterioplankton in a natural iron-fertilized bloom event above the Kerguelen Plateau, this volume, 2014. Marie, D., Brussaard, C., Partensky, F., and Vaulot, D.: Flow cytometric analysis of phytoplankton, bacteria and viruse, in: Current Protocols in Cytometry, John Wiley and Sons, edited by: Robinson, J., Inc, New York., 1–15, 1999. Martin, J. H. and Fitzwater, S. E.: Iron deficiency limits phytoplankton growth in Antarctic waters, Global Biogeochem. Cy., 4, 5– 12, 1990. Middelboe, M. and Lyck, P. G.: Regeneration of dissolved organic matter by viral lysis in marine microbial communities, Aquat. Microb. Ecol., 27, 187–194, 2002. Obernosterer, I., Christaki, U., Lefèvre, D., Catala, P., Van Wambeke, F., and Lebaron, P.: Rapid bacterial mineralization of organic carbon produced during a phytoplankton bloom induced by natural iron fertilization in the southern ocean, Deep-Sea Res. Pt. II, 55, 777–789, 2008.
www.biogeosciences.net/11/6739/2014/
U. Christaki et al.: Microbial food web dynamics during spring phytoplankton blooms Obernosterer, I., Catala, P., Lebaron, P., and West, N.: Distinct bacterial groups contribute to carbon cycling during a naturally fertilized phytoplankton bloom in the Southern Ocean, Limnol. Oceanogr., 55, 2391–2401, 2011. Obernosterer, I., Fourquez, M., and Blain, S.: Fe nad C co-limitation of heterotrophic bacterial activity in the naturally fertilized region off Kerguelen island, this volume, 2014. Oliver, J. L., Barber, R. T., Smith Jr., W. O., and Ducklow, H. W.: The heterotrophic bacterial response during Southern Ocean Iron Experiment (SOFeX), Limnol. Oceanogr. 49, 2129–2140, 2004. Paul, J. H., Sullivan, M. B., Segall, A. M., and Rohwer, F.: Marine phage genomics, Comp. Biochem. Physiol. B, 133, 463– 476, 2002. Park, Y. H., Durand, I., Kestenare, E., Rougier, G., Zhou, M., d’Ovidio, F., Cotté, C., and Lee J. H.: Polar front around the Kerguelen islands: An up-to-date determination and associated circulation of surface/subsurface water, J. Geophys. Res.-Oceans, 119, 1–18, doi:10.1002/2014JC010061, 2014. Planchon, F., Ballas, D., Cavagna A. J., Van Der Merwe, P., Bowie, A., Trull, T., Laurenceau, E., Davis, D., and Dehairs, F.: Carbon export in the naturally iron fertilized Kerguelen area of the Southern Ocean using 234Th-based approach, in prep., 2014. Pollard, R., Salter, I., Sanders, R., Lucas, M., Moore, C., Mills, R., Statham, P., Allen, J., Baker, A., and Fones, G.: Southern Ocean deep-water carbon export enhanced by natural iron fertilization, Nature, 457, 577–581, 2009. Quéroué, F., Sarthou, G., Planquette, H. F., Bucciarelli, E., Chever, F., van der Merwe, P., Lannuzel, D., Townsend, A. T., Cheize, M., Blain, S., d’Ovidio, F., and Bowie, A. R.: High variability of dissolved iron concentrations in the vicinity of Kerguelen Island (Southern Ocean), this volume, 2014. Sackett, O., Armand, L., Beardall, J., Hill, R., Doblin, M., Connelly, C., Howes, J., Stuart, B., Ralph, P., and Heraud, P.: Taxonspecific responses of Southern Ocean diatoms to Fe enrichment revealed by synchrotron radiation FTIR microspectroscopy, Biogeosciences, 11, 5795–5808, doi:10.5194/bg-11-5795-2014, 2014. Saito, H., Suzuki, K., Hinuma, A., Takahashi, O., Fukami, K., Kiyosawa, H., Saino, T., Saino, T., and Tsuda, A.: Responses of microzooplankton to in situ iron fertilization in the western subarctic Pacific (SEEDS), Prog. Oceanogr., 64, 223–236, 2005. Savoye, N., Trull, T. W., Jacquet, S. H. M., Navez, C. M. J., and Dehairs, F.: 234Th-based export fluxes during a natural iron fertilization experiment (KEOPS), Deep-Sea Res. Pt. II, 55, 841–855, 2008. Smetacek, V., Klaas, C., Strass, V. H., Assmy, P., Montresor, M., Cisewski, B., Savoye, N., Webb, A., D’ Ovidio, F., Arrieta, J.M., Bathmann, U., Bellerby, R., Berg, G.M., Croot, P., Gonzalez, S., Henjes, J., Herndl, G. J., Hoffmann, L. J., Leach, H., Losch, M., Mills, M. M., Neill, C., Peeken, I., Röttgers, R., Sachs, O., Sauter, E., Schmidt, M. M., Schwarz, J., Terbrüggen, A., and Wolf-Gladrow, D.: Deep carbon export from a Southern Ocean iron-fertilized diatom bloom, Nature, 487, 313–319, 2012.
www.biogeosciences.net/11/6739/2014/
6753
Suzuki, K., Hinuma, A., Saito, H., Kiyosawa, H., Liu, H., Saino, T., and Tsuda, A.: Responses of phytoplankton and heterotrophic bacteria in the northwest subarctic Pacific to in situ iron fertilization as estimated by HPLC pigment analysis and flow cytometry, Prog. Oceanogr., 64, 167–187, 2005. Thiele, S., Fuchs, B. M., Ramaiah, N., and Amman, R.: Microbial community response during the Iron Fertilization Experiment LOHAFEX, Appl. Environ. Microbiol., 78, 8803–8812, doi:10.1128/AEM.01814-12, 2012. Thingstad, T. F.: Elements of a theory for the mechanisms controlling abundance, diversity, and biogeochemical role of lytic viruses in aquatic systems, Limnol. Oceanogr., 45, 1320–1328, 2000. Weinbauer, M. G. and Suttle, C. A.: Potential significance of lysogeny to bacteriophage production and bacterial mortality in coastal waters of the gulf of mexico, Appl. Environ. Microbiol., 62, 4374–4380, 1996. Weinbauer, M., Winter, C., and Höfle, M.: Reconsidering transmission electron microscopy based estimates of viral infection of bacterioplankton using conversion factors derived from natural communities, Aquat. Microb. Ecol., 27, 103–110, 2002. Weinbauer, M. G., Brettar, I., and Höfle, M. G.: Lysogeny and virus-induced mortality of bacterioplankton in surface, deep, and anoxic marine waters, Limnol. Oceanogr., 48, 169–177, 2003. Weinbauer, M. G., Arrieta, J. M., Griebler, C., and Herndl, G. J.: Enhanced viral production and infection of bacterioplankton during an iron induced phytoplankton bloom in the southern ocean, Limnol. Oceanogr., 54, 774–784, 2009. West, N., Obernosterer, I., Zemb, O. and Le Baron, P.: Major difference of baterial diversity and activity inside and outside of a natural iron-fertilizes phytoplankton bloom in the Southern Ocean, Environ. Microbiol., 10, 738–756, 2008. Wilhelm, S. W. and Suttle, C. A.: Virus and nutrient cycles in the sea, BioScience, 49, 781–787, 1999. Williamson, S. J., Houchin, L. A., McDaniel, L., and Paul, J. H.: Seasonal variation in lysogeny as depicted by prophage induction in tampa bay, florida, Appl. Environ. Microbiol., 68, 4307–4314, 2002. Zubkov, M. V., Holland, R. J., Burkill, P. H., Croudache, I. W., and Warwick, P. E.: Microbial abundance, activity and iron uptake in vicinity of Crozet isles in November 2004–January 2005, DeepSea Res. Pt. II, 54, 2126–2137, 2007.
Biogeosciences, 11, 6739–6753, 2014