AQUATIC MICROBIAL ECOLOGY Aquat Microb Ecol
Vol. 31: 145–161, 2003
Published March 13
Short-term variability in microbial food web dynamics in a shallow tidal estuary Arantza Iriarte1, 2,*, Iosu Madariaga1, Marta Revilla1, Aitziber Sarobe1 1
Ekologi Laborategia, Zientzi Fakultatea, Euskal Herriko Unibertsitatea, PK 644, 48080 Bilbo, Spain
2
Present address: School of Ocean & Earth Science, University of Southampton, Southampton Oceanography Centre, European Way, Southampton SO14 3ZH, United Kingdom
ABSTRACT: Short-term variability in microbial food web dynamics was investigated from 3 to 17 May 2001 at 2 contrasting sites in the Urdaibai estuary (Bay of Biscay). The lower site is located in an area where tidal advection exerts a major influence, whereas the upper site is located in area where the influence of the tide is much lower and that of river runoff is markedly higher than at the lower site. The biomass of microbial plankton (phytoplankton, bacteria, non-pigmented flagellates [NPF] and ciliates) and their rates of activities (primary production, bacterial production, herbivory, bacterivory and microbial community respiration) were markedly higher at the upper site, thus showing that tidal flushing is a key factor controlling these spatial differences along the longitudinal axis of the estuary, rendering the upper channel a high productivity zone and the lower euhaline area a less productive one. Water residence time also exerted an overriding effect on chlorophyll a distribution on a temporal basis, with drastic increases in river runoff, due to heavy rain pulses, being responsible for immediate bloom dispersion in the upper channel. Bacterial density was less affected than phytoplankton biomass by increased river flow. It is hypothesised that detrital material increases caused by increases in river runoff provided an extra source of carbon for bacterial growth. On average, microbial herbivory was responsible for the fate of ca. 50% of chlorophyll a standing stock. Herbivory rates were not significantly different on phytoplankton < 8/> 0.2 µm and on those 8 µm in size and grazing pressure on phytoplankton was lower in the more productive site. Protists 1 to 8 µm in size were the main bacterivores. No synchrony was observed between bacterial and NPF abundances. Instead a lag phase was observed between the peak densities of bacteria and NPF, which was larger at the more productive upper site than in the lower estuary and allowed bacteria in the former zone to exploit substrate availability without significant grazing control for several days. Microbial community rate of respiration was significantly correlated with bacterivory rates and NPF abundance in the upper estuary, but not in the lower zone. The median of the proportion of bacterial production removed by bacterivory was 64% at the lower estuary station and 17% in the upper estuary. A possible explanation for this difference could be that attached bacteria (abundant in the upper reaches of the estuary) are less accessible for protistan grazing. Bacterivory by protists accounted for a mean of 14 and 7% of protistan herbivory at the lower and upper sites respectively. KEY WORDS: Bacterivory · Herbivory · Bacteria · Phytoplankton · Protists · Estuary · Respiration Resale or republication not permitted without written consent of the publisher
It is believed that in the marine environment different modes of the planktonic food web can be dominant, e.g. herbivorous web, multivorous web, microbial web and the microbial loop (Legendre & Rassoulzadegan 1995). A key factor that distinguishes
these food webs is the role that protists play as intermediaries in the transfer of phytoplankton and bacterial biomass up the trophic chain. There is ample evidence that heterotrophic protists are generally the main grazers of bacterial biomass in both oligotrophic and eutrophic waters (Rassoulzadegan & Sheldon 1986, González et al. 1990, Caron et al. 1991, 2oli´c &
*Email:
[email protected]
© Inter-Research 2003 · www.int-res.com
INTRODUCTION
146
Aquat Microb Ecol 31: 145–161, 2003
Krstulovi´c 1994, Havskum & Hansen 1997, Weisse 1999), and it is often claimed that they consume a large proportion of bacterial production (Wikner et al. 1990, Caron et al. 1991, Coffin & Connolly 1997, Christaki et al. 1999). The role of protists as consumers of phytoplankton biomass, particularly in productive waters, is less clear, though (Strom et al. 2001). Some studies suggest that micro- and nanoplanktonic protists can also be responsible for the fate of a large proportion of chlorophyll a (chl a) biomass at certain times of the year (Gallegos 1989, McManus & Ederington-Cantrell 1992, Dagg 1995, Boissoneault-Cellineri et al. 2001, Strom et al. 2001). However, there have been relatively few attempts as yet to compare the importance of protists as bacterivores and as herbivores by making simultaneous measurements of bacterivory and herbivory rates (e.g. Rivkin et al. 1999, BoissoneaultCellineri et al. 2001). Information on time scales of variability of these processes is also rather scarce. Shallow estuaries, such as the Urdaibai estuary (Bay of Biscay), are very dynamic environments, subject to frequent, drastic changes in hydrodynamic conditions on a time scale of days (due to tidal, river flow, wind and other variations). These
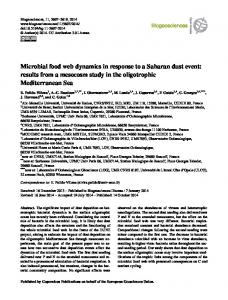
Fig. 1. Map of study area with location of sampling stations. Dotted area represents intertidal or salt marsh zones
episodic changes have been shown to significantly alter the distribution of plankton populations in the Urdaibai estuary (Madariaga et al. 1992, Iriarte et al. 1996) and elsewhere (Schuchardt & Schirmer 1991), but we have limited information on how they can affect food web dynamics. The present study aimed at investigating the dynamics of the planktonic microbial biota on a time scale of days in the Urdaibai estuary, with special emphasis on the role of protists as consumers of bacterial and phytoplankton production, by making concomitant measurements of protistan grazing rates on bacteria and phytoplankton.
MATERIALS AND METHODS Study area and sampling scheme. The Urdaibai estuary is a shallow, meso-macrotidal system draining to the Bay of Biscay, North Spain (43° 22’ N, 2° 40’ W, Fig. 1). This estuary is 12.5 km long, extending over 1.89 km2, with an average depth of 3 m and a maximum width of 1.2 km at the mouth. The central channel is bordered by salt marshes at its upper and middle reaches and by relatively extensive intertidal flats at its lower reaches (mainly sandy). An important feature is the presence of a waste-water treatment plant in the upper zone of the estuary with significant inputs of organic matter, inorganic nutrients and bacteria to the estuary. In the present study, sampling was carried out at 2 stations of contrasting characteristics. Stn 1 is located in the lower wider zone of the estuary, where tidal advection exerts a major influence. Stn 5 is located in the narrow inner channel, where the influence of the tides is much lower and that of river runoff is markedly higher than in the lower zone (Fig. 1). Surveys were carried out with an inflatable boat every other day from 3 to 17 May 2001 at high tide. Water samples were collected near the surface (0.5 m) with a 5 l Van Dorn opaque bottle and were immediately transported to AZTI–Instituto Tecnológico Pesquero y Alimentario in Sukarrieta (15 min boat trip from Stn 1), where they were processed in the laboratory. Samples were analysed for inorganic nutrient concentrations, chl a concentration, abundance of phytoplankton, bacteria, non-pigmented flagellates and ciliates, rates of primary production, community respiration, bacterial production, and microbial bacterivory and herbivory. At each station vertical profiles of temperature and salinity were obtained in situ using an LF 196 WTW sensor and Secchi disk depths were measured. Light extinction coefficients were calculated from Secchi disk depths as in Revilla et al. (2000). Euskal Autonomia Erkidegoko Meteorologia Zentrua and the Bizkaiko Foru Aldundia provided meteorological and Oka river flow data respectively.
Iriarte et al.: Microbial food web dynamics in an estuary
Inorganic nutrients. Water samples were filtered through Whatman GF/F filters and stored in the dark at –20°C. Analyses (within 3 mo of sample collection) for inorganic nutrient (nitrate, nitrite, ammonium, silicate and phosphate) concentrations were carried out as described in Parsons et al. (1984). Abundance of microbial plankton. Samples for the measurement of microbial plankton abundance were preserved with glutaraldehyde (1% final conc.). Aliquots (50 and 2 ml) were filtered in order to count for 10 mg m– 3), but by the second survey, owing to the bad weather conditions and pronounced increase in river flow, it had dropped markedly. As the weather improved again (i.e. decreases in rainfall and wind speed, increases in irradiance and temperature) total chl a values increased, reaching a peak (4.3 mg m– 3) on 13 May. Worsening of meteorological conditions thereafter precluded further increases in chl a levels. At Stn 1 maximum chl a values were also measured at the very start of the study period (Fig. 5). However,
minimum values were observed some days later than at Stn 5, particularly for the 8–100 µm size-fraction. Total chl a values did not show significant variations in the second half of the study period. The cell counts of the main phytoplankton species were in agreement with the chl a measurements (Table 1). On 3 May a bloom in which the dominant phytoplankton forms were the dinoflagellate Peridinium foliaceum, cryptophytes of the genus Hemiselmis and diatoms of the genus Navicula could be observed at the upper estuary. The marked increase in river flow made the bloom disperse, and by 5 May the abundance of all these phytoplankton forms had decreased sharply. From 9 May onwards a gradual increase in the density of other phytoplankton taxa was detected. Most of them reached a secondary peak on 13 May.
Iriarte et al.: Microbial food web dynamics in an estuary
151
The abundance of NPF varied between 1.7 and 21 × 106 cells l–1 at Stn 5, and values remained relatively low until 13 May, when there was a sharp increase (Fig. 6). At Stn 1 no decrease was observed in the bacterial abundance on 5 May; instead, a slight decrease was measured a few days later, and a marked increase was noted on the last day of the survey (Fig. 6). The abundance and range of NPF density at Stn 1 was much smaller than at Stn 5 (0.7 to 2.4 × 10⁶ cells l–1). The abundance of NPF showed an increase until 13 May and a slight decrease at the end of the study period (Fig. 6). The density of ciliates ranged between undetectable levels and 8500 cells l–1 at Stn 1 and between undetectable levels and 32 000 cells l–1 at Stn 5 (Fig. 6). The temporal variation of ciliates showed some analogy with that of NPF abundance, particularly at the end of the study period (13 to 17 May). Fig. 6. Abundance of bacteria, non-pigmented flagellates and ciliates at Stns 1 and 5 during the study period
At Stn 1 diatoms were more abundant than dinoflagellates. At the start of the survey Leptocylindrus minimus was the most abundant diatom and very few dinoflagellates were observed. By 5 May the overall abundance of diatoms had decreased markedly. By contrast, as the survey progressed, dinoflagellates were observed to increase their numbers with respect to values measured on 3 and 5 May. Rates of total (sum of size-fractions) primary production were also higher at Stn 5 (19.95–221.87 mg C m– 3 d–1) than at Stn 1 (7.89–23.40 mg C m– 3 d–1) throughout the entire period of study. Temporal variations showed similar trends to those described for chl a concentration and phytoplankton abundance (Fig. 5). The contribution of the 8–100 µm size-fraction to total primary production (mean ± SD: 60.1 ± 17.1% at Stn 1 and 71.9 ± 12.1% at Stn 5) was significantly higher than that of the smaller size-fraction (t-test, p < 0.001). Differences in the percentage contribution to total primary production between stations were not statistically significant for any of the size-fractions (ttest, p > 0.05).
Bacterial production BP rates were significantly higher (t-test, p < 0.01) at Stn 5 (6.31–254.95 × 10⁸ cells l–1 d–1) than at Stn 1 (2.77–22.20 × 10⁸ cells l–1 d–1). At Stn 5 BP rate followed a temporal variation pattern similar to that of bacterial density (Fig. 7). The reason for the decrease observed on 15 May is not clear. At Stn 1 the BP rate was also higher during the second half of the study period, and the marked increase in river flow did not seem to have an immediate negative effect on it (Fig. 7).
Abundance of bacteria, non-pigmented flagellates and ciliates Bacterial abundance at Stn 5 was on average about 4 times higher than that at the lower station (Fig. 6). Temporal variation showed bacterial density at the upper station to decrease slightly on 5 May. Thereafter the numbers of bacteria increased until they reached a plateau (11 to 13 May) at levels around 6 × 10⁹ cells l–1.
Fig. 7. Bacterial production (BP) rates, bacterial cell numbers and the ratio of bacterivory to BP rates (IR/BP) at Stns 1 and 5 during the study period
Dinoflagellates Ceratium lineatum Gymnodinium spp. Heterocapsa minima Heterocapsa pygmaea Heterocapsa rotundata Peridiniopsis salina Peridinium foliaceum Peridinium pyriforme Peridinium quinquecorne Prorocentrum micans Prorocentrum minimum Scrippsiella trochoidea Warnowia polyphemus
Diatoms Cerataulina pelagica Chaetoceros curvisetus Chaetoceros decipiens Chaetoceros simplex Chaetoceros socialis Chaetoceros teres Chaetoceros willei Diatoma vulgare Lauderia annulata Leptocylindrus danicus Leptocylindrus minimus Licmophora sp. Meuneria membranacea Navicula spp. Nitzschia closterium Nitzschia gracilis Nitzschia spp. Pseudo-nitzschia delicatissima Pseudonitzschia seriata Rhizosolenia fragillissima Rhizosolenia imbricata Thalassionema nitzschioides Thalassiosira guillardii Thalassiosira levanderi Thalassiosira rotula
Taxon Day 5
Day 7
– – – – – – – – – – – 2100 – – – 1100 –
– –
– – – – –
– 2100 1100 – 2100 – – – – – – 4200 210
– – – – – – – – 2100 – – 3200 1100 – – – 3200 –
– 1100 – – – – –
– 3200 1100 1100 – – – – – – – 4200 –
1100 – – 2100 – – – 1100 – 1100 1100 5300 –
Day 5
Day 7
– – – 4200 – – – – – – 2100 3200 –
– – – – – – – – – – 85000 – 650000 21000 – – – – – – – – – – – –
– – – – – 11000 11000 – – – – – –
– – – – 21000 – – – 14000 – – – – – – – – – – – 11000 – – – 8500 – – – – – 11000 – – – – – 2100 – – – 21000 – – – – – – – – – – – 6400 330000 220000 160000 2100 – – – – – – – 1100 11000 21000 42000 15000 – – – 2100 – – – – – – – – – – – – – – – 15000 11000 21000 110000 5300 – – – – – – –
Stn 1 Day 9 Day 11 Day 13 Day 15 Day 17 Day 3
3200 2100 1100 – 4200 – – – – 6400 – 11000 6400 – 6400 6400 7400 – 8500 4200 3200 – – – – 2100 – – – – – – – – 13000 3200 – 1100 – 2100 – – – – – – – – – – – – – – – – – – – – 1100 – – 21000 17000 36000 40000 19000 33000 1100 740000 220000 76000 160000 300000 180000 50000 – – – – – – 1100 2100 – – – – – – 3200 4200 4200 3200 – 3200 4200 – – – – – 2100 1100 – – – – – – – – – – – – 1100 – 9600 11000 5300 – 2100 2100 2100 5300 4200 4200 1100 – – 5300 – 4200 – 1100 – 7400 4200 – – 1100 – – – 2100 – – 4200 – 4200 1100 2100 – – 3200 – – 11000 5300 2100 – 6300 – 1100 – – – – 5300 – – – –
Day 3
– – – – – – 53000 – – – – – –
– – – – – – – – – – – – – 85000 11000 – 21000 – – – – – 160000 – – – – – – – 42000 21000 – – – – – –
– – – – – – – – – – – – – 160000 74000 – 32000 – – – – – 320000 – – – – – – – 32000 21000 – 11000 – – – –
– – – – – 11000 32000 – – – – – –
– – – – – – 11000 – – – – – –
– – – – – – – – – – – – – – – – – – – – – – – – – – – – – – – – – – – – – – – 300000 110000 85000 53000 – – 11000 11000 – 64000 – 11000 – – – – – – – – – – – – – – – 460000 130000 160000 – – – – – –
Stn 5 Day 9 Day 11 Day 13 Day 15 Day 17
Table 1. Abundance (cells l–1) of main phytoplankton taxa at Stns 1 and 5 during the study period
152 Aquat Microb Ecol 31: 145–161, 2003
Iriarte et al.: Microbial food web dynamics in an estuary
153
42000 150000 53000 – – 300000 – 1100 – 30000 27000 – – 2100 28000 7400
Phytoplankton growth and herbivory
– 4200 3200 – – – – 1100
– 34000 7400 – – 2100 – 1100
– 29000 11000 – – – – 2100
– 42000 13000 – – 1100 – 3200
– 21000 20000 – – – 23000 4200
– – – – – 21000 96000 11000 42000 3200 6700 610000 53000 110000 700000 – 11000 – – 11000 – 53000 – – – 1100 74000 11000 11000 53000 – – – – – 8500 – – – 21000
– 21000 700000 21000 21000 64000 – –
– 74000 470000 21000 – 700000 – 11000
– 120000 150000 1100 – 160000 – 32000 – 54000 23000 – – 1100 87000 5300
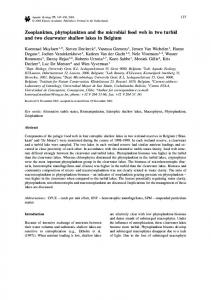
In the upper estuary bacterivory rates showed large variations (range: 1.8–48.9 × 10⁸ bacteria l–1 d–1; mean ± SD: 17.1 ± 16.1 × 10⁸ bacteria l–1 d–1). These rates were low during the first half of the study period and showed a marked increase towards the end of the study period, coinciding with the stabilisation of bacterial numbers (Fig. 8). This increase was matched by a substantial increase in the abundance of NPF (Fig. 6). In the lower estuary, bacterivory rates (range: 3.0–26.7 × 10⁸ bacteria l–1 d–1; mean ± SD: 9.8 ± 7.2 × 10⁸ bacteria l–1 d–1) were on average lower than at the upper (Fig. 8). Protists in the 1–8 µm size-fraction were the dominant consumers of bacteria at both stations (Fig. 8). Their mean contribution to total bacterivory was 84 ± 12% . The proportion of BP consumed by bacterivores was highly variable, i.e. 25–666% (median = 64%) and 2–157% (median = 17%) at Stns 1 and 5 respectively (Fig. 7), but it was also observed that at the upper estuary this proportion was significantly lower (MannWhitney, p < 0.01). At Stn 1 the temporal variation of the ratio of bacterivory rate to BP rate (IR/BP) and that of bacterial abundance generally showed inverse patterns, but this type of relationship was not so clear at Stn 5 (Fig. 7).
Others Scenedesmus protuberans Teleaulax sp. Hemiselmis sp. Euglena sp. Eutreptia sp. Eutreptiella sp. Dynobrion divergens Unidentified flagellates
Stn 1 Day 9 Day 11 Day 13 Day 15 Day 17 Day 3 Day 7 Day 5 Day 3
Table 1 (continued)
Day 5
Day 7
Stn 5 Day 9 Day 11 Day 13 Day 15 Day 17
Bacterivory
Significant (p < 0.05) relationships between the dilution fraction and the apparent growth rate were obtained for total chl a in all but 1 sample at Stn 1 and in all but 2 samples at Stn 5 (Table 2). The relationships for the 0.2–8 µm size-fraction were significant (p < 0.05) on all but 2 dates at both Stns 1 and 5 (Table 3). For the 8–100 µm size-fraction, at Stn 1 significant (p < 0.05) relationships were obtained in all cases, but on 2 occasions evidence of saturated grazing was observed and growth and grazing rates were calculated using the 3 most diluted points (Table 3) (Gallegos 1989). For data from Stn 5, however, regressions were only significant on 2 sampling visits (Table 3). Growth rates (µ) for total chl a ranged between 0.61 and 1.25 d–1 at Stn 1 and between 1.05 and 1.62 d–1 at Stn 5. On average, total phytoplankton had significantly higher (t-test, p < 0.05) growth rates at Stn 5 (1.39 ± 0.22 d–1) than at Stn 1 (0.98 ± 0.22 d–1). No statistically significant difference (t-test, p > 0.05) was observed in growth rates between the 2 size-fractions. Temporal variations showed that growth rates of phytoplankton decreased with the increase in river flow and showed a peak during the second half of the study period.
154
Aquat Microb Ecol 31: 145–161, 2003
Fig. 8. Microbial community respiration rates (mg O2 l−1 d−1), bacterivory rates (×108 bacteria l−1 d−1) by 1−8 and 8−100 µm plankton and the contribution of each size fraction to total bacterivory (%) at Stns 1 and 5 during the study period
Herbivory rates (g) for total chl a ranged between 0.33 and 0.92 d–1 (mean ± SD, 0.75 ± 0.20 d–1) at Stn 1 and between 0.27 and 0.96 d–1 (mean ± SD, 0.62 ± 0.22 d–1) at Stn 5 (Table 2). These rates were generally higher at the lower estuary than at the upper estuary; however, no statistically significant (t-test, p > 0.05) difference was observed between stations. No significant
differences (t-test, p > 0.05) were observed in herbivory rates between size-fractions either. The proportion of phytoplankton growth removed daily by microbial plankton grazing was high during the study period, particularly in the lower estuary. Although a plot of the ratio of grazing rate to growth rate (g/µ) versus chl a biomass (for total chl a) did not reveal
Table 2. Phytoplankton growth rates (µ) and herbivory rates (g) at Stns 1 and 5 calculated from regression lines of dilution series from total chl a values. The r2 and significance values of the slope and intercept of the regression lines are given (ns: not significant). Daily rates of chl a removal and percentage standing stock (SS) consumed daily were calculated as in BoissoneaultCellineri et al. (2001) µ (d–1)
g (d–1)
r2
Significance of intercept (p-value)
Significance of slope (p-value)
µg chl a l–1 consumed daily
% SS consumed daily
g/µ
Stn 1 3 5 7 9 11 13 15 17
– 0.61 0.86 0.86 1.25 1.14 1.02 1.12
– 0.78 0.33 0.86 0.79 0.90 0.69 0.92
– 0.45 0.42 0.52 0.69 0.71 0.75 0.73
– < 0.009 < 0.001 < 0.001 < 0.001 < 0.001 < 0.001 < 0.001
ns < 0.017 < 0.022 < 0.008 < 0.001 < 0.001 < 0.001 < 0.002
– 2.0 1.1 1.6 2.0 2.4 1.7 2.2
– 54 28 57 54 59 50 60
– 1.28 0.39 0.99 0.63 0.79 0.68 0.82
Stn 5 3 5 7 9 11 13 15 17
1.05 1.23 1.56 1.54 1.62 – 1.36 –
0.54 0.96 0.64 0.72 0.27 – 0.59 –
0.60 0.77 0.54 0.69 0.69 – 0.68 –
< 0.001 < 0.001 < 0.001 < 0.001 < 0.001 – < 0.001 –
< 0.024 < 0.001 < 0.009 < 0.001 < 0.003 ns < 0.001 ns
12.30 8.4 3.8 5.9 3.2 – 6.7 –
42 62 47 51 24 – 45 –
0.52 0.78 0.41 0.46 0.17 – 0.43 –
Day (May)
155
Iriarte et al.: Microbial food web dynamics in an estuary
Table 3. Phytoplankton growth rates (µ) and herbivory rates (g) at Stns 1 and 5 calculated from regression lines of dilution series from chl a values in the 0.2–8 and 8–100 µm size-fractions. The r2 and significance values of the regressions are given (ns: not significant) Day (May) µ (d–1)
g (d–1)
Stn 1 3 5 7 9 11 13 15 17
0.81 0.25 – – 1.29 1.08 0.95 0.94
1.06 0.78 – – 0.84 1.02 0.50 0.87
Stn 5 3 5 7 9 11 13 15 17
– 0.74 1.66 1.16 1.54 – 1.31 0.68
– 1.09 1.32 0.90 0.90 – 1.31 0.63
0.2–8 µm r2
8–100 µm g (d–1) r2
Significance of slope (p-value)
µ (d–1)
0.89 0.71 – – 0.49 0.66 0.71 0.49
< 0.001 < 0.001 ns ns < 0.008 < 0.001 < 0.001 < 0.003
1.37 0.43 1.18 0.82 1.20 1.27 1.25 1.19
1.23 0.64 0.69 0.95 0.73 0.78 1.15 0.88
0.83 0.63 0.82 0.84 0.75 0.62 0.92 0.79
< 0.001 < 0.019a < 0.001a < 0.001 < 0.001 < 0.002 < 0.001 < 0.001
– 0.64 0.75 0.77 0.54 – 0.88 0.74
ns < 0.003 < 0.001 < 0.001 < 0.002 ns < 0.001 < 0.001
1.07 – – 1.63 – – – –
0.96 – – 0.63 – – – –
0.86 – – 0.54 – – – –
< 0.001 ns ns < 0.007 ns ns ns ns
Significance of slope (p-value)
a
Non linear type of kinetics (Gallegos 1989), see ‘Materials and methods; Herbivory’ for calculation procedure
a clear-cut relationship, the g/µ ratio was significantly higher (t-test, p < 0.05) at the low productivity Stn 1 than at the most productive Stn 5 (Table 2). These high rates of removal of growth were observed in both sizefractions (differences in the g/µ ratio between size fractions were not statistically significant, t-test, p > 0.05). In absolute values, total rate of biomass consumed was significantly lower (t-test, p < 0.05) at Stn 1 (mean value of 1.86 µg chl a l–1 d–1) than at Stn 5 (mean value of 6.74 µg chl a l–1 d–1). The mean percentage of standing stock consumed daily was 48.8%. For this last parameter no statistically significant difference was observed between stations (t-test, p > 0.05).
Microbial plankton community respiration Rates of respiration of the microbial plankton community at Stn 1 (0.07–0.31 mg O2 l–1 d–1) were consistently and significantly lower than at Stn 5 (0.33–1.27 mg O2 l–1 d–1) (Fig. 8). At Stn 5 the rate of respiration showed a significant positive correlation with the abundance of non-pigmented flagellates (r = 0.893, p < 0.01) and with bacterivory rates by the 1–8 µm size-fraction (r = 0.826, p < 0.05). At Stn 1 no statistically significant relationship was observed with NPF density nor bacterivory rates (p > 0.05).
DISCUSSION Methods for measuring bacterivory and herbivory Amongst the methods that are commonly used for measuring bacterivory and herbivory rates, there is no single one that is infallible, i.e. all of them offer some advantages and disadvantages (for a review see Caron 2001). The RLB technique used in the present study has the advantage that it is highly sensitive and requires minimum manipulation. However, there are several potential disadvantages as well. There is risk of label uptake by bacteria once the bacterivory incubation has commenced; this can be largely avoided by separating through filtration the dissolved TdR from the initially labelled bacteria. There is also some risk of release and/or recycling of label during the experiment, which can be kept at a minimum by using short incubations, i.e. 30 mg chl a m– 3 (Madariaga 1995, Iriarte et al. 1996). The key environmental factors that allow these substantial accumulations of chl a are the elevated nutrient levels (entering the estuary not only via river runoff, but also through discharges from a waste-water treatment plant) and the reduced tidal flushing. Under low river flows the residence time of the water in this inner channel can be several weeks to months (see Trigueros & Orive 2000). By contrast, the lower estuary is characterised by lower phytoplankton biomass because tidal flushing is high. It has been estimated that in this euhaline zone the estuary almost empties itself with each tidal cycle (Villate et al. 1989). The present study further showed that, on a day-to-day time scale, drastic changes in river flow have an overriding effect on phytoplankton biomass. Particularly in the narrow upper channel, high river
flow may washout most of the phytoplankton present in 1 to 2 d, resulting in rapid bloom dispersion. The fact that at Stn 1 a lag was observed in the decrease in chl a suggests some accumulation by advection from the upper reaches. The influence of freshets on phytoplankton abundance in the Urdaibai estuary was also pointed out by Madariaga et al. (1992) and Iriarte et al. (1996) and has also been observed in other estuarine areas (Schuchardt & Schirmer 1991). Irregular low-atmospheric-pressure systems that generate strong rain pulses lasting for a few days occur throughout the whole year in this area. The intense rainfalls have an immediate effect on the Oka river flow, which, in turn, due to the geomorphology of the upper estuary (Villate et al. 1989) can significantly alter its hydrographic characteristics. The outcome is that rainfall is a key controlling factor of bloom dynamics in the estuary. The spatial differences in nutrient status was reflected in the structure of the phytoplankton community. The relative importance of larger phytoplankton has been suggested to increase from low to high production areas, even within coastal or estuarine spatial and temporal gradients (Jochem 1989, Iriarte & Purdie 1994). Although in the present study phytoplankton biomass and production rates were relatively low during most of the study period in both zones, this tendency for a dominance of larger phytoplankton in the most productive area and at times of highest biomasses was apparent. Spatial and temporal variations in the composition of the phytoplankton assemblages were also related to hydrographical conditions. In the upper channel the water column generally shows stronger stratification than in the lower estuary, and dinoflagellates are able to attain bloom levels (i.e. >10 mg chl a m– 3), as was observed in the present study at the beginning of the survey period (i.e. before they were washed out by river runoff) and has been observed in previous studies (Orive et al. 1998, Trigueros & Orive 2000). By contrast, in the lower estuary spring blooms are usually mainly composed of diatoms. In the present study highest total dinoflagellate numbers in the lower estuary (as measured in subsurface samples) were observed on days in which a weak stratification (density difference between a given depth and the surface (∆σt) > 0.2 kg m– 3, following Labry et al. 2001) was observed, which generally occurred in the first 0.5 m. This conforms with the general view that dinoflagellates grow best in stratified environments (Margalef 1978, Estrada & Berdalet 1997). The dominance of peridinian-type dinoflagellates in the nutrient-enriched zone of the estuary is in accordance with the general classification of these phytoplankters according to their habitat preference (Smayda & Reynolds 2001).
Iriarte et al.: Microbial food web dynamics in an estuary
Chl a biomass was positively correlated with primary production rate. However, no such correlation was found with the apparent growth rate (g – µ) at any station. It thus seems that variations in chl a biomass are more dependent on environmental factors enabling an increase in production rates and physical factors allowing high residence times of water than on grazing. This does not mean that microbial herbivory is of minor importance. In fact, our estimates suggest that during the study period, on average, microbial herbivores consumed daily about 50% of the standing stock, an estimate that compares well with others obtained for other estuarine and coastal waters such as Chesapeake Bay (Gallegos 1989, McManus & Ederington-Cantrell 1992), the Atchafalaya River estuary (Dagg 1995), Long Island bays (Boissoneault-Cellineri et al. 2001), the plume of the Gironde estuary (Sautour et al. 2000) and the Urdaibai estuary (also known as Mundaka estuary) itself (Ruiz et al. 1998). Grazing rate (g) on phytoplankton in the 0.2–8 µm size-fraction was not significantly different from that on larger phytoplankton, although it has to be borne in mind that at Stn 5 on most of the days the relationship between apparent growth rate and dilution factor failed for this size-fraction. However, it is interesting to note that Strom et al. (2001) observed the same pattern in relation to phytoplankton size. By contrast, Kuipers & Witte (1999) reported differences within the < 5 µm cluster, with higher grazing rates on algae of 3–4 µm than on those of 1–2 µm. The g/µ ratio shows a very large variability in coastal and estuarine waters (see compilation in Strom et al. 2001). Strom et al. (2001) reported higher relative grazing pressure on phytoplankton in the 0.2–8 µm sizefraction than on larger algae in North Pacific coastal waters, but at the same time they observed that the g/µ ratio increased during bloom events, despite blooms being dominated by large phytoplankton. In the present study in the Urdaibai estuary, we were unable to detect significant differences between size fractions, and we also failed to observe a significant correlation between g/µ and chl a biomass. However, we did observe significant differences in g/µ between stations, the relative grazing pressure being lower at the inner channel, where chl a biomass was always higher. However, in a study carried out in summer in the Urdaibai estuary no such consistent trend was observed along the salinity gradient (Ruiz et al. 1998).
Bacteria and heterotrophic protist dynamics Estuarine bacterial dynamics are a complex interplay of physical and biological parameters (Ducklow & Shiah 1993), and the dominant factors controlling
157
bacterial biomass can change as a function of the spatial and temporal scales under consideration (Dufour & Torréton 1996). In the Urdaibai estuary bacterial biomass and production were significantly higher in the upper channel than in the lower euhaline zone of the estuary. In a previous work we suggested that the main factors contributing to this distribution along the salinity gradient are differences in nutrient availability (both organic and inorganic compounds) derived from discharges from a waste-water treatment plant located in the upper estuary and from primary production, and differences in water residence time (Revilla et al. 2000). The present study further showed that NPF and ciliate densities display the same pattern along the longitudinal axis of the estuary as bacteria. On a temporal scale, bacterial abundance decreased at times of increased flushing (both freshwater and tidal). However, bacterial abundance did not seem to be so negatively affected as phytoplankton standing stock by the drastic increase in river flow. Similar to the pattern observed for chl a, at the outer estuary bacterial numbers even increased, presumably due partly to advection from the upper estuary. Bacterial production was not coupled to primary production rates or chl a biomass. This is the case also for other estuarine areas with high allochthonous inputs of organic matter (Ducklow & Kirchman 1983). It seems that the increase in detrital matter following the strong increase in river flow provided an extra source of carbon for bacterial growth. Murrell et al. (1999) also found that organic matter increases due to river flow allowed increased bacterial activity in San Francisco Bay. The approximate 4°C increase in water temperature in the upper channel during the course of the investigation may have favoured the increase in bacterial production and biomass. By contrast, water temperature increased by only about 1°C at Stn 1 and no obvious relationship between bacterial production and temperature was apparent. A good correlation between bacterial production and temperature has also been noted during seasonal studies in the Urdaibai estuary (Revilla et al. 2000), and it is in agreement with observations made in the productive intermediate and upper zones of other estuaries (Hoch & Kirchman 1993, Goosen et al. 1997). In seasonal studies conducted in the Urdaibai estuary, it has been pointed out that in the euhaline zone of the estuary resource availability is more important than temperature in controlling bacterial production rates (Revilla et al. 2000, A. Sarobe unpubl.). There was no day-to-day synchrony between bacterial and NPF abundance, instead a lag phase was observed between the peak densities of bacteria and NPF, which was longer at the upper more productive site than in the lower estuary. NPF density reached high levels only in the inner channel and at the end of
158
Aquat Microb Ecol 31: 145–161, 2003
the study period. Although in-phase oscillations have been reported elsewhere (Davis et al. 1985, Tanaka & Taniguchi 1996), temporary lags (2 to 8 d) in grazing pressure on increased bacterial abundance have also been observed in microcosm experiments (Jürgens et al. 2000) and in situ (Kirchman et al. 1989, Dolan & Gallegos 1991, Tanaka & Taniguchi 1996). There is ample debate in the literature as to the strength of grazing control over bacteria. Sanders et al. (1992) claimed that, in general, there is a good cross ecosystem correlation between bacterial and heterotrophic nanoflagellate (HNF) abundance and that the bacteria:HNF ratio tends to be 1000. They further suggested that relative to bottom-up control, grazing by heterotrophic nanoflagellates exerts a stronger control over bacterial abundance in eutrophic than in oligotrophic environments. These authors, however, also recognised that predator-prey-induced oscillations in bacterial and HNF abundances can occur in eutrophic waters, resulting in rapid, short-lived increases in bacterial abundance. Gasol & Vaqué (1993) argued that bacteria and HNFs are not strongly coupled across systems (being less coupled in eutrophic systems than in oligotrophic ones) and that HNF do not always control bacterial abundance. Jürgens (1992) further suggested that in eutrophic waters there are far more bacteria than heterotrophic flagellates can consume. Our results support the view that bacteria in the upper estuary can respond to enhanced substrate availability without significant grazer control for several days (Sanders et al. 1992, Jürgens et al. 2000). The present study also shows that bacterivory is the main loss process of bacterial production in the outer low production zone of the estuary, but it is only a relatively minor proportion of bacterial production in the more productive upper channel, suggesting, therefore, that there is a tighter control of bacterial biomass in the outer zone. Boissonneault-Cellineri et al. (2001), comparing microbial food-web dynamics in 2 Long Island embayments of different trophic status, also reported weaker grazing pressure on bacterioplankton in the more eutrophic bay. They speculated this trend might be related to differences between bays in particle load (attachment to particles can provide refuge from grazing) or else to differences in bacterial losses due to viral lysis. These reasons could also apply to the spatial differences in grazing pressure found in the Urdaibai estuary, since a considerable proportion of bacteria are attached bacteria in the upper estuary (ca. 30%). However, the fact that bacteria are more tightly controlled by grazing in less-productive waters than in the more productive ones does not exclude a significant degree of bottom-up control in less-productive areas. Our results conform with the view that predation becomes a major mechanism for loss of bacteria once substrate
limitation has reduced bacterial production, as has been found in other coastal waters (Coffin & Connolly 1997). In summary, nutrient availability and water residence time seem to be responsible for the large differences in bacterial biomass along the longitudinal axis of the Urdaibai estuary. Superimposed upon this, it appears that in the less-productive area there is a tighter control of bacterial biomass due to grazing. On a temporal scale, water residence time and temperature variations exert great influence on short-term (day-to-day) variations in bacterial biomass in the most productive zone, where due to the geomorphology of the estuary both of these parameters show larger short-term variations than in the lower estuary. On a seasonal basis, temperature seems to be a dominant controlling factor of bacterial biomass accumulations in this uppermost productive zone, whereas resource limitation might be more important than temperature in the lower, less-productive zone (Revilla et al. 2000). Protists < 8 µm in size were shown to be the most important planktonic microbial bacterivores in the Urdaibai estuary. By assuming that all bacterial predators in the < 8 µm size-fraction are NPF, as was done in a study by 2oli´c & Krstulovi´c (1994), rates of ingestion of bacteria per NPF can be calculated. This calculation yields ingestion rates of 7 to 74 bacteria flagellate–1 h–1 (mean ± SD: 22 ± 21) at Stn 1 and 4 to 18 bacteria flagellate–1 h–1 (mean ± SD: 10 ± 5) at Stn 5. The mean value at Stn 1 is higher than measured in a previous study conducted over an annual cycle (A. Sarobe unpubl.) but compares very well with the mean value estimated in a study in Ka$tela Bay (Adriatic Sea) by 2oli´c & Krstulovi´c (1994) using the same method. It can be argued that the method might overestimate somewhat real values because it assumes all predators < 8/>1 µm were NPF. However, the calculation is worthy in showing the great variability that this parameter shows in the natural environment, even on a day-to-day basis, something that has also been noted using more ‘predator-specific’ methods, such as fluorescently labelled bacterial uptake (Barcina et al. 1992, Vaqué et al. 1992). Wikner et al. (1990) noted that even diel variations in bacterivory rate could be significant. It is also interesting to observe that, despite the temporal variability, the rate of ingestion of bacteria per NPF in the lower estuary was on all days but one higher than in the upper estuary. In our previous study conducted at Stn 1 over an annual cycle (A. Sarobe unpubl.), it was observed that ingestion rates per NPF were lowest in summer, at the time of a picophytoplankton biomass peak, and it was argued that NPF might ingest fewer bacteria per cell in summer because they ingest proportionately more algae or other food items that are larger and more nutritious
Iriarte et al.: Microbial food web dynamics in an estuary
159
and, therefore, potentially preferred to bacteria (Peters et al. 1998). In the present study NPF appeared to ingest proportionately fewer bacteria in the upper estuary, where the availability of carbon sources other than bacteria was also higher. However, in this case it may be argued that since in the upper, nutrient-rich channel bacteria were noted to be larger in size than in the lower nutrient-euhaline zone, NPF need not ingest as many bacteria as in the lower estuary to obtain the same amount of carbon. Culture studies have shown the size of bacteria can significantly affect bacterial ingestion rates (Eccleston-Parry & Leadbeater 1994). The presence of ciliates was noted to be more sporadic than that of NPF, and the temporal dynamics of bacterivory in the 8–100 µm size-fraction showed a less clear pattern than that of the 1–8 µm size-fraction. Other studies have also shown large short-term variability in ciliate abundance in coastal waters (Verity 1986).
A. Sarobe unpubl.) and a carbon-to-volume conversion factor of 0.22 pg C µm– 3 (Børsheim & Bratbak 1987) and bacterial carbon contents as above, the result is that, on average, bacterivory could satisfy 70% of the NPF carbon demand at Stn 1 and 52% at Stn 5. More recently, it has been suggested that the carbon content of flagellates varies in relation to their growth state, and a mean content of 0.43 pg C µm– 3 has been estimated for growing cells similar to Paraphysomonas sp. (Sin et al. 1998). If we apply this conversion factor, the percentage of NPF carbon demand satisfied by bacterivory would be 35 and 27% at Stns 1 and 5 respectively. This implies that the amount of carbon consumed by herbivory was far larger than would have been expected from considerations of the carbon needed to support the populations of non-pigmented flagellates. This suggests that the contribution of other heterotrophic protists and/or mixotrophic algae to herbivory must have been substantial during the study period.
Carbon flows through microbial plankton
Acknowledgements. This research was funded by the Department of Education, Universities and Research of the Basque Government (GV PI-1999-17); A.S. was supported by a grant from the same institution. We are most grateful to AZTI for letting us use their laboratory facilities in Sukarrieta during the field work period. We thank J. M. Trigueros for doing the phytoplankton and ciliate counts and J. Serrano, O. Ruiz and R. Vega for general assistance in the field and in the laboratory. Three anonymous reviewers are acknowledged for their comments on the manuscript.
Bacterivory and herbivory rates can be compared by transforming the data into carbon flow rates. If we assume a C:chl a (g:g) ratio of 50, as has been done for phytoplankton in the Gironde dilution plume (Bay of Biscay) by Artigas (1998), and a carbon content of 11.35 fg C cell–1 for bacteria at Stn 1 (i.e. value estimated for bacteria in beach waters of the Basque coast by Iriberri et al. 1990) and of 20 fg C cell–1 for bacteria at Stn 5 (Lee & Fuhrman 1987), allowing for a larger size of bacteria in nutrient-rich waters, we can calculate that during the study period bacterivory accounted for a mean of 14 and 7% of the C flux due to herbivory at Stns 1 and 5 respectively. This calculation was made by estimating the rate of chl a consumption (µg chl a l–1 d–1) as in Boissonneault-Cellineri et al. (2001). Similar calculations carried out recently by BoissonneaultCellineri et al. (2001) for 2 Long Island embayments yielded higher annual means of 21 and 47%. However, interestingly, in the latter study lower percentages were also estimated in the bay where plankton biomass and production were higher. Therefore both studies suggest that bacteria become proportionately more important relative to phytoplankton as a food source for protists in lower-production areas. By making several assumptions it is possible to speculate on the daily carbon ration needed by NPF and the proportion of this carbon demand that could be satisfied via bacterivory. If we assume for NPF an average doubling time of 2 d (Weisse 1999), a gross growth efficiency of 30% (Fenchel 1982, Vaqué et al 1992), a mean volume of 27 µm3 cell−1 (as estimated in a previous study conducted at Stn 1 in the Urdaibai estuary;
LITERATURE CITED Artigas LF (1998) Seasonal variability in microplanktonic biomasses in the Gironde dilution plume (Bay of Biscay): relative importance of bacteria. Oceanol Acta 21:563–580 Barcina I, Ayo B, Unanue M, Egea L, Iriberri J (1992) Comparison of rates of flagellate bacterivory and bacterial production in a marine coastal system. Appl Environ Microbiol 58:3850–3856 Boissoneault-Cellineri KR, Mehta M, Lonsdale DJ, Caron DA (2001) Microbial food web interactions in two Long Island embayments. Aquat Microb Ecol 26:139–155 Børsheim KY, Bratbak G (1987) Cell volume to carbon conversion factors for a bacterivorous Monas sp. enriched from seawater. Mar Ecol Prog Ser 8:211–223 Caron DA (2001) Protistan herbivory and bacterivory. Method Microbiol 30:289–315 Caron DA, Lim EL, Miceli G, Waterbury JB, Valois FW (1991) Grazing and utilization of chroococcoid cyanobacteria and heterotrophic bacteria by protozoa in laboratory cultures and a coastal plankton community. Mar Ecol Prog Ser 76: 205–217 Caron DA, Lessard EJ, Voytek M, Dennett MR (1993) Use of tritiated thymidine (TdR) to estimate rates of bacterivory: implications for label retention and release by bacterivores. Mar Microb Food Webs 7:177–196 Christaki U, Van Wambeke F, Dolan J (1999) Nanoflagellates (mixotrophs, heterotrophs and autotrophs) in the oligotrophic eastern Mediterranean: standing stocks, bac-
160
Aquat Microb Ecol 31: 145–161, 2003
terivory and relationships with bacterial production. Mar Ecol Prog Ser 181:297–307 Coffin RB, Connolly JP (1997) Bacteria and heterotrophic microflagellate production in the Santa Rosa Sound, Florida. Hydrobiologia 353:53–61 Cotano U, Uriarte I, Villate F (1998) Herbivory of nanozooplankton in polyhaline and euhaline zones of a small temperate estuarine system (Estuary of Mundaka): seasonal variations. J Exp Mar Biol Ecol 227:265–279 Dagg MJ (1995) Ingestion of phytoplankton by the micro- and mesozooplankton communities in a productive subtropical estuary. J Plankton Res 17:845–857 Davis PG, Caron DA, Johnson PW, Sieburth JMcN (1985) Phototrophic and apochlorotic components of picoplankton and nanoplankton in the North Atlantic: geographic, vertical, seasonal and diel distributions. Mar Ecol Prog Ser 21:25–26 Dolan JR, Gallegos CL (1991) Trophic coupling of rotifers, microflagellates, and bacteria during fall months in the Rhode River Estuary. Mar Ecol Prog Ser 77:147–156 Ducklow HW, Kirchman DL (1983) Bacterial dynamics and distribution during a spring diatom bloom in the Hudson River plume, USA. J Plankton Res 5:333–355 Ducklow HW, Shiah FK (1993) Bacterial production in estuaries. In: Ford TG (ed) Aquatic microbiology: an ecological approach. Blackwell Scientific Publications, Boston, p 261–287 Dufour PH, Torréton JP (1996) Bottom-up and top-down control of bacterioplankton from eutrophic to oligotrophic sites in the tropical northeastern Atlantic Ocean. DeepSea Res I 43:1305–1320 Eccleston-Parry JD, Leadbeater BSC (1994) A comparison of the growth kinetics of six marine heterotrophic nanoflagellates fed with one bacterial species. Mar Ecol Prog Ser 105:167–177 Estrada M, Berdalet E (1997) Phytoplankton in a turbulent world. Sci Mar 61:125–140 Fenchel T (1982) Ecology of heterotrophic microflagellates. II. Bioenergetics and growth. Mar Ecol Prog Ser 8:225–231 Fuhrman JA, Azam F (1982) Thymidine incorporation as a measure of heterotrophic bacterioplankton production in marine surface waters: evaluation and field results. Mar Biol 66:109–120 Gallegos CL (1989) Microzooplankton grazing on phytoplankton in the Rhode River, Maryland: nonlinear feeding kinetics. Mar Ecol Prog Ser 57:23–33 Gasol JM, Vaqué D (1993) Lack of coupling between heterotrophic nanoflagellates and bacteria: a general phenomenon across aquatic systems? Limnol Oceanogr 38:657–665 González JM, Sherr EB, Sherr BF (1990) Size-selective grazing on bacteria by natural assemblages of estuarine flagellates and ciliates. Appl Environ Microbiol 56:583–589 Goosen NK, van Rijswijk P, Kromkamp J, Peene J (1997) Regulation of annual variation in heterotrophic bacterial production in the Schelde estuary (SW Netherlands). Aquat Microb Ecol 12:223–232 Havskum H, Hansen AS (1997) Importance of pigmented and colourless nano-sized protists as grazers on nanoplankton in a phosphate-depleted Norwegian fjord and in enclosures. Aquat Microb Ecol 12:139–151 Hoch MP, Kirchman DL (1983) Seasonal and interannual variability in bacterial production and biomass in a temperate estuary. Mar Ecol Prog Ser 98:283–295 Iriarte A, Purdie DA (1994) Size distribution of chlorophyll a biomass and primary production in a temperate estuary (Southampton Water): the contribution of photosynthetic picoplankton. Mar Ecol Prog Ser 115:283–297
Iriarte A, de Madariaga I, Díez-Garagarza F, Revilla M, Orive E (1996) Primary production, respiration, nitrification in a shallow temperate estuary during summer. J Exp Mar Biol Ecol 208:127–151 Iriberri J, Unanue M, Ayo B, Barcina I, Egea L (1990) Bacterial production and growth rate estimations from [3H]thymidine incorporation for attached and free-living bacteria in aquatic systems. Appl Environ Microbiol 44: 203–218 Jochem F (1989) Distribution and importance of autotrophic ultraplankton in a boreal inshore area (Kiel Bight, Wetern Baltic). Mar Ecol Prog Ser 53:153–168 Jürgens K (1992) Is there plenty of food for bacterivorous flagellates in eutrophic waters? Arch Hydrobiol Beih 37: 195–205 Jürgens K, Gasol JM, Vaqué D (2000) Bacteria-flagellate coupling in microcosm experiments in the Central Atlantic Ocean. J Exp Mar Biol Ecol 245:127–147 Kirchman D, Soto Y, van Wambecke F, Bianchi M (1989) Bacterial production in the Rhone River plume: effect of mixing on relationships among microbial assemblages. Mar Ecol Prog Ser 53:267–275 Kuipers BR, Witte HJ (1999) Grazing impact of microzooplankton on different size classes of algae in the North Sea in early spring and mid-summer. Mar Ecol Prog Ser 180: 93–104 Labry C, Herbland A, Delmas D, Laborde P, Lazure P, Froidefond JM, Jegou AM, Sautour B (2001) Initiation of winter phytoplankton blooms within the Gironde plume waters in the Bay of Biscay. Mar Ecol Prog Ser 212:117–130 Landry MR, Hassett RP (1982) Estimating the grazing impact of marine micro-zooplankton. Mar Biol 67:283–288 Lee S, Fuhrman JA (1987) Relationships between biovolume and biomass of naturally derived marine bacterioplankton. Appl Environ Microbiol 53:1298–1303 Legendre L, Rassoulzadegan F (1995) Plankton and nutrient dynamics in marine waters. Ophelia 41:153–172 Madariaga I (1995) Photosynthetic characteristics of phytoplankton during the development of a summer bloom in the Urdaibai Estuary (Bay of Biscay). Estuar Coast Shelf Sci 40:559–575 Madariaga I, de González-Azpiri L, Villate F, Orive E (1992) Plankton responses to hydrological changes induced by freshets in a shallow mesotidal estuary. Estuar Coast Shelf Sci 35:425–434 Margalef R (1978) Life forms of phytoplankton as survival alternatives in an unstable environment. Oceanol Acta 1: 493–510 McManus GB, Ederington-Cantrell MC (1992) Phytoplankton pigments and growth rates, and microzooplankton grazing in a large temperate estuary. Mar Ecol Prog Ser 87: 77–85 Murrell MC, Hollibaugh JT, Silver MW, Wong PS (1999) Bacterioplankton dynamics in northern San Francisco Bay: role of particle association and seasonal freshwater flow. Limnol Oceanogr 44:295–308 Orive E, Iriarte A, de Madariaga I, Revilla M (1998) Phytoplankton blooms in the Urdaibai estuary during summer: physico-chemical conditions and taxa involved. Oceanol Acta 21:293–305 Parsons TR, Maita Y, Lalli CM (1984) A manual of chemical and biological methods for seawater analysis. Pergamon, Oxford Peters F, Marrasé C, Gasol JM, Sala M, Arin L (1998) Effects of turbulence on bacterial growth mediated through food web interactions. Mar Ecol Prog Ser 172:293–303 Porter KG, Feig YS (1980) The use of DAPI for identifying and
Iriarte et al.: Microbial food web dynamics in an estuary
161
counting aquatic microflora. Limnol Oceanogr 25:943–948 Rassoulzadegan F, Sheldon RW (1986) Predator-prey interactions of nanozooplankton and bacteria in an oligotrophic environment. Limnol Oceanogr 31:1010–1021 Redden AM, Sanderson BG, Rissik D (2002) Extending the analysis of the dilution method to obtain the phytoplankton concentration at which microzooplankton grazing becomes saturated. Mar Ecol Prog Ser 226:27–33 Revilla M, Iriarte A, Madariaga I, Orive E (2000) Bacterial and phytoplankton dynamics along a trophic gradient in a shallow temperate estuary. Estuar Coast Shelf Sci 50: 297–313 Rivkin RB, Putland JN, Anderson MR, Deibel D (1999) Microzooplankton bacterivory and herbivory in the NE subarctic Pacific. Deep-Sea Res II 46:2579–2618 Ruiz A, Franco J, Villate F (1998) Microzooplankton grazing in the Estuary of Mundaka, Spain, and its impact on phytoplankton distribution along the salinity gradient. Aquat Microb Ecol 14:281–288 Sanders RW, Caron DA, Berninger UG (1992) Relationships between bacteria and heterotrophic nanoplankton in marine and fresh waters: an inter-ecosystem comparison. Mar Ecol Prog Ser 86:1–14 Sautour B, Artigas LF, Delmas D, Herbland A, Laborde P (2000) Grazing impact of micro- and mesozooplankton during a spring situation in coastal waters off Gironde estuary. J Plankton Res 22:531–552 Schuchardt B, Schirmer M (1991) Phytoplankton maxima in the tidal freshwater reaches of two coastal plain estuaries. Estuar Coast Shelf Sci 32:187–206 Sin Y, Webb KL, Sieracki ME (1998) Carbon and nitrogen densities of the cultured marine heterotrophic flagellate Paraphysomonas sp. J Microbiol Methods 34:151–163 Smayda TJ, Reynolds CS (2001) Community assembly in marine phytoplankton: application of recent models to
harmful dinoflagellate blooms. J Plankton Res 23:447–461 2olic´ M, Krstulovic´ N (1994) Role of predation in controlling bacterial and heterotrophic nanoflagellate standing stocks in the coastal Adriatic Sea: seasonal patterns. Mar Ecol Prog Ser 114:219–235 Strom SL, Brainard MA, Holmes JL, Olson MB (2001) Phytoplankton blooms are strongly impacted by microzooplankton grazing in coastal North Pacific waters. Mar Biol 138: 355–368 Tanaka T, Taniguchi A (1996) Short-term variation in abundance of bacteria and heterotrophic nanoflagellates in summer observed in Onagawa Bay, Japan. Bull Plankton Soc Jpn 43:21–29 Trigueros JM, Orive E (2000) Tidally driven distribution of phytoplankton blooms in a shallow, macrotidal estuary. J Plankton Res 22:969–986 Utermöhl H (1958) Zur Vervollkommnung der quantitativen Phytoplankton-Methodik. Mitt Int Ver Theor Angew Limnol 9:1–38 Vaqué D, Pace ML, Findlay S, Lints D (1992) Fate of bacterial production in a heteroptrophic ecosystem: grazing by protists and metazoans in the Hudson Estuary. Mar Ecol Prog Ser 89:155–163 Verity PG (1986) Grazing of phototrophic nanoplankton by microzooplankton in Narragansett Bay. Mar Ecol Prog Ser 29:105–115 Villate F, Franco J, Ruiz A, Orive E (1989) Caracterización geomorfológica e hidrológica de cinco sistemas estuáricos del País Vasco. Kobie 18:157–170 Weisse T (1999) Bacterivory in the northwestern Indian Ocean during the intermonsoon-northeast monsoon period. Deep-Sea Res II 46:795–814 Wikner J, Rassoulzadegan F, Hagström A (1990) Periodic bacterivore activity balances bacterial growth in the marine environment. Limnol Oceanogr 35:313–324
Editorial responsibility: David Caron, Los Angeles, California, USA
Submitted: May 31, 2002; Accepted: November 15, 2002 Proofs received from author(s): February 24, 2003