MICROLAYER MODELS FOR NUCLEATE BOILING SIMULATIONS: THE SIGNIFICANCE OF CONJUGATE HEAT TRANSFER S. Hänsch Department of Mechanical Engineering Imperial College London Exhibition Road, SW7 2BX, United Kingdom
[email protected] C. Narayanan, S. Reboux ASCOMP GmbH Technoparkstrasse 1, 8005 Zürich, Switzerland
[email protected],
[email protected] G. Giustini, S. Walker Department of Mechanical Engineering Imperial College London Exhibition Road, SW7 2BX, United Kingdom
[email protected],
[email protected] ABSTRACT The analysis of single-bubble nucleate boiling is complicated by the need to consider phenomena that occur over multiple length scales, ranging from centimeters, down to a few nanometers. In particular, the importance of the evaporation from a liquid microlayer, developing underneath a bubble during its initial growth, is much debated in literature. It is, however, generally accepted that in atmospheric pressure steam-water conditions such microlayer evaporation is a significant source of vapor for the bubble’s growth. The current practice in representing this microlayer is guided by experimental observations that it extends laterally some hundreds of microns beyond the contact-line of liquid, vapor, and solid. The evaporation of this liquid layer is accompanied by a vigorous cooling of the solid substrate directly below the microlayer region. In this paper the current microlayer model is investigated regarding its sensitivity towards the thermal response of the substrate. The investigations are performed via an approximate analytical treatment followed by interface-tracking simulations using the codes TransAT and PSI-Boil. The sub-grid microlayer model for treating the enhanced mass transfer underneath a growing bubble was included into a bubble growth analysis. Changing the wall boundary condition from a constant wall temperature to conjugate heat transfer allowed us to investigate the influence of the heat conduction into the solid on evolving bubble dimensions and mass transfer rates from the microlayer region. The analytical study and numerical computations confirm the importance of conjugate heat transfer for the proper prediction of microlayer models and show that the inclusion of the thermal response of the heater is an important part for any micro-scale simulation of nucleate boiling. Whilst such inclusion does reduce the predicted microlayer evaporation rate considerably, the results indicate that microlayer evaporation contributes a major part of the bubble’s growth. KEYWORDS nucleate boiling, microlayer, conjugate heat transfer, interface tracking
1. INTRODUCTION During the stages of bubble growth in a boiling process there are many possible ways by which the bubble can transfer heat. The relevant length scales for a single steam bubble boiling under atmospheric pressure range from centimeters (bubble departure size) down to a few nanometers (adsorbed layer thickness) and, thus, span nearly seven orders of magnitude. At the micro-scale a steam bubble can trap a thin layer of liquid at the wall during its initial growth, as first suggested by the early works of [1-3]. Due to its small thickness this liquid layer can then evaporate intensely generating high wall heat fluxes. The importance of the microlayer evaporation and its contribution to the bubble’s growth will depend strongly on both the fluid and substrate properties; and is, therefore, much debated in literature [4-6]. However, many experiments suggest that in atmospheric steam-water conditions microlayer evaporation becomes a significant source of vapor for the bubble’s growth [6-8]. Recent experiments include detailed, local measurements of the wall heat transfer and allow the profound investigation of the events very close to the wall [6, 7, 9-11]. These measurements confirm the existence of a thin liquid microlayer and, in particular, the vigorous cooling effect its evaporation has on the area directly below the microlayer region. In this paper the approach to modeling the enhanced heat transfer underneath a bubble with a microlayer model is analyzed analytically and by numerical computations using the interface-tracking codes TransAT and PSI-Boil. In section 2 we explain the physical basis of the main approach, while in section 3 we attempt to understand via analytical means the sensitivity of it to the associated modeling of transient heat conduction in the adjoining substrate. In section 4 we extend this investigation to the use of interface tracking computational models. 2. PHYSICAL MODELS OF THE BOILING PROCESS 2.1. Overview A large number of experimental investigations, including very recent detailed microscopic studies [6, 7, 9-11], have generated what seems to be a consensus picture of the general configuration and physical processes underway during the steam bubble growth in atmospheric pressure water on a heated substrate. We will focus here on events at and very close to the substrate, and a diagram of this portion of a bubble is shown in Figure 1. Dimensions usually vary from bubble to bubble, very greatly during an ebullition cycle, and differ greatly with conditions, such as pressure.
Figure 1. Section and plan of the configuration close to the wall during bubble growth (not to scale).
In the upper regions of the bubble, there will be either evaporation from or condensation onto the liquidvapor interface, depending on the local temperature of the water surrounding that portion of the bubble. Whilst both of these “macroscopic” phase change mechanisms can be very important in bubble growth, they are not the focus of our present attention. Starting at the center, we have a "dryout” region. No evaporation is believed to take place from this region, and the region may well be significantly hotter than the saturation temperature at the bubble pressure, but nonetheless it is thought by many works that this "dry" region is itself actually coated with a monolayer of water molecules, adhering strongly to the metal surface. Since it does not participate in any event in the generation of vapor, it plays no role for present purposes. Moving radially outwards, the next region indicated is generally termed the "contact-line". Here there is a relatively abrupt beginning of a thin layer of water. The balance of the three surface energies (solid-liquid, liquid-vapour and solid-vapour) becomes unstable due to very high evaporation rates, leading to the emergence of a “micro-contact angle” [12]. The contact-line can be thought of as a very short (~1µm) transition region at the boundary between the dryout region and the actual microlayer. For present purposes the final region, the "microlayer", is taken as beginning once an essentially uniform thickness of water film has been established, and this more or less uniform thickness is considered to extend for some considerable distance, until the bubble’s outer curvature begins. An indication of the geometry typically understood to obtain in this region is given in Figure 3. At the outer radial position the tangent to the liquid surface suddenly changes from being almost parallel to the substrate to having a significant angular separation from it. Viewed macroscopically, this is generally what is identified as the "macro-contact angle", where the liquid-vapor interface appears to be in contact with the solid substrate. Plainly, for the model just described, this is not literally a contact between the three materials (liquid, vapor, and solid). The typical temporal evolution of the dryout radius and outer radius of the microlayer for subsequent steam bubbles under atmospheric pressure is illustrated in Figure 2, as measured by the experiments of [11]. These measurements allow us to plot approximate dry patch, contact line and microlayer areas versus time. The comparison in Figure 2 shows that the contact-line area is generally very small compared to the extended microlayer region, which covers the major part of the area underneath the bubble for most of the ebullition time. Therefore, the contribution of any evaporation occurring from the contact-line can be neglected in the further analysis, as it was suggested by [13].
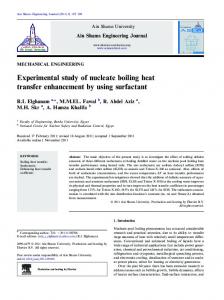
Figure 2. Temporal evolutions of the radius of the contact-line, and the outer radius of the microlayer taken from Jung (2015) (left); and the corresponding evolutions of the area of the dry patch, of the contact-line, and of the microlayer over time (right).
There is a main approach to the analysis of the heat transfer and vapor generation in the near-wall region underneath a bubble, namely the microlayer model as described in [13, 14]. In the following sections we will describe the physical basis for this model, and the physical approximations that are incorporated in its analysis. 2.2. Microlayer models The microlayer model starts from the experimental observation that an almost flat, slightly conical, very thin liquid layer of significant radial extent is observed beneath these bubbles. It is thinner towards the center, and increases gradually in thickness with radius as illustrated in Figure 3. In cross-section the liquid-vapor surface in this region is more or less a straight line. The radial extent of this layer grows as the bubble grows. Evaporation takes place from this layer, driven by heat conduction through the layer from the solid substrate beneath. This provides some of the vapor that drives the bubble growth, an amount of which is still debated in literature.
Figure 3. Schematic of the microlayer region (not to scale).
Once a fresh portion of the layer has been formed, or ‘left behind’, by the growth of the bubble, no further liquid is believed to flow into the layer along the surface. Rather, as this evaporation takes place the layer becomes thinner. Evaporation eventually reduces the thickness to the adsorbed layer thickness, and as this occurs first at the slightly thinner, radially inboard end, the consequence is a hot dry patch in the center of the bubble that grows in radius over time. Thus, the radial expansion of the dryout region becomes a direct consequence of microlayer evaporation. Assuming that the thermal capacity of the liquid in the microlayer and the interfacial resistance are negligible, the heat conduction problem within the microlayer can be described as:
∂δ kl (TW − Tsat ) = ∂t δ (r,t)ρ l h fg
(1)
For the simple case of a constant wall superheat the microlayer thickness can then be described as a function of time and distance from the bubble root:
δ (r,t) = δ (r,0)2 −
2kl (TW − Tsat )t ρ l h fg
(2)
The early work of [3] provides an expression for the initial thickness of the microlayer, which is based on an analysis of the hydrodynamics during the microlayer formation. They postulated that the initial thickness of the microlayer is given by
δ (r,0) = C2 υl t g
(3)
with C2=0.8 and tg being the time taken for a bubble to grow to a particular location on the heater. By assuming hemispherical bubble growth this time can be estimated by the correlation of Plesset and Zwick [15] to be:
r C1
tg =
(4)
with
C1 =
2ΔTsat kl h fg ρ v
3 πα l
(5)
The heat flux at any position covered by part of the microlayer is then given by:
q!′′ =
kl (TW − Tsat ) δ ( r,t )
(6)
Some analytical studies by Cooper and Lloyd [3] integrate the initial microlayer profile according to Eq. (3) radially, and through time, using the assumption of ideal hemispherical bubble growth and a constant wall temperature. Thus, an analytical expression for the evaporated volume from the liquid microlayer was derived as a function of time:
VML
4π C12C2 kl ΔT υl1/2t 3/2 = 3 ρ v h fgC22υl + 2kl ΔT ρ v / ρ l
(7)
A detailed derivation of Eq. (7) can be found in [3]. Derived after time this equation gives us the integrated volume production rate coming from the microlayer evaporation. The corresponding integrated mass transfer rate over time is illustrated as red line in Figure 6 and compared to the mass transfer rate necessary for an ideal hemispherical bubble growth. The graph shows that the microlayer model is capable to provide a major part of the vapor production for the case of a constant wall superheat of 10K. 3. APPROXIMATE ANALYSIS OF SENSITIVITY TO SUBSTRATE THERMAL RESPONSE The analysis above has generally taken the substrate surface temperature to be fixed. With such high heat fluxes predicted, it is however likely that the wall surface temperature will be caused to fall, and thermal diffusivity within the substrate will exert a significant influence on heat transfer and evaporation. We will now move to an investigation of this. 3.1. Substrate cooling during microlayer evaporation As discussed, the physical basis of the microlayer evaporation model consists of simple heat conduction through the liquid layer, such that the layer evaporates until it in effect vanishes. The local heat flux is
given by Eq. (6). Typical average dimensions of a microlayer and substrate properties are listed in Table 1. With an average microlayer thickness of 2µm (half of the maximum thickness in Table 1), we can estimate a typical heat flux during microlayer evaporation from Eq. (6) with a constant wall superheat of 10K, as being ~3400kW/m2.
Table 1. Characteristic microlayer dimensions and sapphire substrate properties. Microlayer quantities Max. Thickness Radial extent Bubble ebullition period Microlayer evaporation period Nominal wall superheat Sapphire properties Nominal wall superheat Substrate specific heat Substrate thermal conductivity Substrate density
µm µm ms ms K
4 500 15 10 10
K J kg-1 K-1 W m-1 K-1 kg m-3
10 900 30 3970
As a simple model by which to assess the effect this has on the wall surface temperature, we will consider a semi-infinite solid (sapphire, typical of experimental arrangements such as [9]) of uniform initial temperature subject to this heat flux for some time period τ. From [16], the reduction in wall surface temperature is given by:
TW (τ ) − TW ( 0 ) = −
2 q!′′ ks τ ks πρ sC ps
(8)
Temperature fields propagating into the solid surface under these conditions are shown Figure 4. We need to identify some characteristic time over which to apply this heat flux. Plainly, it will be a sub-multiple of the overall bubble ebullition time. Waiting (nucleation) times can form a significant part of this, and the microlayer exists for not all of the period for which the bubble exists. For the conditions investigated in this paper the bubble growth time from nucleation to departure is ~15ms. We will apply the above heat flux in Eq. (8) for a range of times up to this ebullition period. The associated range of surface temperature reduction is shown on the left hand side in Figure 5. The entire surface superheat is removed within less than 1ms showing that computing the heat flux via an isothermal boundary condition leads to an excessively quick drop in surface temperature. This simple-minded calculation can now be compared to an analysis, which includes values of actual experimental observations. Using the microlayer dimensions in Table 1, according to [13] we can estimate a typical wedge-shaped microlayer volume to be:
2 VML = π R 2δ max 3
(9)
The experiments of [17] suggest that the entire microlayer is evaporated within 10ms. If we take this time period over which to evaporate the entire microlayer volume an average wall heat flux based on measurements is obtained:
q!′′ =
2 δ max ρ l Δh fg 3 τ
(10)
The average heat flux during the unsteady evaporation process calculated with Eq. (10) with the values in Table 1 is ~600kW/m2. Even though on a real heater surface local wall heat fluxes change significantly during an ebullition cycle, this average flux agrees well with recent experimental observations of [17], who observed that the wall heat flux under the microlayer ranges between 400-900kW/m2. In order to drive the derived heat flux of 600kW/m2 through an average microlayer thickness of 2µm, as assumed in the simple-minded calculation above, an average surface superheat of only ~2K is needed. This comparison indicates how much the surface has been cooled by the microlayer evaporation in the considered measurements.
Figure 4. Transient temperature distributions in the substrate at a range of times for an assumed isothermal evaporation through an average film of 2µm thickness, 10K initial superheat considered.
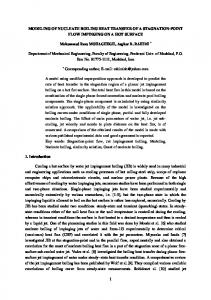
Figure 5. The variation of surface temperature reduction with time for isothermal evaporation through an average film of 2µm thickness (left) and for an average heat flux of the 600kW/m2 (500µm x 4 µm microlayer evaporating over 10ms) (right). Different lines for a range of average and maximum film thicknesses.
We will apply the heat flux of 600kW/m2, as calculated above, to Eq. (11) up to the time when the microlayer has been depleted. The associated range of surface temperature reduction is shown as yellow line on the right hand side in Figure 5, for which a temperature drop of 4-5K can be observed. The investigation was repeated for a range of different maximum microlayer thicknesses and is illustrated in Figure 5. If we assume an average wall surface temperature drop according to Eq. (8) applying an average wall heat flux with a range of maximum film thicknesses (1µm, 2µm, 4µm, 6µm and 8µm) for the calculation of the evaporation rate in Eq. (10) the influence of the heat conduction into the solid on the evaporated volume from the microlayer can be estimated. The colored lines in Figure 6 show that the integrated mass transfer rate can drop significantly when the surface temperature drop is considered. The evaporation rate with the typical microlayer dimension given in Table 1 (yellow line in Figure 5) drops to ~50%. The comparison with a constant wall temperature case makes us realize that microlayer models cannot be investigated without considering the cooling of the solid underneath and that the thermal response of the heater should be an integral part of the simulations. Likewise, the correct description of the temperature field within the substrate during bubble growth is only possible with an accurate microlayer model.
Figure 6. Total vapor volume produced by the microlayer model over time for a constant wall temperature (red line), and for a variable surface temperature according to the evaporation of an idealized microlayer wedge for a range of assumed maximum film thicknesses.
3.2. Substrate temperature recovery between periods of microlayer evaporation Cooling that occurs during the microlayer evaporation period will mean that once the surface is quenched and re-wetted it will nonetheless be rather cooler than had it been an isothermal surface. Just how significant this effect is depends largely on the ratio between the duration of the microlayer evaporation process, and the rest of the ebullition period, during which the recovery can occur. A simple analytical treatment is not possible (and we will be studying a proper numerical treatment in the next section), but for the nominal microlayer duration of one quarter of the ebullition period considered, the recovery will
be incomplete, and the starting point for the next cycle would thus be slightly lower. The single-cycle analysis, thus, will rather underestimate the significance of the substrate cooling. 4. COMPUTATIONAL INVESTIGATION The analytical investigation of the significance of conjugate heat transfer for the sub-grid model approach is further extended to computational investigations using interface-tracking codes. The computational investigation has been performed with the interface-tracking code TransAT developed at ASCOMP GmbH. TransAT is a multi-physics, finite-volume code using structured meshes and a collocated grid arrangement. For the work presented here the level set method has been applied, representing the interface as the zero level set of a scalar distance function. Since the contours of the level set field can deform as the phases move due to numerical errors, a re-distancing algorithm is required, for which a 3rd order WENO (Weighted Essentially Non-Oscillatory) scheme was used. The simulations were conducted with the diffuse-interface approach, which has been validated in [18]. For the microlayer model an initial microlayer profile according to Eq. (3) was assumed. As yet this model is restricted to Dirichlet boundary conditions, allowing us the means to investigate behavior without a thermally coupled substrate. The investigation further includes a code-to-code comparison with the research-code PSI-Boil. PSI-Boil is an established interface-tracking code for boiling flows offering a microlayer model paired with conjugate heat transfer. Therefore, the code comparison allows us to investigate the influence of conjugate heat transfer on the performance of the microlayer model. PSI-Boil is designed to solve 3D problems using the finite volume method with staggered grid arrangement and a VOF-CIP technique to track moving interfaces [19]. A sharp-interface phase change model was applied, which has been validated in [20]. The microlayer model implemented in PSI-Boil resembles the one suggested by [14], which is based on the same physics as the model described in this paper, but assumes a different experimentally measured initial microlayer profile. 4.1. Setup As a test case we analyze nucleate boiling in atmospheric pressure steam-water conditions. The computational domain, as illustrated in Figure 7, was specified as 6mm in the horizontal and 10mm in the vertical direction. For the TransAT simulations a 2D axisymmetric sector was considered, corresponding to an angle of 1 rad. For the three-dimensional PSI-Boil runs a quarter of the domain had to be modeled.
Figure 7. Computational Setup for the grid (left) and the temperature field (right).
For the top of the domain an outflow boundary condition was applied, while for the sides symmetry was assumed. For the contact-line between vapor, liquid and solid a static apparent contact angle of 80˚ was specified. The gas-liquid interface is seeded with a bubble radius of 0.2mm. Initially, the entire domain is initialized at rest with a thermal boundary layer thickness evaluated from the correlation for turbulent natural convection heat transfer:
δ T = 7.14 3
υ lα l gβT ΔT
(11)
4.2. Numerical results 4.2.1. Microlayer model with Dirichlet boundary condition The subsequent simulations were performed with a Dirichlet boundary condition and a microlayer model. For the PSI-Boil run a pseudo-Dirichlet boundary condition was applied by using a heater chosen to be extremely thin (50µm) and with a conductivity value higher than usual substrate values (1500W/mK), such that the underside of the water was maintained to within a fraction of a degree of the temperature of the underside of the substrate. The lower surface of this substrate is kept at a constant temperature of 110˚C, and no volumetric heat source is used. Snapshots of the mass transfer rate during the bubble growth and induced velocities for the TransAT run are presented in Figure 8. The resulting bubble dimensions of both runs are illustrated in Figure 9.
Figure 8. Snapshots of the bubble growth with microlayer evaporation for the TransAT run.
The constant wall temperature case generally produces bubble radii greater than the ones observed in similar experiments [9]. The equivalent diameter reaches experimental departure diameters of ~3-4mm after only 2ms. Naturally, the cooling of the substrate would decrease the microlayer heat flux during the ebullition cycle. According to [11] the microlayer evaporation vanishes after 10ms due to the cooling of
the underlying substrate, which is not accounted for when applying a constant wall temperature. The microlayer evaporation prevents the bubble from detaching since it continuously pumps steam into the bubble and changes the dynamics within the bubble.
Figure 9. Comparison of predicted bubble dimensions with TransAT (Dirichlet boundary condition) and PSI-Boil (Dirichlet and conjugate heat transfer boundary condition).
The bubble dimensions and equivalent bubble diameter obtained with TransAT and PSI-Boil in Figure 9 show very similar trends with a slightly larger bubble growth rate observed for TransAT. The biggest difference can be seen for the bubble height, which increases more drastically due to a less equally distributed wall heat flux predicted by the sub-grid model in TransAT. However, the different initial microlayer profiles assumed in the two models do not significantly change their overall performance. The conduction heat flux across the microlayer is inversely proportional to the microlayer thickness. Therefore, the microlayer models predict high heat transfers underneath the bubble with the highest occurring where the microlayer is thinnest, just next to the dryout region. Here vapor production induces high steam velocities, which is the reason for the observed excessive bubble heights. In summary, the simulations confirm the idea that the importance of microlayer evaporation is extremely exaggerated when working with a Dirichlet boundary condition.
4.2.2.
Microlayer model with conjugate heat transfer
For the conjugate heat transfer case with PSI-Boil the substrate was initialized at TSAT and heated by a planar heat source on top corresponding to an input heat flux of 28.7kW/m2 in order to reproduce actual experimental conditions [9]. After the surface temperature reaches the 10K of superheat a vapor seed is placed. Thus, the fluid above the substrate has time to establish a conductive thermal boundary layer (which is thinner than the previously assumed thermal boundary layer thickness according to Eq. (11)). The results are compared against the previous constant wall temperature cases in Figure 9. In terms of bubble dimensions a significant change of bubble growth can be observed. Bubble base radius and lateral extension of the bubble grow significantly slower. The bubble height growth drops the most, probably due to the presence of a smaller conductive thermal boundary layer. This layer would grow from bubble cycle to bubble cycle and thereby increase the contribution of evaporation from the superheated liquid layer through the upper interface of the bubble. According to the model the conduction heat flux across the microlayer is inversely proportional to the microlayer thickness. However, for the conjugate case it is also proportional to the temperature difference TW-TSAT on the surface. Thus, for the conjugate case the effects of radially increasing microlayer thickness and temperature difference balance out and flatten the wall heat flux profile. This, on the other hand, also evens out velocities within the bubble and changes the bubble behaviour and dimensions.
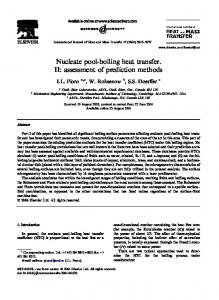
Figure 10. The integrated mass transfer rates (total and microlayer contribution) of the TransAT run (Dirichlet) and the PSI-Boil runs (Dirichlet and conjugate heat transfer).
Figure 10 illustrates the evaporative mass transfer rates for all the runs with Dirichlet boundary condition and the PSI-Boil run including conjugate heat transfer. The mass transfer rates are further distinguished in the total rate and the contribution of the microlayer evaporation model. The graph clearly shows that most of the bubble’s growth is attributed to the sub-grid model in both the TransAT and PSI-Boil runs (>95%). The contribution of the macro phase change from the superheated liquid layer would still change over subsequent bubble cycles due to building up a quasi-steady thermal boundary layer. However, the graphs using the average convective thermal boundary layer according to Eq. (11) are already representative for the significance of the microlayer contribution to the bubble growth rate. The dashed lines for the PSIBoil run with conjugate heat transfer confirm the estimate in Figure 6 regarding the importance of the
thermal response of the heater to the microlayer model performance. The mass transfer rate drops to approximately 50% of the one calculated with a constant wall superheat. The vapor production due to microlayer evaporation is extremely exaggerated when working with a Dirichlet boundary condition. However, relative to the macro phase change the microlayer evaporation stays the dominant source of vapor production for the bubble. It has to be noted that the PSI-Boil results with conjugate heat transfer show only the first bubble nucleating within a conductive thermal boundary layer. Computations should be carried out over several bubble cycles until no cycle-to-cycle change in the bubble growth pattern is observed to extract quasi steady-state data for a quantitative analysis. Furthermore, in order to get the correct departure behaviour the dynamics around the bubble are significant and can only be represented correctly by using a larger domain as the one applied in the code comparison here. However, the results show the importance of the heat conduction into the solid for the calculated mass transfer rates from the sub-grid models and confirm the approximate manual analysis in section 3. 5. CONCLUSIONS Different approaches of modeling the heat transfer mechanisms underneath a growing bubble have originated over time. Existing sub-grid models for interface-tracking codes can be identified as contactline and microlayer models and lead to significantly different vapor production rates. Fundamentally this is due to the fact that the contact-line and the microlayer cover very different amounts of the substrate’s surface area. Microlayer representation in CFD models has been assessed, in particular with regards to the importance of conjugate heat transfer. An analytical investigation indicates that the microlayer contribution to the bubble’s growth strongly depends on the thermal response of the heater and the corresponding drop of surface temperature underneath the liquid layer. Analytical investigations were supported by numerical computations with the interface-tracking codes TransAT and PSI-Boil. Sub-grid model approaches with different initial microlayer profiles were included into the investigations. The results were analyzed regarding the evolution of bubble dimensions and the total vapor production in total and from the sub-grid region over time. Although assuming different initial microlayer profiles within their microlayer models, both TransAT and PSI-Boil simulations produce similar bubble dimensions and mass transfer rates over time for a constant wall temperature case. The computational results show that the microlayer model strongly exaggerates the vapor production when applying a Dirichlet boundary condition. The unbalanced conduction heat flux from the sub-grid model, being inversely proportional to the temperature profile, affects the dynamics within the growing bubble and excessively delays the bubble detachment. For the conjugate heat transfer case the heat flux from the microlayer is balanced by the temperature difference on the substrate’s surface. The interaction between microlayer model and the conjugate heat transfer influences the dynamics within the growing bubble as well as the integrated mass transfer rate, which drops to about 50% when considering the thermal response of a sapphire substrate. In both the Dirichlet and conjugate heat transfer cases the sub-grid model for microlayer evaporation accounts for the major part of the bubble’s growth. Even though the investigations were limited to the first bubble cycle with a not yet fully established quasi-steady thermal boundary layer, the present results seem to confirm the general importance of microlayer evaporation under atmospheric steam-water conditions. For further microlayer model developments the thermal response of the solid is an essential aspect to be considered. 6. ACKNOWLEDGMENTS The work is supported by EPSRC in collaboration with the ASCOMP GmbH. The authors thank Yohei Sato and Bojan Ničeno for making their research code PSI-Boil available for this study.
7. REFERENCES 1. 2. 3. 4. 5. 6. 7. 8. 9. 10. 11. 12. 13. 14. 15. 16. 17. 18. 19. 20.
Snyder, N.R. and D.K. Edwards. Summary of Conference on Bubble Dynamics and Boiling Heat Transfer. 1956. Jet Propulsion Laboratory. Hendricks, R.C. and R.R. Sharp, Initiation of Cooling due to Bubble Growth on a Heating Surface, 1964, NASA. Cooper, M.G. and A.J.P. Lloyd, The microlayer in nucleate pool boiling. Int. J. Heat Mass Tran., 1969. 12: p. 895-913. Kim, J., Review of nucleate pool boiling bubble heat transfer mechanisms. Int. J. Multiphase Flow, 2009. 35: p. 1067-1076. Delgoshaei, P., Microscale Heat Transfer Measurements Durin Subcooled Pool Boiling of Pentane: Effect of Fluid Properties and Bubble Dynamics, in Department of Mechanical Engineering2009, University of Maryland. p. 135. Utaka, Y., et al., Heat transfer characteristics based on microlayer structure in nucleate pool boiling for water and ethanol. Int. J. Heat Mass Tran., 2014. 68: p. 479-488. Gerardi, C., et al., Study of bubble growth in water pool boiling through synchronized, infrared thermometry and high-speed video. Int. J. Heat Mass Tran., 2010. 53: p. 4185-4192. Yabuki, T., T. Saitoh, and O. Nakabeppu, Contribution of microlayer evaporation to bubble growth in pool saturated boiling of water, in ASME 2013 11th International Conference on Nanochannels, Microchannels, and Minichannels2013: Sapporo, Japan. Duan, X., B. Phillips, and J. Buongiorno, Synchronized High-Speed Video, Infrared Thermometry, and Particle Image Velocimetry Data for Validation of Interface-Tracking Simulations of Nucleate Boiling Phenomena. Exp. Heat Transfer, 2013. 26: p. 169-197. Kim, H. and J. Buongiorno, Detection of liquid–vapor–solid triple contact line in two-phase heat transfer phenomena using high-speed infrared thermometry. Int. J. Multiphase Flow, 2011. 37: p. 166-172. Jung, S. and H. Kim, An Experimental Study on Heat Transfer Mechanisms in the Microlayer using Integrated Total Reflection, Laser Interferometry and Infrared Thermometry Technique. Heat Transfer Eng., 2015. 36(12): p. 1002-1012. Phan, H.T., et al., How does surface wettability influence nucleate boiling? C. R. Mecanique, 2009. 337: p. 251-259. Guion, A., D. Langewisch, and J. Buongiorno, Dynamics of the liquid microlayer underneath a vapor bubble growing at a heated wall, in Summer Heat Transfer Conference2013: Minneapolis, MN, USA. p. 1-13. Utaka, Y., Y. Kashiwabara, and M. Ozaki, Microlayer structure in nucleate boiling of water and ethanol at atmospheric pressure. Int. J. Heat Mass Tran., 2013. 57: p. 222-230. Plesset, M.S. and A. Zwick, The growth of vapour bubbles in superheated liquids. J. Appl. Phys., 1954. 25(4): p. 493-450. Carslaw, H.S. and J.C. Jaeger, Conduction of Heat in Solids. 2nd ed. 1959, Oxford University Press. Jung, S. and H. Kim, An experimental method to simultaneously measure the dynamics and heat transfer associated with a single bubble during nucleate boiling on a horizontal surface. Int. J. Heat Mass Tran., 2014. 73: p. 365-375. Guion, A., et al., Closure Relation for Microlayer Evaporation in Nucleate Boiling, and its Application to ITM Test Case 3b, 2013. Sato, Y. and B. Ničeno, A conservative local interface sharpening scheme for the constrained interpolation profile method. Int. J. Numer. Meth. Fl., 2012. 70(4): p. 441-467. Sato, Y. and B. Ničeno, A sharp-interface phase change model for a mass-conservative interface tracking method. J. Comput. Phys., 2013. 249: p. 127-161.