See discussions, stats, and author profiles for this publication at: https://www.researchgate.net/publication/281630236
Numerical Simulation of Subcooled Nucleate Boiling in Cooling Jacket of IC Engine Conference Paper in SAE Technical Papers · April 2013 DOI: 10.4271/2013-01-1651
CITATIONS
READS
2
23
2 authors: Hemant Punekar
Saurish Das
ANSYS
Technical University of Eindhoven
17 PUBLICATIONS 60 CITATIONS
6 PUBLICATIONS 3 CITATIONS
SEE PROFILE
All in-text references underlined in blue are linked to publications on ResearchGate, letting you access and read them immediately.
SEE PROFILE
Available from: Saurish Das Retrieved on: 23 June 2016
THIS DOCUMENT IS PROTECTED BY U.S. AND INTERNATIONAL COPYRIGHT. It may not be reproduced, stored in a retrieval system, distributed or transmitted, in whole or in part, in any form or by any means. Downloaded from SAE International by Hemant Punekar, Thursday, April 04, 2013 05:31:52 AM
Numerical Simulation of Subcooled Nucleate Boiling in Cooling Jacket of IC Engine
2013-01-1651 Published 04/08/2013
Hemant Punekar and Saurish Das Ansys Inc, Copyright © 2013 ANSYS Inc. doi:10.4271/2013-01-1651
ABSTRACT There has been a change in the thermal management of IC engines where engineers now like to harness the superior heat transfer rates available when limited and controlled nucleate boiling is used to remove heat from high temperature zones. Any flaws in the design of such systems, such as uncontrolled boiling that leads to Dry Out situation, can have an adverse effect on the cooling performance. A detailed engineering model of this process would allow engineers to weed out flawed designs early in the design process. In this paper, we proposed and validated a CFD model for this process. A CFD model is built using the commercial CFD solver ANSYS FLUENT. The mixture multiphase model is used to study subcooled nucleate boiling in IC engine cooling jackets. The departure of bubbles enhances heat transfer at walls, which is captured using the empirical correlation. Volumetric mass transfer is modeled using the inbuilt evaporation-condensation model. Results obtained from heat transfer in channels are compared with experimental results available in the literature for a range of operating pressures, different inlet sub-cooling and different inlet flow velocities. The predicted heat fluxes are in good agreement with experimental data. Results from a typical I.C. engine cooling jacket geometry are also presented.
INTRODUCTION Cooling plays an important role in optimal performance of an IC engine. Insufficient cooling results into degraded performance, reduced power and, in long run, may result into engine failure due to wear, cracking or warping. The objectives of IC engine cooling jacket design are as follows: • Keep wall temperatures of different components within acceptable levels to avoid loss of power and failure due to thermal stresses.
• Avoid flow maldistribution in the cooling jacket. Since engine jacket has complex flow passages, there is a possibility of stagnant zone or high velocity zones. While the former may cause hot spots, the latter may result in higher pressure drop. • Minimize the pressure drop For IC engine cooling, typical coolant used is aqueous ethylene glycol (an anti-freeze mixture). Its boiling temperature ranges from 108 C to 142 C, for a pressure range of 1 bar to 3 bar, and 50/50Vol% composition. Coolant temperature at the inlet is typically maintained at 90 C [1], which is very close to boiling temperature. Hence, there is a possibility of coolant boiling inside the cooling jacket, especially in the regions of high heat flux, e.g. walls near the exhaust port, fire deck etc. Depending on the regime of boiling, it may have favorable or adverse effect on the cooling jacket performance. As long as the cooling wall temperature is below the boiling temperature, there is no boiling. Up to certain wall temperature above the saturation temperature, the boiling takes place in form of bubbles only. This is called nucleate boiling and it is desired mode for any so-called boiling based cooling system as it increases the overall heat transfer coefficient. At higher wall temperatures, the vapor forms a film over the wall. This is called Dry-Out situation, which reduces the local heat transfer coefficient significantly. As cooling jacket has horizontal passages and has a complex shape, there is a possibility of stratification of vapor forming a film, which creates local vapor pockets/vapor trap near the wall. This is similar to Dry-Out situation encountered in flow boiling and has the same effect, i.e. reduction of local heat transfer coefficient. As mentioned earlier, nucleate boiling occurs locally in cooling jackets and the engine designers are aware of this
THIS DOCUMENT IS PROTECTED BY U.S. AND INTERNATIONAL COPYRIGHT. It may not be reproduced, stored in a retrieval system, distributed or transmitted, in whole or in part, in any form or by any means. Downloaded from SAE International by Hemant Punekar, Thursday, April 04, 2013 05:31:52 AM
fact. The recent trend is to make more deliberate use of the nucleate boiling and at the same time avoid Dry-Out situation to further optimize the cooling jacket design. CFD is one of the most powerful tools to gain insight of the flow and heat transfer process. With appropriate modeling of the boiling phenomenon, it is possible to know the wall superheat, regions of boiling and regime of boiling. Considering two phase system, it is possible to model vapor transport with in the cooling jacket and locations of vapor trapping and stratification. With all these advantage, it is also worth noting here that the accuracy of CFD results depends on the accuracy of the model used to describe the physical process, use of suitable grid resolution and proper convergence.
LITERATURE REVIEW With the help of increased computational resources, now it has become possible to simulate bubble growth near the boiling wall [2, 3, 4], but such studies are restricted to a small number of growing bubbles on a simple geometry with ideal surfaces. Such model-free numerical prediction for boiling in a real world engineering problem is far beyond the scope of today's computational power. Moreover due to limited understanding of near wall phenomenon of boiling, some researchers [5, 6] even consider it rather as an unpredictable chaotic process that causes fluctuations of wall heat flux and/or wall temperature. The engineering need to predict boiling heat transfer in real life applications motivated several researchers, CFD analysts and design engineers to develop boiling heat transfer models based on experimental correlations, which involve a great deal of empiricism to tackle the effect of surface roughness, surface fluid combination, surface initial condition etc. For most of the complex engineering cases people rely on experimental correlations for boiling heat and mass transfer derived for a particular situation. To predict nucleate boiling, a great variety of “single equation” “1-D” wall heat flux models are available in the literature. These models make use of bulk properties averaged over a cross-sectional area, normal to the mean flow, and a set of correlations based on experimental data for well-established flow (e.g. fully developed parallel flow without any swirl, separation, wake etc.). Those existing single equation 1-D models can be broadly grouped into two categories: • General empirical correlations, which correlate the wall heat transfer rates or heat transfer coefficient with wall super heat through non-dimensional groups [7, 8, 9, 10]. • Mechanistic models or partitioning models, which attempt to capture total heat transfer by dividing it into single phase convective heat transfer part and boiling evaporative heat transfer part obtained from experiments [1, 2, 11, 12, 13, 14, 15, 16].
As mentioned earlier, all these models are created and validated in simple geometries, like pipe, rectangular duct or in annular section. Sometimes a complex 3-D problem like engine cooling jacket is simplified to 1-D problem, in which it is represented as a channel of equivalent hydraulic diameter and these models are used[15, 16]. To get spatial and/or temporal variation of temperature and vapor fraction, some of these models are extended and implemented in 3-D CFD solver. Despite their more physical basis, they still involve a good deal of empiricism. Over the last two decades, the two-fluid multiphase method with the so called RPI wall boiling model, developed by Kurul & Podowski [17] in Rensselaer Polytechnic Institute, has been established as the modeling approach for mechanistic prediction of boiling phenomena. In our previous work [18] we had discussed the implementation of RPI wall boiling model in ANSYS FLUENT and its validation. It is a detailed boiling model that works with eulerian multiphase model, considering various sub-mechanisms of boiling like near wall bubble dynamics and heat flux partitioning. This model is widely used to investigate boiling in conditions found in the nuclear industry [17, 18], which is high pressure steam-water systems. Some researchers also have observed that it is difficult to use RPI approach at lower operating pressures [19]. In recent years a few researchers have carried out 3-D CFD investigations focusing on the boiling heat transfer analysis of the I.C. engine cooling jacket. Tao Bo [20] implemented a reduced order boiling model in CFD environment and validated with experimental data. This mechanistic model uses Rohsenow's pool-boiling correlation [14] to predict the flow boiling. It neither accounts the effect of bulk velocity of the flow nor considers modification of the empirical correlation for flow boiling. Srinivasan [21] used similar approach for boiling of pure water, but for evaporative heat transfer coefficient Chen's correlation [22] was used. It had been implemented in Euler-Euler multi-fluid frame work and it used empirical correlations for near wall bubble dynamics. Euler-Euler multiphase model solves transport equations for each phase which makes it computationally expensive. Chen's correlation has also been employed by Fan et al. [23]. Thus, there is a significant research work going on to develop a wall boiling model which can be used for low pressure boiling conditions typically encountered in cooling jacket application. Each model has its own unique advantages and disadvantages. In the present work, a wall boiling model is developed in mixture multiphase frame work. This newly developed model is robust, computation friendly and reasonable accurate for design comparison/ optimization. It is validated for aqueous ethylene glycol anti-freeze mixture flowing over a rough cast aluminum alloy surface that has properties similar to the passages of a cooling jacket of typical IC engine. This model is applied to a real life cooling
THIS DOCUMENT IS PROTECTED BY U.S. AND INTERNATIONAL COPYRIGHT. It may not be reproduced, stored in a retrieval system, distributed or transmitted, in whole or in part, in any form or by any means. Downloaded from SAE International by Hemant Punekar, Thursday, April 04, 2013 05:31:52 AM
jacket geometry with typical conditions and obtained results are discussed.
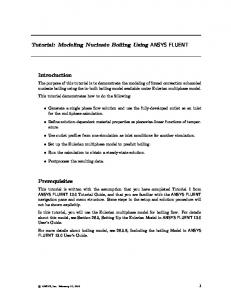
POOL BOILING AND FLOW BOILING It is worth to describe in detail the flow boiling phenomenon and boiling regime transaction as compared to pool boiling. First detailed study for pool boiling was conducted by Nukiyama [24] using an electric heated platinum wire immersed in a pool of liquid. He broadly categorized it into single phase natural convection region, nucleate boiling, transition boiling and film boiling. During nucleate boiling, due to bubble departure induced micro convection in the thermal boundary layer heat transfer rate from the superheated surface to liquid pool gets increased. For the case of flow boiling where liquid is forced to move by an external source, the basic mechanisms of heat transfer are same, but it occurs at a higher heat flux compared to pool boiling. Also for flow boiling the bulk fluid velocity plays a crucial role in heat and mass transfer mechanism. Another important difference for flow boiling in the internal ducts, as reported by Robinson et al. [1], is the bubble condensation in the main bulk flow. For pool boiling, departed bubbles rise up and escape to free surface of the liquid pool. Whereas for flow boiling some of the bubbles get condensed in the bulk liquid and the rest of the bubbles, depending upon heat flux, create different two phase flow regimes like, bubbly flow, slug flow, annular flow etc. As stated earlier, the present work is aimed at developing and validating a CFD model for nucleate flow boiling which is commonly encountered in thermal management of engine jacket cooling application. Unlike pool boiling, the total wall heat transfer coefficient in flow boiling in an internal duct is a summation of single phase forced convective heat transfer coefficient and evaporative heat transfer coefficient due to phase change. In other word pool boiling is special case of flow boiling where bulk velocity is zero, i.e. single phase forced convection is absence. Increased bulk flow velocity suppresses the bubble growth and/or bubble departure from the superheated surface, as a result evaporative heat transfer coefficient gets reduced; on the other hand it increases single phase forced convective heat transfer coefficient. In the Figure 1, formation of bubbles near the wall during flow nucleate boiling is shown for different bulk velocities but for same wall superheat, working fluid (water) and operating pressure. This experimental work by Andrew O'Neill [25] explicitly shows that with increase in velocity for same other conditions the size and number of generated bubbles get decrease, i.e. suppression of boiling due to increase in bulk fluid velocity. Both these phenomena i.e. with increasing flow velocity increase of convective heat transfer and suppression of nucleate boiling are considered in present work by implementing Chen's 1-D model in 3D CFD environment.
Figure 1. Experimental images for bubble formation during nucleate boiling of water over a heated plate. For same operating pressure, wall superheat and surface fluid combination these images indicate the suppression of nucleate boiling with increase in bulk velocity [25] Although some researchers have extended Rohsenow's correlation to account for forced convection boiling [20], this correlation was originally developed for pool boiling [14]. Chen's correlation [22] was developed for forced convection boiling conditions. It introduces factors to take care of enhancement of convective heat transfer to liquid due to micro convection near the vapor bubbles and suppression of nucleation heat flux due to forced convection. More detail about this model is described in the elater section.
NUMERICAL METHIODOLOGY To model subcooled nucleate boiling, it is necessary to simulate two phase fluid flow, account for the heat transfer augmentation at the wall and model the mass transfer between the liquid and gaseous phase. The present boiling model is developed using the CFD solver ANSYS FLUENT that solves a set of governing equations for two phase multifluid flow. To model the wall boiling phenomenon modified Chen's boiling correlation is used to calculate heat transfer at the wall. A mass transfer model in built in ANSYS FLUENT is used to model the phase change process.
Governing Equations for Multiphase Flow Model The mixture multiphase model in ANSYS FLUENT[26]can model “n” phases by solving the momentum, continuity, and
THIS DOCUMENT IS PROTECTED BY U.S. AND INTERNATIONAL COPYRIGHT. It may not be reproduced, stored in a retrieval system, distributed or transmitted, in whole or in part, in any form or by any means. Downloaded from SAE International by Hemant Punekar, Thursday, April 04, 2013 05:31:52 AM
energy equations for the mixture and the volume fraction equations for the secondary phases. The generalized mass, volume fraction for secondary phase, momentum and energy governing equations have the following forms, respectively:
In Equation 5, Vdr,k is the drift velocity for secondary phase:
Mass Conservation & Volume Fraction Equation for Vapor Phase
Energy Conservation
(7)
(1) where
is the mass averaged velocity:
(8) Where, SE is any volumetric source, Ek is sensible enthalpy and keff is the effective conductivity:
(2) and ρm is the mixture density:
(9) where kt is the turbulent conductivity, defined according to the turbulence model. (3)
Here subscript “m” indicates the overall mixture phase and n is the number of phases in a system. α ρ and fraction, density and velocity vector.
are volume
Turbulence Model ANSYS FLUENT offers a range of 2-equation turbulence models. RNG k-ε model is used for this current work. The general form of k and ε equations for this model are as follows:
From continuity equation for secondary phase p, volume fraction equation for the secondary phase is obtained: (10)
(4)
Momentum Conservation
(11) In above equations, μt,m is the mixture turbulent viscosity:
(12)
(5) where p is pressure, and
is the gravitational acceleration vector
is the body force. μm is the viscosity of the mixture:
(6) Where μt,m is the mixture turbulent viscosity, discussed in the Turbulence Models section below.
For near wall regions Enhanced Wall Treatment is used along with default turbulence model constants. For more details please refer to [27] and [28]. To ensure convergence, default scaled residual convergence criteria (For mass, momentum and turbulence equations 1e-3 and for energy equation 1e-6) are used. In addition to this, mass and energy flux balances are also ensured.
Wall Boiling Model In this work, wall boiling model is used to calculate total heat transfer at the boiling wall.
THIS DOCUMENT IS PROTECTED BY U.S. AND INTERNATIONAL COPYRIGHT. It may not be reproduced, stored in a retrieval system, distributed or transmitted, in whole or in part, in any form or by any means. Downloaded from SAE International by Hemant Punekar, Thursday, April 04, 2013 05:31:52 AM
Chen's Correlation Chen [22] reviewed a large amount of other researchers' data and correlation of flow boiling heat transfer; and came up with single equation, where total heat flux is partitioned into two parts,
departure and lift-off. Some researcher [12, 13] also justified it as creation of additional surface roughness by bubbles at the wall, which increase the turbulent level and hence heat transfer. hconv,DB and F are calculated as follows:
(17) (13) In this equation ‘h’ is the heat transfer coefficient, subscripts ‘nuc’ and ‘conv’ corresponds to nucleate boiling and convection respectively. For nucleate boiling heat transfer coefficient modified Forster & Zuber's pool boiling correlation [29] was used. For convective heat transfer Dittus-Boelter turbulent heat transfer correlation was used, where to calculate Reynolds Number inlet plug velocity and hydraulic diameter of the channel was proposed. The Nucleate boiling heat transfer coefficient is written as
(18)
(19) where x represents the area averaged void fraction of the channel. With Equation 16, the single phase heat transfer component of the total wall heat transfer can be rewritten as follows:
(14)
(20)
Where Cp is the specific heat, σ is the surface tension, L is the latent heat for vaporization. Subscripts l and g corresponds toliquid and gaseous phases. Twall and Tsat relates to wall and saturation temperature. pwall and psat indicate saturation pressure corresponding to Twall and Tsat. S is the suppression factor ranging from 0 to 1, originally presented with a graph by Chen and later suggested with a best fit curve by Collier, J.G. [24] as
While solving energy equation, ANSYS FLUENT solves near wall heat transfer, from which qsingle phase can be obtained, however this does not include any enhancement for boiling. Since this internally calculated quantity is available, qsingle phase is used as follows:
(15) Equation 15 indicates the increase of S with decrease in Reynolds Number and when Re = 0, S = 1 (pool boiling situation). Please note that here Re is defined based on liquid properties, bulk velocity of the liquid and hydraulic diameter of the duct. Convective heat transfer co-efficient, hconv proposed by Chen as, (16) In this equation, hconv,DB is the convective heat transfer coefficient taken from Dittus-Boelter turbulent flow correlation and an extra factor F (always greater than 1) is introduced to encounter the effect of turbulent generation due to disrupting of the adjacent wall fluid layer during bubble
(21) It is worth noting here that unlike 1-D Dittus-Boelter correlation which is applicable only to channels of uniform cross-section (constant hydraulic diameter), in ANSYS FLUENT the convective heat transfer is calculated locally at each wall face based on the local fluid properties and turbulence quantities. Thus, the formulation proposed in Equation 21 extends the applicability of this boiling model to any arbitrary shaped domain.
Mass Transfer Model ANSYS FLUENT offers Evaporation-Condensation model to simulate phase change process between liquid and gaseous phases. This model takes care of the phase change near the wall as well as inside the domain. It is a mechanistic model described in ANSYS FLUENT Theory Guide [26, 30]. Based on the mixture temperature Tm, mass transfer can be defined as follows: If Tm > Tsat
THIS DOCUMENT IS PROTECTED BY U.S. AND INTERNATIONAL COPYRIGHT. It may not be reproduced, stored in a retrieval system, distributed or transmitted, in whole or in part, in any form or by any means. Downloaded from SAE International by Hemant Punekar, Thursday, April 04, 2013 05:31:52 AM
(22) If Tm < Tsat
(23) In Equation 22 & 23, Cevap and Ccond are the evaporation and condensation frequencies respectively. For more details, please refer to [26] and [30].
respectively. The mesh refinement direction is normal to the heated wall. All the three meshes are used for both the studies; however, the all the results are reported only for inlet velocity of 0.25m/s. For 1m/s case, results from Mesh-3 are reported. Simulations can be run in either steady state or in a transient mode; however in this validation we vary the temperature of the heating surface and evaluate the surface heat flux from the steady state simulation. The variation of coolant properties with temperature is very important input for this study which is taken form NIST and Robinson's work [1].
VALIDATION CASE The experimental data from Robinson's work [1] is used to validate the current approach for the variation of wall heat flux versus the changes of the wall temperature under different pressures, flow velocities and degree of inlet subcooling. In this work by Robinson the motivation was to develop 1-D model for engine jacket cooling, so typical antifreeze coolant mixture, 50% aqueous ethylene glycol is used. Both surface finish and surface fluid combination are important parameter for boiling, so to replicate the boiling scenario similar to engine jacket, cast from an aluminum alloy is used for the heated plate.
Figure 3. Comparison of total heat flux predicted by the present model against the experimental observations for different wall temperature, inlet velocity = 0.25 m/s, inlet temperature = 90 C, pressure = 1bar, 2 bar and 3 bar. Vertical dashed lines are indicating the saturating temperature for respective operating pressure
Figure 2. Computational domain to replicate Robinson's experimental work [1] In the Figure 2 computational domain is shown, which is created to mimic the experimental set up. The main flow channel is horizontal, 241mm long and has a rectangular cross section of 16×10mm2. The heating surface is at the bottom of the flow channel, 10×50 mm2, and located 76 mm downstream from the entrance of the channel. Two inlet velocities of 0.25 m/s and 1m/s are chosen for the validation study, in which operating pressure is varied from 1 bar to 3 bar and wall temperature is varied from 90 C to 170 C. Outlet boundary is set as pressure outlet with zero gauge pressure. All the walls are set as adiabatic expect for the heated wall that has specified temperature boundary condition. To ensure grid independence, three meshes with hexahedral cells of size 6×16×200, 8×16×200 and 10×16×200 are used, which are referred to as Mesh-1, Mesh-2 and Mesh-3
Figure 3 shows the comparison of experimental and numerical results of wall temperature verses wall heat flux at inlet plug velocity of 0.25 m/s and inlet temperature of 90 C with different operating pressuresand different wall temperatures. The most important effect of pressure on the boiling heat transfer is through its close association with the saturation temperature. When the inlet and wall boundary conditions are given, the saturation temperature determines the degrees of superheating, and hence the onset and the intensity of boiling. The saturated temperatures associated with the pressures of 1 bar, 2 bar and 3 bar are 108 C, 128 C and 142 C respectively. The vertical dash lines are indicating the same for respective temperature. It is expected that before the wall temperature reaches the saturation temperature, i.e. before onset of nucleate boiling, wall heat flux increases linearly with wall temperature, which indicates constant value of heat transfer coefficient at non-boiling zone. The curves start differing from its linear behavior in the nucleate boiling zone and higher value of wall heat flux indicates the enhancement due to nucleate boiling.
THIS DOCUMENT IS PROTECTED BY U.S. AND INTERNATIONAL COPYRIGHT. It may not be reproduced, stored in a retrieval system, distributed or transmitted, in whole or in part, in any form or by any means. Downloaded from SAE International by Hemant Punekar, Thursday, April 04, 2013 05:31:52 AM
APPLICATION: BOILING IN ENGINE CYLINDER HEAD COOLING JACKET
Figure 4. Comparison of total heat flux predicted by the model against the experimental observations for different wall temperature, inlet velocity = 1 m/s, inlet temperature = 90 C & 120 C, pressure = 3 bar. Vertical dashed line is indicating the saturating temperature for 3 bar operating pressure
A real-life simulation case is presented in Figure 5 to demonstrate the application of the present method to the analysis of flow in the engine cooling jacket, which also involves boiling. A partial geometry of single cylinder IC engine is considered, which represents the cylinder head. It consists of three fluid zones (cooling jacket, exhaust port and intake port) and one solid zone. Air-Fuel mixture comes in to the engine cylinder through intake port and high temperature combustion products leave the cylinder through exhaust port. A cooling jacket is casted/ bored in cylinder head block, through which the coolant is pumped. The outlet of this jacket is connected to radiator, where it cools down and using a coolant pump, it fed back to the inlet of the jacket.
Figure 4 represent the similar variation for higher flow velocity of 1 m/s at 3 bar operating pressure for different inlet sub-cooling. The vertical dotted line indicates the saturating temperature correspondent to 3 bar pressure. The suppression of nucleate boiling for high velocity can easily be verified by the linearity of the curve even beyond the saturation temperature. Wall function treatment for near wall boundary layer, refining the mesh not necessarily produces solution of increasing accuracy. The wall y+ value is maintained inbetween 30 to 200 to put the near wall first cell centroid in the ‘Logarithmic Layer’ [26, 27] and Enhanced Wall Treatment is used. A very good y+ independent/ mesh independent results are observed, where for a constant wall temperature maximum heat flux deviation is within 3.5% for different meshes. In the numerical results, some deviation from the experimental results is observed at 1 bar and 2 bar pressures at low wall superheat (Figure 3). Although this difference is high in terms of heat fluxes, it is within 10 K in terms of wall temperature. The accuracy in terms of range of temperature is more important in the context of engine cooling jacket analysis, because the heat flux coming from the engine is known and the aim is to solve conjugate heat transfer problem and find out the cooling jacket temperature. For such an application, this level of accuracy in temperature is considered acceptable, considering the fact that nucleate boiling is a very complex phenomenon, which depends not only on surface roughness and surface fluid combination, but also on time history of the boiling surface [1, 6, 7].
Figure 5. Computational domain for engine cooling passage conjugate heat transfer simulation. It comprises three different fluid zones: Cooling Jacket, Intake Port, Exhaust Port and solid Engine Block In this Conjugate Heat Transfer (CHT) study the cylinder and adjacent cooling jacket is not considered. However, to mimic the actual IC engine situation, a time averaged heat flux profile is specified as boundary condition to the fire deck surface of the engine block. This profile is obtained from the combustion simulation of a Direct Injection Compression Ignition engine using typical conditions, which is carried out using Diesel Unsteady Laminar Flamelet Model (DUFL)
THIS DOCUMENT IS PROTECTED BY U.S. AND INTERNATIONAL COPYRIGHT. It may not be reproduced, stored in a retrieval system, distributed or transmitted, in whole or in part, in any form or by any means. Downloaded from SAE International by Hemant Punekar, Thursday, April 04, 2013 05:31:52 AM
available in ANSYS FLUENT. In the Figure 6, contours of time averaged heat flux profile at the fire deck surface is shown.
Figure 7, 8 and 9 show the results obtained on the cooling jacket wall using the boiling model presented in this paper. Figure 10 shows the temperature contours on the cooling jacket wall with single phase flow of liquid, without considering boiling. Figure 7 shows the temperature contours on the cooling jacket wall. Temperature is high in the regions close to fire deck and exhaust port. Highest temperature is 415K, which corresponds to wall super heat of approximately 34K. This temperature is 45 K lower than that obtained with calculation without boiling, which is 460K as shown in Figure 10. Thus boiling lowers the maximum operating temperature of the cooling jacket significantly, which shows the advantage of deliberate use of boiling in the cooling jacket design. Figure 8 shows the enhancement factor due to boiling, which is defined as ratio of total heat transfer coefficient to single phase heat transfer coefficient. A ratio of heat flux with boiling to that without boiling also results into a similar contour plot. In the regions of significant boiling, this ratio is as high as six. In the regions without boiling, the enhancement factor has value of 1.
Figure 6. Engine Block and time averaged heat flux profile from Diesel Unsteady Laminar Flamelet Model (DUFL) available in ANSYS FLUENT Uniform tetrahedral mesh-elements with two inflation layers at the fluid walls are generated. As mentioned earlier, near wall first cell height is chosen such a way that it remain in the Log-Law-Region of the boundary layer i.e. 30 < y+ < 200. Total mesh count reported as 3.8 million. The operating pressure of the coolant is 1 bar, which also defines the saturation temperature, which is 381 K. For the flow of coolant in the cooling jacket and flow of fresh air/ exhaust air in the intake port/ exhaust port a typical flow and energy boundary conditions are used, as described in Table 1. Table 1. Flow and energy boundary conditions for the cylinder head boiling calculation
Figure 7. Temperature distribution of Cooling Jacket wall obtained from nucleate boiling simulation
THIS DOCUMENT IS PROTECTED BY U.S. AND INTERNATIONAL COPYRIGHT. It may not be reproduced, stored in a retrieval system, distributed or transmitted, in whole or in part, in any form or by any means. Downloaded from SAE International by Hemant Punekar, Thursday, April 04, 2013 05:31:52 AM
Figure 10. Temperature distribution from single phase conjugate heat transfer analysis using same boundary condition and heat flux profile Figure 9 shows the vapor volume fraction in the domain. Maximum volume fraction reached for this case is 0.1, which means the boiling regime is subcooled nucleate boiling. Again, regions of highest volume fraction are close to fire deck and exhaust port.
Figure 8. Heat Transfer Enhancement Factor due to nucleate boiling
Figure 9. Volume fraction of vapor generated due to nucleate boiling
In Figure 9, high vapor volume fraction on the right upper corner of the contour plot can be observed. This is a ridge like portion of the cooling passage. Compering the same region with the upper contour plot in Figure 8, it can be concluded that not all the region with high vapor volume fraction is undergoing boiling. Value of enhancement factor suggests that only the lower part of the ridge has significant boiling. Since gravity is in negative z direction, vapor produced at this lower part of the ridge moves upward due to buoyancy and hence we see high vapor volume fraction in the upper part of this ridge. Thus stratification of vapor can be observed. In this case, vapor volume fraction is not very high. However, if vapor volume fraction approaches unity, we can conclude that a corresponding portion of the wall is covered with vapor, which reduces the local heat transfer rate significantly. In other words this also means that the total area available for heat transfer is reduced, which may result in increase of operating temperature of the system. Two phase flow simulation along with wall boiling can help gain such insight of the flow.
THIS DOCUMENT IS PROTECTED BY U.S. AND INTERNATIONAL COPYRIGHT. It may not be reproduced, stored in a retrieval system, distributed or transmitted, in whole or in part, in any form or by any means. Downloaded from SAE International by Hemant Punekar, Thursday, April 04, 2013 05:31:52 AM
Figure 11 shows heat flux is compared for the cases with and without boiling. When corresponding wall areas are compared, higher heat fluxes are observed with boiling. Figure 12 shows the fluid temperature in the cells in the vicinity of the coolant passage wall. When compared with the single phase calculation, it shows higher temperature with boiling in certain areas (A1), while lower temperature in the other (A2). Boiling results in higher heat fluxes near the wall and the generated vapor mixes with the flow and condenses. This is an additional mechanism of heat transfer which considerably changes the temperature map of the cooling jacket and cylinder head. This temperature map is the starting point for the thermal stress analysis of cooling jacket.
Figure 12. Temperature of fluid in cell next to the wall (a) with boiling model (b) without boiling model (single phase conjugate heat transfer)
CONCLUSIONS In the present work, aCFD model is developed to simulate subcooled nucleate flow boiling phenomenon that may occur in engine cooling jackets.
Figure 11. Total surface heat flux from Cooling Jacket wall (a) with boiling model (b) without boiling model (single phase conjugate heat transfer)
For validation, the model is used to predict the flow boiling of aqueous ethylene glycol over a flat sand casted rough plate, the conditions typically encountered in cooling jacket passages. The simulation results show good comparison with the experimental data, especially in terms of accuracy of the wall temperature, which an important parameter for engine cooling jacket analysis. It is also shown that this model can be easily applied to a real life cooling jacket geometry. In the example of cylinder head cooling jacket, vapor volume fraction was predicted up to 10% and at certain locations; heat transfer enhancement up to six times was obtained as compared to the single phase heat transfer. Important features of boiling like increase in heat transfer rate, reduction in operating temperature, vapor generation and stratification are captured, which provide insight into the complex flow patterns of engine cooling
THIS DOCUMENT IS PROTECTED BY U.S. AND INTERNATIONAL COPYRIGHT. It may not be reproduced, stored in a retrieval system, distributed or transmitted, in whole or in part, in any form or by any means. Downloaded from SAE International by Hemant Punekar, Thursday, April 04, 2013 05:31:52 AM
jacket. Temperature map of the cooling jacket is also obtained which is an important input for thermal stress analysis. Thus the present boiling model can be very useful for cooling jacket design and optimization.
REFERENCES 1. Robinson, K., Hawley, J.G. and N.A.F., “Experimental and Modeling Aspects of Flow Boiling Heat Transfer for Application to Internal Combustion Engines,” Proc. Instn Mech. Engrs Vol. 217 Part D: Automobile Engineering, 2004. 2. Dhir, V.K., Abarjith, H.S. and Warrier, G.R., “From Nano to Micro to Macro Scales in Boiling,” In: Microscale heat transfer: fundamentals and application, Kakaç, S. (Ed.), 197-216, Springer, 2005. 3. Dhir, V.K., “Boiling Heat Transfer,” Annual Reviews of Fluid Mechanics 30, 365-401, 1998. 4. Son, G. and Dhir, V.K., “Numerical Simulation of Film Boiling Near Critical Pressures with a Level Set Method,” J. Heat Transfer 120, 183-192, 1998. 5. Dhir, V.K., “Mechanistic Prediction of Nucleate Boiling Heat Transfer- Achievable or a Hopeless Task?”, J. of Heat Transfer, Vol. 128, 1-12, 2006. 6. Kolev, N.I., “How Accurately can we Predict Nucleate Boiling?,” Experimental Thermal and Fluid Science, Vol 10, 370-378, 1995. 7. Kandlikar, S.G., Bulut, M., “An Experimental Investigation on Flow Boiling of Ethylene - glycol/ Water Mixture,” J. Heat Transfer, Vol. 125, 317 - 325, 2003
14. Rohsenow, W.M., “A Method of Correlating Heat Transfer Data for Surface Boiling of Liquid,” Trans. ASME, 74, 969, 1952. 15. Kroes, J.P., Geld, C. W. M. van der, Velthooven, E. van, “Modeling of Nucleate Boiling in Engine Cylinder Head Cooling Ducts,” HEAT 2008, Fifth International Conference on Transport Phenomena In Multiphase Systems, Bialystok, Poland, June 30 - July 3, 2008. 16. Lee, H., “Heat Transfer Predictions using the Chen Correlation on Subcooled Flow Boiling in a Standard IC Engine,” SAE Technical Paper 2009-01-1530, 2009, doi: 10.4271/2009-01-1530. 17. Kurul, N., and Podowski, M.Z., “On the Modeling of Multidimensional Effects in Boiling Channels”, Proceedings of the 27th National Heat Transfer Conference, Minneapolis, Minnesota, USA, July 1991. 18. Li, H., Vasquez, S.A, Punekar, H. and Muralikrishnan, R., “Prediction of Boiling and Critical Heat Flux using an Eulerian Multiphase Boiling Model,” Proceedings of the ASME 2011 International Mechanical Engineering Congress & Exposition IMECE2011, Paper No. IMECE2011-65539, November 11-17, 2011. 19. Tu, J.Y. and Yeoh, G.H., “On Numerical Modelling of Low-pressure Subcooled Boiling Flows,” International Journal of Heat and Mass Transfer 45, 1197-1209, 2002. 20. Bo, T., “CFD Homogeneous Mixing Flow Modelling to Simulate Subcooled Nucleate Boiling Flow,” SAE Technical Paper 2004-01-1512, 2004, doi:10.4271/2004- 01-1512.
8. Kandlikar, S.G., “Boiling Heat Transfer with Binary Mixtures: Part II - Flow Boiling in Plain Tubes,” ASME Transactions, Vol. 120, 388 - 394, 1998.
21. Srinivasan, V., “Numerical Simulation of Flow Boiling of Binary Mixtures using Multi-fluid Modeling Approach”, Proceedings of IMECE 2011, ASME International Mechanical Engineering Congress and Exposition November 11-16, 2011.
9. Adams, Mc. W.H., Kennel, W.E., Minden, C.S., Carl, R., Picornell, P.M. and Dew, J.E., “Heat Transfer at High Rates to Water with Surface Boiling,” Industrial and Engineering Chemistry, 41, 1945-1953, 1949.
22. Chen, J.C., “Correlation for Boiling Heat Transfer to Saturated Fluids in Convective Flow,” Ind. & Eng. Chem. Process Design and Development, Vol. 5 no 3, 322-329, 1966.
10. Shah, M.M., “A General Correlation for Heat Transfer during Subcooled Boiling in Pipes and Annuli”, ASHRAE Transactions, 83, Part I, 205-217, 1977.
23. Dong, F., Fan, Q., Cai, Y., Jiang, S. et al., “Numerical Simulation of Boiling Heat Transfer in Water Jacket of DI Engine,” SAE Technical Paper 2010-01-0262, 2010, doi: 10.4271/2010-01-0262.
11. Steiner, H., Kobor, A. and Gebhard, L.A., “A Wall Heat Transfer Model for Subcooled Boiling Flow,” Int. J. of Heat and Mass Transfer, Vol. 48, 4161-4173, 2005. 12. Basu, N., Warrier, G.R., Dhir, V.K., “Wall Heat Flux Partitioning during Subcooled Flow Boiling at Low Pressures,” Proceedings of HT, ASME Summer Heat Transfer Conference, July 21-23, 2003, Las Vegas, USA. 13. Basu, N., Warrier, G.R. and Dhir, V.K., “Wall Heat Flux Partitioning during Subcooled Flow Boiling: Part 1 - Model Development,” Journal of Heat Transfer, Vol.127, 131-140, 2005.
24. Collier, J.G. and Thome, J.R, “Convective Boiling and Condensation”, third edition, Clarendon Press, Oxford, 1996. 25. O'Neill, Andrew T., “Experimental Determination of Convection Boiling Curves for Water and Ethylene Glycol in a Rectangular Channel with Localized Heating”, M.S. Thesis, Department of Mechanical and Aeronautical Engineering Western Michigan University Kalamazoo, Michigan, April 2005. 26. Chapter 17: Multiphase Flows, Theory Guide, ANSYS FLUENT 14.0 Documentation, 2011.
THIS DOCUMENT IS PROTECTED BY U.S. AND INTERNATIONAL COPYRIGHT. It may not be reproduced, stored in a retrieval system, distributed or transmitted, in whole or in part, in any form or by any means. Downloaded from SAE International by Hemant Punekar, Thursday, April 04, 2013 05:31:52 AM
27. Orszag, S.A., Yakhot, V., Flannery, W. S., Boysan, F., Choudhury, D., Maruzewski, J. and Patel, B., “Renormalization Group Modeling and Turbulence Simulations,” In International Conference on Near-Wall Turbulent Flows, Tempe, Arizona, 1993. 28. Chapter 4: Turbulence, Theory Guide, ANSYS FLUENT 14.0 Documentation, 2011. 29. Forster, H.K., Zuber, N., “Dynamics of Vapor Bubbles and Boiling Heat Transfer”, A.I.Ch.E. J. 1, 1531-535, 1955. 30. Lee, W. H., “A Pressure Iteration Scheme for Two-Phase Modeling,” Technical Report LA-UR 79-975, Los Alamos Scientific Laboratory, Los Alamos, New Mexico. 1979.
CONTACT INFORMATION Authors can be contacted at following email addresses. Hemant Punekar
[email protected] Saurish Das
[email protected]
ACKNOWLEDGMENTS Authors would like to thank Mr. Sourabh Shrivastava & Mr. Padmesh Mandloi ANSYS Inc. for providing simulation results from the direct injection diesel engine study. Thanks are also extended to Dr. Laz Foley & Mr. Pranav Ladkat of ANSYS Inc. for their valuable inputs.
The Engineering Meetings Board has approved this paper for publication. It has successfully completed SAE's peer review process under the supervision of the session organizer. This process requires a minimum of three (3) reviews by industry experts. All rights reserved. No part of this publication may be reproduced, stored in a retrieval system, or transmitted, in any form or by any means, electronic, mechanical, photocopying, recording, or otherwise, without the prior written permission of SAE. ISSN 0148-7191
Positions and opinions advanced in this paper are those of the author(s) and not necessarily those of SAE. The author is solely responsible for the content of the paper. SAE Customer Service: Tel: 877-606-7323 (inside USA and Canada) Tel: 724-776-4970 (outside USA) Fax: 724-776-0790 Email:
[email protected] SAE Web Address: http://www.sae.org Printed in USA