materials Article
Microscale Simulation on Mechanical Properties of Al/PTFE Composite Based on Real Microstructures Chao Ge, Yongxiang Dong * and Wubuliaisan Maimaitituersun State Key Laboratory of Explosion Science and Technology, Beijing Institute of Technology, Beijing 100081, China;
[email protected] (C.G.);
[email protected] (W.M.) * Correspondence:
[email protected]; Tel.: +86-10-6891-5532 Academic Editor: Thomas Fiedler Received: 27 May 2016; Accepted: 12 July 2016; Published: 19 July 2016
Abstract: A novel numerical method at the microscale for studying the mechanical behavior of an aluminum-particle-reinforced polytetrafluoroethylene (Al/PTFE) composite is proposed and validated experimentally in this paper. Two types of 2D representative volume elements (RVEs), real microstructure-based and simulated microstructures, are established by following a series of image processing procedures and on a statistical basis considering the geometry and the distribution of particles and microvoids, respectively. Moreover, 3D finite element modelling based on the same statistical information as the 2D simulated microstructure models is conducted to show the efficiency and effectiveness of the 2D models. The results of all simulations and experiments indicate that real microstructure-based models and simulated microstructure models are efficient methods to predict elastic and plastic constants of particle-reinforced composites. Keywords: polymer composites; Al/PTFE; finite-element simulation; microscale modelling; quasi-static compression
1. Introduction Impact-initiated composite material, characterized by its exothermic and rapid energy releasing property upon impact with targets or when impacted, has been of concern in recent years. It can be categorized in a much larger category—i.e., reactive materials (RMs), which denotes the class of materials generally combining two or more non-explosive solids that, upon their ignition, react to release chemical energy in addition to the kinetic energy resulting when the high-speed projectiles containing the reactive materials collide with the target [1]. Impact-initiated composites are typically formed by means of pressing/sintering uniformly mixed active metal powders into a polymer matrix, which will introduce sufficient strength and insensitivity; thus, they have a number of potential ordnance applications. Among the many formulas of impact-initiated composites, aluminum (Al)-particle-filled polytetrafluoroethylene (PTFE) is typical, which has become a benchmark for investigation into properties of impact-initiated composites. Based on the basic formulas of Al/PTFE, over the past decades, much progress has been achieved, especially in formulations and fabrications, mechanical properties of both statics and dynamics, flow and failure, impact initiation mechanisms and properties, and reaction and energy release properties [2–11]. All conducted research improves the explanation of Al/PTFE while promoting its application and improvement. However, all research has been conducted macroscopically; microstructural properties and the effects of a microstructure on its macro properties and performance are still less known. From the perspective of fabrication and application of Al/PTFE, different particle geometries, volume fractions and distributions may result in different composite properties, and the pressing/sintering process may introduce microvoids and microcracks, which will affect the initiation properties and strength of the Materials 2016, 9, 590; doi:10.3390/ma9070590
www.mdpi.com/journal/materials
Materials 2016, 9, 590
2 of 16
composite. Moreover, the demand in the application of Al/PTFE is proposed with a higher density, better strength, sufficient insensitivity and complete reaction. All of these properties depend on the microstructural characteristics of Al/PTFE and cannot be neglected. With the development of algorithms and modelling techniques, finite element analysis (FEA) is increasingly adopted in mechanics of materials both macroscopically and microscopically. Especially with the combination of trans-scale mechanics and FEA technology, the mechanical properties of materials are being understood at increasingly smaller scales [12,13]. In this context, micromechanical analyses have been on an increasing trend to understand the behavior of modern materials with sophisticated microstructures—e.g., fiber- or particle-reinforced composites and textile composites. Resorting to the concept of unit cells and representative volume elements (RVE), many studies have been conducted on particle-reinforced polymer/metal matrix composites [14,15]. Li [16] established unit cells and boundary conditions for a range of typical packing systems (simple cubic packing, body-centered cubic packing, face-centered cubic packing, and close-packed hexagonal packing) and examined them in a systematic manner with translational symmetry transformations, which was then widely referenced in investigation into many types of particle-reinforced composites. Huang and Bush [17] modeled the indentation process of aluminum–aluminum composites by a cylindrical unit cell and a hexagonal arrangement to investigate the elastoplastic behavior, and the results demonstrated the influence of grain size on the mechanical properties of the composites. Based on the concept of RVE, Sun [18] determined the appropriate boundary conditions on the RVE for various loading conditions by using symmetry and periodicity conditions; elastic constants predicted by finite element analysis showed good agreement with existing theoretical predictions and available experimental data. Song [19] established a multi-particle unit cell model to investigate the mechanical characteristics and the fracture behavior of 91W-6.3Ni-2.7Fe tungsten alloys, with the results of modelling showing good agreement with that of an in situ tensile test. However, both unit cell and RVE models are highly idealized models for heterogeneous materials because all materials are regarded as regular particle arrangements or even particles of the same geometries. The unit cell approach assumes that the composite is constructed of an array of basic units, each with identical composition, geometry, inclusion shape and material properties [20]. As a matter of fact, microstructures of multiphase materials mostly have strong stochastic characteristics. Microstructural parameters, such as geometry, distribution, volume fraction, and sizes and orientations of reinforcement particles, are all random to a certain degree and affect the mechanical properties of composites. In some cases, microvoids and microcracks introduced during fabrication may become key factors in material failure, fracture and even initiation and reaction of reactive materials. To overcome the drawbacks of unit cell models and RVE (especially highly idealized) models, simulated microstructures of particle-reinforced composites based on certain statistical information from the original structure are developed, with which randomness of particle distribution, particle gradation and shapes can be accounted. Simulated microstructures are RVEs as well, but they are more practical RVEs. Wang [21] determined the elastic properties of multiphase composites by proposing a random-generation growth (RGG) method coupled with a lattice Boltzmann method to reproduce the random microstructure. Guo [22] studied the mechanical response of incompressible particle-reinforced neo-Hookean (IPRNC) composites by creating three-dimensional simulated RVE models assuming the randomly distributed particles to be spheres, and mechanical response of IPRNC was well predicted. Leite [23] proposed a numerical algorithm that allows the control of the aggregate volume fraction, shape and degradation to generate 2D and 3D models of the heterogeneous internal structure of cementitious composites and simulated the fracture process. Some other researchers studied particle-reinforced composites by a random generation method assuming particles as spheres, ellipsoids or regular polyhedrons, considering particle distribution, degradation and shape effects, and this method was proved to be robust under certain circumstances, though not sufficiently [24–29]. Given the significant influences of the geometric details on the material properties, methods aimed at approaching the real structures must be proposed. Given that the microscopy instruments
Materials 2016, 9, 590 Materials 2016, 9, 590
3 of 16 3 of 16
and observation observationtechnologies technologies developed, mapping has abecome a highly and areare nownow well well developed, imageimage mapping has become highly powerful powerful tool for this purpose [30]. Two-dimensional finite element models of real are tool for this purpose [30]. Two-dimensional finite element models of real structures arestructures usually built usually built based on X-ray CT (Computed Tomography), optical microscopy and scanning based on X-ray CT (Computed Tomography), optical microscopy and scanning electron microscopy electron microscopy images processed techniques. by digitalThree-dimensional image processing techniques. (SEM) images processed (SEM) by digital image processing element models Three-dimensional of real structures usually reconstructed by method, a serial sectioning of real structures areelement usuallymodels reconstructed by a serialare sectioning process. By this inherent process.morphology By this method, inherent particle morphology and microstructural characteristics of particle and microstructural characteristics of composites are considered, and accurate compositesresults are considered, accurate simulation results are yielded. point,as real simulation are yielded. and To this point, real microstructure-based RVEs canTo be this regarded the microstructure-based most practical RVEs. RVEs can be regarded as the most practical RVEs. In this this paper, paper, we we present present aacomprehensive comprehensive study study of of two-dimensional two-dimensional real real microstructure-based microstructure-based In finite element element modelling modelling of of the the deformation deformation behavior behavior of of aluminum aluminum (Al)-particle-filled (Al)-particle-filled finite polytetrafluoroethylene (PTFE); such studies are considerably limited at a microscopic level. In polytetrafluoroethylene such studies are considerably limited at a microscopic level. addition toto this, FEFEmodels microvoids In addition this, modelsfrom fromstatistics-based statistics-basedsimulated simulatedmicrostructures microstructures considering microvoids are established established to to draw draw comparisons. comparisons. All All simulated simulated results resultsare arecompared comparedwith withexperimental experimentalresults. results. are 2. Static Material Material Experiments Experiments 2. Static The The samples samples studied studied in this this paper paper are a pressed pressed and sintered mixture of Al and PTFE powders, 26.5% The samples samples were fabricated by the authors themselves, 26.5% and and 73.5% 73.5% by weight, respectively. The themselves, based based on on Joshi’s Joshi’s [2] [2] patent, patent, and and is is outlined outlined below. below. First, (Hunan Goldsky Aluminum Industry High-Tech Co., Ltd., China, First, powder powderofofAlAl (Hunan Goldsky Aluminum Industry High-Tech Co.,Changsha, Ltd., Changsha, JT-4) and PTFE (DuPont PTFE 9002-84-0, type MP 1000) in proportions of 26.5% to 73.5% by China, JT-4) and PTFE (DuPont PTFE 9002-84-0, type was MP mixed 1000) was mixed in proportions of 26.5% weight, via a dry mixing Afterprocess. the mixture made, the material pressed to 73.5%respectively, by weight, respectively, via aprocess. dry mixing Afterwas the mixture was made,was the material in a die to make 60 mm insample diameter in height. to was pressed in aa flat diecylindrical to make asample flat cylindrical 60and mm15inmm diameter andPressure 15 mm applied in height. the mixture in the to diethe was in the range 70was MPaintothe 80 range MPa with dwelltotime of approximately min. Pressure applied mixture in theof die of 70a MPa 80 MPa with a dwell 10 time of The pressed mixture thenThe underwent cycle underwent to prevent any oxidationcycle or surface reactionany of approximately 10 min. presseda sintering mixture then a sintering to prevent the material, which was performed under anwhich argon was atmosphere. The sample was heated at a rateThe of oxidation or surface reaction of the material, performed under an argon atmosphere. ˝ C, held at this final approximately 50 degrees to a final temperature of approximately sample was heated at a per ratehour of approximately 50 degrees per hour to 380 a final temperature of temperature for380 4 h,°C, andheld thenatcooled to room temperature slow and then temperature fast process. approximately this final temperature for 4via h, an andinitially then cooled to room Figure showsslow a picture of prepared Al/PTFE samples with dimensions Φ 12.00 Al/PTFE mm ˆ 10.00 mm, via an 1a initially and then fast process. Figure 1a shows a picture of of prepared samples turned from the original flat mm cylindrical with dimensions of Φ 12.00 × 10.00 sample. mm, turned from the original flat cylindrical sample.
(a)
(b)
Figure 1. 1. (a) (a) Prepared Prepared Al/PTFE Al/PTFE (polytetrafluoroethylene) samples and and (b) (b) true true stress–strain stress–strain curves curves of of Figure (polytetrafluoroethylene) samples samples under quasi-static compression. samples under quasi-static compression.
To validate the FE models and algorithm, quasi-static compression tests with the employment To validate the FE models and algorithm, quasi-static compression tests with the employment of an Instron, Inc. (Norwood, MA, USA), model 5985 servo-hydraulic load frame, were performed in of an Instron, Inc. (Norwood, MA, USA), model 5985 servo-hydraulic load frame, were performed a standard laboratory environment (23 ± 2 °C, 30%–40% relative humidity). The load applied to in a standard laboratory environment (23 ˘ 2 ˝ C, 30%–40% relative humidity). The load applied to specimens was measured with a load cell mounted to the crosshead. The tests were carried out specimens was measured with a load cell mounted to the crosshead. The tests were carried out under under displacement control with a constant crosshead speed of 0.6 mm/min, which corresponds to a displacement control with a−3 constant crosshead speed of 0.6 mm/min, which corresponds to a nominal nominal strain rate of 10 ·s−1. Contact surfaces of specimens were lubricated before the test. For strain rate of 10´3 ¨ s´1 . Contact surfaces of specimens were lubricated before the test. For reliable reliable results, three samples were tested. The true stress–strain curves of three tested specimens results, three samples were tested. The true stress–strain curves of three tested specimens under under quasi-static compression are shown in Figure 1b. The stress–strain curves of the Al/PTFE samples showed good repeatability. Linear elastic, linear-strain hardening and strain softening
Materials 2016, 9, 590
4 of 16
quasi-static compression are shown in Figure 1b. The stress–strain curves of the Al/PTFE samples showed good repeatability. Linear elastic, linear-strain hardening and strain softening stages can be Materials Materials 2016,2016, 2016, 9, 5909, 9,that 590 it is a typical hard and tough composite. From the curves, elastic–plastic 4 of 16 of16 16 Materials 590 444of Materials 2016, 9, 590 of 16 observed, indicating constants, including elastic modulus, yield strength, yield strain and plastic hardening modulus can stages be indicating tough composite. From the stages canobserved, be observed, observed, indicating that is aa typical typical hard and tough composite. From the curves, curves, stages can can be indicating thatthat it is itit a is typical hardhard and and tough composite. From the curves, be calculated to characterize the elastic–plastic behavior of this material. elastic–plastic constants, including elastic modulus, strength, strain plastic elastic–plastic constants, including elastic modulus, yield strength, yield strain and plastic elastic–plastic constants, including elastic modulus, yieldyield strength, yieldyield strain and and plastic hardening modulus can be calculated to characterize the elastic–plastic behavior of this material. hardening modulus can be calculated to characterize the elastic–plastic behavior of this material. hardening modulus can be calculated to characterize the elastic–plastic behavior of this material. 3. Real Microstructures and Simulated Microstructures
3. Microstructures and Simulated Microstructures 3. Real Real Microstructures and Simulated Microstructures 3. Real Microstructures Simulated Microstructures Microscopic images ofand Al/PTFE were obtained by a HITACHI S-4800 scanning electron microscope (Tokyo, Japan). images of different magnifications were chosen (Table Microscopic images of obtained aa HITACHI S-4800 scanning electron Microscopic images of Al/PTFE Al/PTFE were obtained byHITACHI HITACHI S-4800 scanning electron1). Microscopic images of Five Al/PTFE werewere obtained by aby S-4800 scanning electron The dimensions of (Tokyo, the fiveJapan). microstructures are 316 magnifications µmmagnifications ˆ 221 µm (1); 316 µm ˆ 221 µmThe (2); microscope images of were chosen (Table 1). microscope (Tokyo, Japan). Five images of different different magnifications were chosen (Table 1). The microscope (Tokyo, Japan). FiveFive images of different were chosen (Table 1). The of the microstructures are 316 ××µm 221 μm (1); ×× 221 (2); dimensions of five the five microstructures areµm 316ˆμm 221(5). μmFrom (1); 316 316 221 μm μm (2); 140 140 μm 98 dimensions microstructures are 84 316 μm ×μm 221 μm (1); 316 μm ×μm 221 μm (2); 140 μm ×μm 98×× 98 140 µm ˆdimensions 98 µm of (3);the 97 µmfive ˆ 68 µm (4); and 59 theμm images, aluminum particles μm (3); 97 68 μm (4); 84 ××μm 59 (5). the images, aluminum particles (white), μm 97 (3); 97 μm 68 μm and (4); and and 84 μm 59 μm (5). From From themicrovoids images, aluminum particles (white), μmmatrix (3); μm ×μm 68××μm (4); 84(black) μm ×μm 59 (5). From theThe images, aluminum particles (white), (white), (grey) and microvoids can beμm observed. were introduced during matrix (grey) and microvoids (black) can be observed. The microvoids were introduced during matrix (grey) and microvoids (black) can be observed. The microvoids were introduced during the matrix (grey) and microvoids (black) can be observed. The microvoids were introduced during the the the pressing/sintering process. Microvoids of diameters in a certain range were distributed randomly, pressing/sintering process. Microvoids of aa certain range distributed randomly, pressing/sintering process. Microvoids of diameters diameters in certain range were distributed randomly, pressing/sintering process. Microvoids of diameters in a in certain range werewere distributed randomly, which would have a great effect on the composite properties and cannot be neglected. which would aa great effect on the properties cannot be which would have great effect oncomposite the composite composite properties and cannot be neglected. neglected. which would havehave a great effect on the properties and and cannot be neglected.
Table 1. Table Microstructures of Al/PTFE (polytetrafluoroethylene) including real microstructures 1. of (polytetrafluoroethylene) including microstructures 1. Microstructures Microstructures of Al/PTFE Al/PTFE (polytetrafluoroethylene) including real microstructures TableTable 1. Microstructures of Al/PTFE (polytetrafluoroethylene) including real real microstructures obtained by SEM, microstructure-based models afterafter image processing simulated obtained by SEM, real microstructure-based models image processing and simulated obtained obtained by SEM, byreal SEM, real real microstructure-based microstructure-based models models after after image image processing processing andand and simulated simulated microstructures. Al particles and microvoids are bywhite white hollow geometries and black microstructures. microstructures. Al particles Alparticles particles and microvoids andmicrovoids microvoids arerepresented represented arerepresented represented by bywhite white hollow hollow geometries geometries and and black andblack black microstructures. Al and are by hollow geometries solid geometries, respectively. geometries, respectively. solidsolid geometries, respectively. solid geometries, respectively. Obtained Real Real Microstructures RealMicrostructures Microstructures Obtained Obtained by by by
OrderMicrostructures Obtained by SEM Order OrderOrderOrder Real SEM SEM SEMSEM
1
1
111
2
2
222
3
3
333
4
4
444
Real Microstructures RealReal Microstructures RealMicrostructures Microstructures Real Microstructures
Simulated Microstructures Simulated Simulated Microstructures Microstructures Simulated Microstructures Simulated Microstructures
Materials 2016, 9, 590
5 of 16
Table 1. Cont.
Materials 2016, 9, 590
5 of 16
Materials Materials 2016, 2016, 9, 2016, 5909, 9,590 590 Materials
Order
5
5
5 of 16 of16 16 55of
Real Microstructures Obtained by SEM
5
Real Microstructures
Simulated Microstructures
55
3.1. Real 3.1. Real Microstructure-Based Real Microstructure-Based Microstructure-Based Models Models 3.1. Models 3.1. 3.1. Real Real Microstructure-Based Microstructure-Based Models Models The The SEM The SEM images images then then must must be processed be processed processed via an an viaimage image an image image processing processing method, method, of which ofwhich which the main the main main SEM images then must be via an processing method, of which the The SEM images then must be processed via processing method, of the main The SEM images then must be processed via an image processing method, of which the main aim aim aim is aim tois isextract to extract extract the edges the edges edges of the of particles the particles particles and and microvoids and microvoids microvoids [31,32]. [31,32]. The The process The process process was was was realized realized by aby by aa to the of the [31,32]. realized aim is to extract the edges of the particles and microvoids [31,32]. The process was realized by a is to extract the edges of the particles and microvoids [31,32]. The process was realized by a MATLAB MATLAB MATLAB program program (V7.13, (V7.13, Mathworks, Mathworks, Natick, Natick, MA,MA, MA, USA) USA) developed developed by the byauthor. the author. author. First,First, First, piecewise piecewise MATLAB program (V7.13, Mathworks, Natick, USA) developed by the piecewise MATLAB program (V7.13,was Mathworks, Natick, MA, USA) developed bycontrast thecontrast author. First, piecewise program (V7.13, Mathworks, Natick, MA, developed byenhance thethe author. First, piecewise linear linear linear transformation transformation was applied applied to the toUSA) SEM the SEM SEM images images to enhance to enhance the contrast among among particles, particles, linear transformation was applied to the images to the among particles, linear transformation was applied to the SEM images to enhance the contrast among particles, transformation was to the images to enhance theand contrast among microvoids microvoids microvoids and applied matrix. and matrix. matrix. For clear ForSEM clear edges, edges, noisenoise noise reduction reduction and median and median filtering filtering forparticles, the forimages the images images werewere were microvoids and For clear edges, reduction median filtering for the microvoids and matrix. For clear edges, noise reduction and median forbetween the images were thenthen then conducted, conducted, after after which which some some local local noise noise was was was eliminated, eliminated, and and thefiltering edges the edges edges between between particles, particles, after which some local eliminated, and the particles, and matrix. Forconducted, clear edges, noise reduction andnoise median filtering for the images were then conducted, then conducted, after which some local noise was eliminated, the edges between particles, microvoids microvoids and matrix matrix were were smoother smoother and clearer. and clearer. Next, Next, the canny theand canny operator operator was was employed, employed, and and microvoids and matrix were smoother and clearer. Next, the canny operator was employed, and after which someand local noise was eliminated, and the edges between particles, microvoids and matrix clear clear edges edges connected connected by single by single pixels pixels were were obtained, obtained, as shown as shown in the in middle the middle column column of Table of Table 1. Al 1. Al clear edges connected by single pixels were obtained, as shown in the middle column of Table 1. Al microvoids and matrix were smoother and clearer. Next, the canny operator was employed, were smoother and clearer. Next, the canny operator was employed, and clear edges connectedand by particles particles and and microvoids and microvoids microvoids are pixels represented are represented represented by white by white white hollow hollow geometries geometries and black and black black solidsolid solid geometries, geometries, particles are by hollow geometries and geometries, clear edges connected by single were obtained, as shown in the middle column of Table 1. Al single pixels were obtained, as shown in the middle column of Table 1. Al particles and microvoids are respectively. respectively. Finally, Finally, the represented the images images of edges of edges edges werewere were vectorized, vectorized, converted converted into DXF DXF (Drawing (Drawing respectively. Finally, the images of vectorized, converted into DXF (Drawing particles and are by white hollow geometries and into black solid geometries, represented bymicrovoids white hollow geometries and black solid geometries, respectively. Finally, the images Interchange Interchange Format) Format) format format and and and imported imported into into into the the finite the finite finite element element analysis analysis software software program program Interchange Format) format imported element analysis software program respectively. Finally, the converted images of edges were vectorized, converted into DXF (Drawing of edges were vectorized, into DXF (Drawing Interchange Format) format and imported ABAQUS ABAQUS (V6.11, (V6.11, Providence, Providence, RI, USA). RI, USA). USA). The The five The five real five real microstructure-based real microstructure-based microstructure-based models models werewere were marked marked as as as ABAQUS (V6.11, Providence, RI, models marked Interchange Format) format and imported into ABAQUS the finite (V6.11, element analysis software program into the element analysis software program 1-R,finite 2-R, 1-R, 2-R, 3-R, 2-R, 4-R 3-R,and 4-R 5-R, and 5-R, respectively, 5-R, respectively, with with R indicating indicating “real.” “real.” Providence, RI, USA). The five 1-R, 3-R, 4-R and respectively, with RR indicating “real.” ABAQUS (V6.11, Providence, RI, USA). five as real1-R, microstructure-based models were marked real microstructure-based models were The marked 2-R, 3-R, 4-R and 5-R, respectively, withas R 1-R, 2-R, 3-R, 4-R and 5-R, respectively, with R indicating “real.” 3.2. Simulated 3.2. Simulated Microstructure Microstructure Characterization Characterization and Reproduction and Reproduction Reproduction Algorithm Algorithm 3.2. Simulated Microstructure Characterization and Algorithm indicating “real.” Simulated Simulated microstructures microstructures of Al/PTFE of Al/PTFE Al/PTFE werewere were set up setbased up based based on the onstatistics the statistics statistics of particles of particles particles and and voids and voids voids Simulated microstructures of set up on the of
3.2. Simulated Microstructure Characterization and Reproduction Simulated Microstructure Algorithm and and fulfilled and fulfilled fulfilled by another by another another MATLAB MATLAB program. program. The The particle The particle particle size size distribution size distribution of Alof of isAl Al depicted is depicted depicted in Figure in Figure Figure by MATLAB program. distribution is in
2, which 2, which which was was supplied supplied by the by the manufacturer, Hunan Hunan Goldsky Goldsky Aluminum Aluminum Industry Industry High-Tech High-Tech Co.,voids Co., 2, was supplied by the manufacturer, Hunan Goldsky Aluminum Industry High-Tech Co., Simulated microstructures ofmanufacturer, Al/PTFE were set up based on statistics of and Al/PTFE were set up based on the the statistics of particles particles and Ltd., Ltd., Changsha, Changsha, China. China. Ltd., Changsha, China. and fulfilled by another another MATLAB MATLABprogram. program.The Theparticle particlesize sizedistribution distributionofofAlAlisisdepicted depictedininFigure Figure 2, 2, which was supplied by the manufacturer, Hunan Goldsky Aluminum Industry High-Tech Co., which was supplied by the Hunan Goldsky Aluminum Industry High-Tech Co., Ltd., 10 manufacturer, 10 10 Ltd., Changsha, China. Changsha, China. 100 100 100 VolumeVolume Frequency VolumeFrequency Frequency
2
60
2
60 60
80
44
40
40 40
60
22
20
4 0
80 80
100
00 0 3.81 3.81 3.81 1.45 1.45 1.45 2.00 2.00 2.00 2.76 2.76 2.76 26.17 26.17 26.17 7.24 7.24 7.24 9.98 9.98 9.98 13.77 5.25 5.25 5.25 18.98 18.98 18.98 13.77 13.77
Diameters/(m) Diameters/(m) Diameters/(m)
Cumulation/(%) Cumulation/(%)
4
80 Volume Frequency 66Cumulation
Cumulation/(%)
6
6
88
Cumulation/(%)
8
Volume Volume Frequency/(%) Frequency/(%)
Volume Frequency/(%)
10
Volume Frequency/(%)
Cumulation Cumulation Cumulation
8
20 20
40
00
20
Figure Figure 2. Distribution 2. Distribution Distribution of aluminum of aluminum aluminum particle particle diameters. diameters. Figure 2. of particle diameters. 0
0
Statistics Statistics on the on1.45 microvoids the microvoids microvoids werewere were collected collected based based on their on their distribution distribution geometry and geometry geometry extracted extracted Statistics on the collected on their distribution extracted 3.81 2.00 2.76 26.17 and and 7.24 based 9.98 5.25 18.98 13.77 fromfrom from the SEM the SEM SEM images images (one(one (one and and two and two real twoDiameters/(m) structure real structure structure images images in Table in Table Table 1), as1), 1), shown as shown shown in Figure in Figure Figure 3. 3. 3. the images real images in as in
Figure Figure 2. 2. Distribution Distribution of of aluminum aluminum particle particle diameters. diameters.
Statistics on the microvoids were collected based on their distribution and geometry extracted from the SEM images (one and two real structure images in Table 1), as shown in Figure 3.
Materials 2016, 9, 590
6 of 16
Statistics on the microvoids were collected based on their distribution and geometry extracted from the2016, SEM images (one and two real structure images in Table 1), as shown in Figure 3. Materials 9, 590 6 of 16 Materials 2016, 9, 590
6 of 16
(a)
(b)
(a) (b) Figure 3. 3. Distribution Distribution and geometry of 1-R; and and Figure and geometry of microvoids microvoids extracted extracted from from SEM SEM images. images. (a) (a) From From 1-R; (b) from 2-R microstructure in Table 1. Figure Distribution and geometry (b) from3.2-R microstructure in Table 1.of microvoids extracted from SEM images. (a) From 1-R; and (b) from 2-R microstructure in Table 1. The shapes of microvoids are described by shape factor S and circularity C: The shapes of microvoids are described by shape factor S and circularity C: The shapes of microvoids are described by shape factor S and circularity C: П (1) = 2 4 Π (1) S=“ П 44π A (2) =4 A C=“44πП 2 (2) (2) Π П where П is the perimeter of voids, and A is the area of voids. Values of S and C of 1.0 indicate a where isisthe perimeter ofof voids, and A isA0.0, the area of voids. of S and of 1.0C indicate a perfecta perfect circle. As either value approaches it indicates anValues increasingly shape. Statistics where Π П the perimeter voids, and is the area of voids. Values ofelongated SC and of 1.0 indicate circle. As 0.0, indicates an which increasingly shape. Statistics of S of S and Ceither for As thevalue voidsapproaches are depicted in it Figure from we canelongated see that the circularity of voids perfect circle. either value approaches 0.0, it4,indicates an increasingly elongated shape. Statistics and C for the voids are depicted in Figure 4, from which we can see that the circularity of voids is is 0.8 the andvoids 1, whereas the shape factor 4, is between 0.8 we andcan 1.2.see Tothat this the extent, it is reasonable of between S and C for are depicted in Figure from which circularity of voids between 0.8 and 1, whereas the shape factor is between 0.8 and 1.2. To this extent, it is reasonable to approximate microvoids asthe circles, theisequivalent diameter v can calculated following is between 0.8 and 1, whereas shapeand factor between 0.8 and 1.2.dTo thisbeextent, it is reasonable to approximate microvoids as circles, and the equivalent diameter d can be calculated following v Equation (3). The distribution of equivalent diameters is shown in Figure 5. In addition, the porosity to approximate microvoids as circles, and the equivalent diameter dv can be calculated following Equation (3). The distribution of equivalent diameters is shown in Figure 5. In addition, the porosity of 1.185% (3). is calculated from the characteristics of voids. Equation The distribution ofstatistical equivalent diameters is shown in Figure 5. In addition, the porosity of 1.185% is calculated from the statistical characteristics of voids. of 1.185% is calculated from the statistical characteristics of voids. 4 (3) = 4A П dv=“4 (3) (3) ПΠ
(a) Circularity
(b) Shape factor
(a)and Circularity (b) Shape factor Figure 4. (a) Circularity C; (b) shape factor S of the microvoids extracted from the microstructures. Figure 4. (a) Circularity C; and (b) shape factor S of the microvoids extracted from the microstructures. Figure 4. (a) Circularity C; and (b) shape factor S of the microvoids extracted from the microstructures.
The reproduction of a simulated microstructure is based on a random sequential adsorption (RSA)The algorithm, whichofwas initially used for studying adsorption is widely used for reproduction a simulated microstructure is protein based on a randomand sequential adsorption The reproduction of a simulated microstructure is based on a random sequential adsorption (RSA) regeneration of composite microstructures [33]. The basic flow of the RSA algorithm consists of (RSA) algorithm, which was initially used for studying protein adsorption and is widely used for algorithm, which was initially used for studying protein adsorption and is widely used for regeneration generating particle and microvoid within the predetermined domain and generating regenerationthe of first composite microstructures [33]. The basic flow of the RSA algorithm consists of subsequent particles and microvoids while judging whether they are intersecting with existing ones generating the first particle and microvoid within the predetermined domain and generating until the predetermined particle and microvoid volume fraction is reached. Particles or voids judged subsequent particles and microvoids while judging whether they are intersecting with existing ones to be intersecting with existing be abandoned, and new will be generated and judged until the predetermined particleones andmust microvoid volume fraction isones reached. Particles or voids again. With the RSA method, random distribution and degradation of particles can be well to be intersecting with existing ones must be abandoned, and new ones will be generated andfulfilled. judged
Materials 2016, 9, 590
7 of 16
of composite microstructures [33]. The basic flow of the RSA algorithm consists of generating the first particle and microvoid within the predetermined domain and generating subsequent particles and microvoids while judging whether they are intersecting with existing ones until the predetermined particle and microvoid volume fraction is reached. Particles or voids judged to be intersecting with Materials 2016, 9, 590 16 existing ones must be abandoned, and new ones will be generated and judged again. With77 of the Materials 2016, 9, 590 of 16 RSA method, random distribution and degradation of particles can be well fulfilled. In this study, In study, the microstructure of is based the simulated Al/PTFE is regenerated on the statistical characteristics of In this this study, microstructure the simulated simulated of microstructure of Al/PTFE Al/PTFEbased is regenerated regenerated based on on the the statistical statistical characteristics of particles and voids, as shown in Figures 2, 4 and 5. All processes are achieved by particles and voids, as shown invoids, Figures 4 and in 5. All processes are5. achieved by a MATLAB program characteristics of particles and as2,shown Figures 2, 4 and All processes are achieved by aa MATLAB developed author and chart of the is in developed by the author and by thethe flow chart of the theflow program in Figure 6. Reproduced MATLAB program program developed by the author and the flow chart is ofdepicted the program program is depicted depicted in Figure Figure 6. 6. Reproduced simulated microstructures are depicted in Table 1 in the rightmost column, and five simulated microstructures are depicted in 1 in the rightmost column, and five models Reproduced simulated microstructures areTable depicted in Table 1 in the rightmost column, andwere five models 1-S, 2-S, 3-S, 4-S 5-S, SS indicating marked as 1-S,marked 2-S, 3-S,as and Sand indicating models were were marked as4-S 1-S, 2-S,5-S, 3-S,with 4-S and 5-S, with with“simulated.” indicating “simulated.” “simulated.” 8 8
Diameter Diameter Polynomial Fit of Diameter Change Polynomial Fit of Diameter Change
Equivalentdiameter/m diameter/m Equivalent
7 7 6 6 5 5 4 4 3 3 2 2 1 1 0 0
0 0
10 10
20 20
30 30
Voids number Voids number
40 40
50 50
microvoids. Figure Figure 5. 5. Equivalent Equivalent diameter diameter distribution distribution of of microvoids. microvoids.
Figure 6. Flowchart of the reproduction process of the simulated microstructure of Al/PTFE. Figure6.6. Flowchart Flowchart of of the thereproduction reproductionprocess processof ofthe thesimulated simulatedmicrostructure microstructureofofAl/PTFE. Al/PTFE. Figure
4. 4. Numerical Numerical Simulation Simulation After After the the real real structure-based structure-based and and simulated simulated microstructures microstructures were were regenerated, regenerated, finite finite element element analysis modelling a quasi-static compression test was performed with ABAQUS/Standard analysis modelling a quasi-static compression test was performed with ABAQUS/Standard 6.13 6.13 (V6.11, (V6.11, Providence, Providence, RI, RI, USA). USA).
Materials 2016, 9, 590
8 of 16
4. Numerical Simulation After the real structure-based and simulated microstructures were regenerated, finite element analysis modelling a quasi-static compression test was performed with ABAQUS/Standard 6.13 (V6.11, Providence, RI, USA). 4.1. Material Models To study the effectiveness of the microstructure reproduction algorithm and FE analysis methods and compare them with the experimental results, both aluminum particles and PTFE matrix are modeled as elastic–plastic materials [31]. The elastic–plastic constants are listed in Table 2. Table 2. Material properties of Al and PTFE used for simulation [34,35]. Material
Elastic Modulus (GPa)
Poisson’s Ratio
Yield Stress (MPa)
Al PTFE
70.00 0.315
0.33 0.41
325.00 8.27
Another important point to be considered is the properties of the materials within the microvoids. As a matter of fact, the introduction of air into composites during pressing and expansion/contraction of constituents during the sintering process is the cause of microvoids. However, in a quasi-static compression domain, the effect of air within microvoids on mechanical properties of composite is found to be small or nonexistent. The effect is due to the lack of constituents rather than the air. Thus, the microvoids are assumed to be vacuums. 4.2. Boundary Conditions and Homogenization Methods For a given RVE, three types of boundary conditions are typically used: (i) the prescribed displacement boundary condition (PDBC); (ii) the prescribed traction boundary condition (PTBC); and (iii) the periodic boundary condition (PBC). The effects of the three types of boundary conditions on the prediction of RVE models were investigated by Chen C, and the results showed that PDBC and the PTBC overestimated and underestimated the yield strength, respectively, whereas the PBC provided the best performance [36]. This is because when an RVE of particle-reinforced composites is subjected to external loads, given that the size of the RVE is assumed to be very small compared with the macroscopic material, the deformation field in the RVE will be approximately the same as the field near the neighboring RVEs [37]. This statement was experimentally verified by Cheng [38]. Thus, the RVE must satisfy the conditions of (i) opposite edges deforming in an identical way and (ii) stress continuity across the boundaries. Thus, the PBC would be the best choice. In this paper, the PBC is applied to all simulated and real structure-based finite element models. For any given average deformation gradient F applied to the RVE, the PBC can be represented in the following general format [39]: x pQ1 q ´ x pQ2 q “ F rx pQ1 q ´ x pQ2 qs , V pQ1 q “ ´V pQ2 q
(4)
where Q1 represents a general node on the face of an RVE cube, and the corresponding node Q2 is at the same location on the opposite face. V is the force applied to the nodes. X and x denote the positions of a material point in the original and deformed configurations, respectively. The PBC is implemented by a code in the Python language developed by the author, which extracts boundary node information and constrains the nodes based on Equation (4). To prevent rigid body movement during compression, the lower-left node is fixed in the x- and y-directions, whereas the lower-right node is fixed in the y-direction. To apply a compression load to the FE models, only the top-left node is given a prescribed displacement to create a 10% compression strain due to the PBCs.
Materials 2016, 9, 590
9 of 16
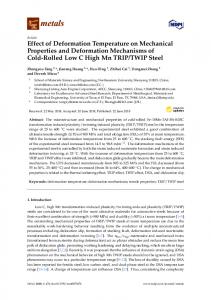
To obtain the effective elastic properties of the RVE, a homogenization approach is employed by considering the heterogeneous composite in the microscale to be a homogeneous material in the macroscale [18]. Given that the PBC is applied, macro-stress and macro-strain are derived by averaging the stress and strain tensor over the volume of the RVE: ż ż 1 1 σij “ σ px, y, zq dV; εij “ ε c px, y, zq dV (5) V V ij V V ij where σij and εij represent the average stress and strain in the RVE, respectively, whereas σij and ε ij represent the stress and strain of one point in the RVE, respectively. With the average stress and strain, effective elastic parameters can be calculated. 4.3. Meshing and Analysis Both real microstructure-based and simulated models were meshed with three-node linear plane strain triangle elements—i.e., CEP3 elements—so the analysis of all models was under the plane strain hypothesis. To apply the periodic boundary condition, the models had to be meshed with periodic elements—i.e., the same number of elements and nodes on opposite edges. Another point to consider is that the dimensions of some particles are very small, so the element size should be small enough to mesh small particles with sufficient precision. Thus, the same number of seeds was selected along opposite edges, and the models were all meshed with an element size of approximately 1 µm. Taking the 1-R model, which is the largest, for example, it contains 183,119 nodes and 364,757 elements. Compression strain was set to 10% by applying displacement in the y direction. General contact was added for all models in case the contact of materials resulted from the contraction of microvoids. After the analysis was complete, stresses and strains were extracted by a Python code to draw stress–strain curves and calculate elastic constants. 5. Results and Discussion 5.1. Contour and Stress–Strain Distribution Analysis The contour plots of von Mises effective stress and deformation at the final moment are shown in Figure 7. Because of the excessive contour plots of the 10 models, 4-R and 4-S models—i.e., the models of dimensions 97 µm ˆ 68 µm, which are also representative—are taken for example. First, opposite edges deforming identically and stress continuity across the boundaries can be observed, which suggests that proper PBC is applied [18]. Owing to the mismatch of the elastic modulus between the particles and matrix, von Mises stress shows an inhomogeneous distribution in the matrix. When loaded, particles are subjected to higher stress than the surrounding matrix, which demonstrates the particle reinforcing mechanism. The maximum stress develops in the interfaces of the particles and matrix, especially where the particles bulge and draw close to another one (as indicated by the red circles in Figure 7a). This implies that when the composite is further loaded, bulges of particles will tend to be sheared to make more rounded ones, and the matrix will fracture owing to slippage of particles. Stress concentration occurs at tips along the direction of the long axis of microvoids owing to the close process and predicts the fracture of matrix [40]. As shown in Figure 7c, during the loading process, microvoids are closing, and shape changes are much more obvious than those of particles. This shows that the deformation mechanism within the composite is microvoids deforming and being compressed first, and then, prominent shape changes occur to the particles and matrix after the microvoids close. In addition, inhomogeneous plastic strain distribution concentrating in an array of rather straight shear bands at 45˝ to the loading axis can be observed in Figure 7d, indicated by the red elliptical circle; this is the main failure mechanism of Al/PTFE [35].
Materials 2016, 9, 590 Materials 2016, 9, 590 Materials 2016, 9, 590
10 of 16 10 of 16 10 of 16
Figure Deformation contour of von Mises stress and plastic strain: (a) von Mises stress Figure 7.7. 7. Deformation Deformation and and contour contour of of von von Mises Mises stress stress and and plastic plastic strain: strain: (a) (a) von von Mises Mises stress stress Figure and distribution of 4-R model; (b) von Mises stress distribution of 4-S model; (c) deformation of distribution of 4-R model; (b) von Mises stress distribution of 4-S model; (c) deformation of distribution of 4-R model; (b) von Mises stress distribution of 4-S model; (c) deformation of microvoid microvoid over time; (d) plastic strain distribution of 4-S model. Red circles indicate maximum shear microvoid over time; (d) plastic strain distribution of 4-S model. Red circles indicate maximum shear over time; (d) plastic strain distribution of 4-S model. Red circles indicate maximum shear stress points, stress points, and red indicates the positions microvoids in red elliptical circle stress and the theindicates red rectangle rectangle indicates positionsinof of(c); microvoids in (c); (c); red elliptical and thepoints, red rectangle the positions of the microvoids red elliptical circle indicates thecircle 45˝ indicates the 45° shear bands in (d). indicates thein45° shear bands in (d). shear bands (d).
5.2. Stress–Strain Curve Comparison between Simulations and Experiments 5.2. Stress–Strain Stress–Strain Curve Curve Comparison Comparison between between Simulations Simulations and andExperiments Experiments 5.2. In this section, stress–strain curves of the five real microstructure-based and five simulated In this this section, section, stress–strain stress–strain curves curves of of the the five five real real microstructure-based microstructure-based and and five five simulated simulated In microstructure models are extracted and compared with those of the experiments, as shown in microstructure models are extracted and compared with those of the experiments, as shown in in microstructure models are extracted and compared with those of the experiments, as shown Figure 8. Figure 8. 8. Figure
Truestress stress(MPa) (MPa) True
20 20
15 15
EEx x pepe rim rim enen tata l rl r eses ulul tsts
25 25
Simulated Simulated microstructures microstructures
10 10
5 5
0 0 0.00 0.00
Real Real microstructure-based microstructure-based modles modles
0.02 0.02
0.04 0.04
0.06 0.06
True True strain strain
0.08 0.08
1-S 1-S 2-S 2-S 3-S 3-S 4-S 4-S 5-S 5-S 1-R 1-R 2-R 2-R 3-R 3-R 4-R 4-R 5-R 5-R Sample 1 Sample 1 Sample 2 Sample 2 Sample 3 Sample 3
0.10 0.10
0.12 0.12
Figure 8. Comparison between simulated stress–strain curves and experimental results. Figure Figure 8. 8. Comparison Comparison between between simulated simulated stress–strain stress–strain curves curves and and experimental experimentalresults. results.
Materials 2016, 9, 590
11 of 16
Generally, as shown in Figure 8, the curves of simulated microstructure models and real microstructure-based models show good consistency. Two groups of curves show good consistency in the elastic region and within small plastic strain. When the strain is higher than 4%, obvious variation occurs. At each strain value, stresses of simulated microstructure models give higher values than real microstructure-based models. This is because there are more small particles in the simulated microstructures caused by the reproduction algorithm. When particles are being generated, there is enough space for the initial ones, which could have larger diameters. However, for the subsequent ones, they are generated after judging whether they are intersecting with existing ones; thus, only smaller particles can be generated, and even smaller ones in the following steps. Therefore, there might be less inter-particle spacing and more local particle concentration, which will enhance the strength of materials [31]. However, the consistency of each group of curves indicates that both the simulated models and real microstructure-based models are representative and, although they are selected randomly, of different dimensions. The experimental results are shown in Figure 8. The results of both the simulated and real microstructure-based models describe the experiments satisfactorily. They are almost identical to the experimental curves in the elastic and plastic regimes. Before the strain of 0.02—although three groups of curves nearly completely overlap, the experimental curves show smaller gradients in the elastic region than the simulated models and are much closer to those of the real microstructure-based models. However, in the vicinity of the yield point, the curves of simulations deviate from the experimental ones. In the plastic region, especially when the strain is higher than 0.05, two of the experimental curves lie between those of the real microstructures and simulated microstructures, whereas one overlaps or lies above the simulated ones. The reasons for this are that, although microvoids are considered in both the simulated microstructure and real microstructure-based models, only those that are relatively large and obvious and those presented in the SEM images can be counted and used in the statistics. Moreover, the simulated microstructure models are idealized. The differences between curves can be attributed to these reasons. To compare them with the 2D models, 3D models are established based on the same statistical information. However, the largest challenge of using either a 3D real microstructure-based model or simulated model is that many elements and a highly refined mesh are required to conform to the heterogeneous nature of the microstructure. Although a 3D model without simplification of the microstructure certainly gives a better prediction of composite properties, it requires extreme computational power. Three-dimensional models were calculated previously by the author; a 50 µm ˆ 50 µm ˆ 50 µm model based on the statistics of particles and microvoids given in Section 3.2 cost two times more computation time than that of the 1-R and 1-S models and three times the time to extract the results. Given that the 50 µm ˆ 50 µm ˆ 50 µm model takes limited particles and microvoids, the author built a 100 µm ˆ 100 µm ˆ 100 µm model that contained approximately 500 particles and cost 18 h to compute; the output database was approximately 18 GB. The results of three 50 µm ˆ 50 µm ˆ 50 µm models are plotted in Figure 9c to compare with the experimental results and show the advantages of 2D models. A contour plot of the 3D-1 model at the final moment and stress–strain curves are depicted in Figure 9. In addition, identical deformation in opposite faces and stress continuity can be observed, which indicates that the periodic boundary conditions are applied. Stress concentration, shear bands and compression of microvoids can be observed and follow the same mechanism described in Section 5.1. Stress–strain curves agree well with that of the experimental ones, both in elastic and plastic regions. However, the curves show relatively large variations. This is because the 3D models are of dimensions of 50 µm ˆ 50 µm ˆ 50 µm, and only a limited number of particles can be considered; i.e., the 3D models are not representative. Every time particles are generated, they are of different diameters and distributions and thus have important effects on the mechanical behavior. Larger models with more particles might reduce the variation of stress–strain curves.
Materials 2016, 9, 590 Materials 2016, 9, 590
12 of 16 12 of 16
stress–strain curves: (a) (a) contour plotplot of matrix; (b) Figure 9. Contour Contourplot plotatatthe thefinal finalmoment momentand and stress–strain curves: contour of matrix; contour plot of particles; (c) comparison between between stress–strain curves of 3D models (b) contour plot of particles; (c) comparison stress–strain curves of and 3D experimental models and results. experimental results.
The elastic elastic modulus The modulus and and yield yield stresses stresses of of all all simulations simulations and and experiments experiments are are listed listed in in Table Table 3. 3. After comparison, we can see that both the elastic modulus and yield stress calculated from the After comparison, we can see that both the elastic modulus and yield stress calculated from the simulations are higher than than those those of of the the experiments; experiments; i.e., i.e., the the simulations simulations overestimate overestimate the the elastic elastic simulations are higher modulus and yield stress for the Al/PTFE studied in this paper. Here, relative errors of simulated modulus and yield stress for the Al/PTFE studied in this paper. Here, relative errors of simulated elastic modulus modulus and elastic and yield yield stresses stresses over over experimental experimental ones ones were were calculated calculated to to show show the the accuracy. accuracy. Relative error s were calculated by Equation (6): Relative error s were calculated by Equation (6): − (6) = simulated value ´ experimental value× 100%. ˆ 100%. (6) Relative error “ experimental value By comparison, the relative errors of predictions from 2D models over the experimental results By comparison, the relative errors of predictions from 2D models over the results are are within 11%, whereas those of real microstructure-based models areexperimental only 1.9% and 6.6%, within 11%, whereas those of real microstructure-based models are the onlyhighest 1.9% and 6.6%, respectively. respectively. Corresponding predictions from 3D models show variations in elastic Corresponding predictions from 3D models show the modulus highest variations in elastic modulus After with modulus with 13.6% and 7.3% relative error over elastic and yield stress, respectively. 13.6% and 7.3% relative error over elastic modulus and yield stress, respectively. After comprehensive comprehensive comparisons, real microstructure-based models that consider particle distribution, comparisons, microstructure-based models followed that consider particle distribution, geometry and geometry and real microvoids give the best results, by the simulated-microstructure models microvoids givebased the best results, followed by and the simulated-microstructure models and 3D models and 3D models on statistics of particles microvoids. based on statistics of particles and microvoids.
Materials 2016, 9, 590
13 of 16
Table 3. Comparison of elastic modulus and yield stress between simulations and experiments. SE represents standard error. Type of Models or Experiments
Dimensions of Model (µm)
Elastic Modulus (MPa)
Yield Stress (MPa)
1-S 2-S 3-S 4-S 5-S
316 ˆ 221 316 ˆ 221 140 ˆ 98 97 ˆ 68 84 ˆ 59
544.54 551.95 552.71 536.80 555.42
1-R 2-R 3-R 4-R 5-R
316 ˆ 221 316 ˆ 221 140 ˆ 98 97 ˆ 68 84 ˆ 59
3D-1 3D-2 3D-3 Sample 1 Sample 2 Sample 3
Elastic Modulus (MPa)
Yield Stress (MPa)
Mean Value ˘ SE
Relative Error Over Experimental
Mean Value ˘ SE
Relative Error Over Experimental
13.27 13.40 13.38 13.11 13.22
548.28 ˘ 3.39
10.9%
13.28 ˘ 0.05
12.85 ˘ 0.27
502.26 505.97 500.70 506.62 504.95
12.79 12.76 12.41 12.93 12.95
504.10 ˘ 1.13
1.9%
10.6%
7.3%
50 ˆ 50 ˆ 50 50 ˆ 50 ˆ 50 50 ˆ 50 ˆ 50
592.03 554.71 538.40
13.32 12.84 12.39
561.71 ˘ 15.87
13.6%
12.77 ˘ 0.10
11.98 ˘ 0.27
Φ 12.00 ˆ 10.00 mm Φ 12.00 ˆ 10.00 mm Φ 12.00 ˆ 10.00 mm
524.36 460.61 489.57
11.96 11.52 12.45
491.51 ˘ 18.43
-
6.6%
-
Materials 2016, 9, 590
14 of 16
6. Conclusions Two-dimensional microscale finite element analyses of Al/PTFE composite are conducted in this paper, which include real microstructure-based models established following a series of image processing and finite element modelling procedures and simulated microstructure models reproduced on a statistical basis considering the geometry and distribution of microvoids. In addition to 2D models, 3D finite element modelling and experiments are conducted to compare with the two types of 2D models, and the results with different methods are discussed and analyzed. Specifically, ‚
‚
‚
‚
the real microstructure-based models, established by processing SEM images and extracting edges of Al particles and microvoids, are able to accurately represent the distribution and geometry of particles and microvoids; the simulated microstructure models are generated by statistics on the distribution and geometry of particles and microvoids and consider the drawbacks of RVEs regarding regular particle arrangement and micro defects in composite structures; compared with 3D models, the 2D real microstructure-based models and simulated microstructure models are more efficient methods to simulate the mechanical behavior of composites at the microscale; experimental results show that the microscale modelling of real microstructure-based models and simulated microstructure models gives good predictions of elastic modulus and yield stress. Two types of models predict the elastic modulus with relative errors of 1.9% and 10.9%, respectively, whereas those of the yield stress are 6.6% and 10.6%, respectively.
Acknowledgments: The authors are very grateful for the support received from the National Natural Science Foundation of China (No. 11202028 and 11472053) and Research Fund for the Doctoral Program of Higher Education of China (No. 20121101110012). Author Contributions: Chao Ge performed the experiments, analyzed the experimental and numerical results and wrote the paper. Yongxiang Dong designed the experiments, proposed the modeling methods and analyzed experimental and numerical data. Wubuliaisan Maimaitituersun performed the modeling work and participated in the experiments. Conflicts of Interest: The authors declare no conflict of interest.
References 1. 2. 3. 4. 5.
6.
7. 8.
National Academy of Science. Available online: http://www.nap.edu/catalog/10918.html (accessed on 20 June 2015). Joshi, V.S. Process for Making Polytetrafluoroethylene-Aluminium Composite and Product. U.S. Patent 6,547,993 B1, 15 April 2003. Casem, D.T. Mechanical Response of an Al-PTFE Composite to Uniaxial Compression over a Range of Strain Rates and Temperatures, Report; U.S. Army Research Laboratory: Adelphi, MD, USA, 2008. Raftenberg, M.N.; Mock, W.; Kirby, G.C. Modeling the impact deformation of rods of a pressed PTFE/Al composite mixture. Int. J. Impact Eng. 2008, 35, 1735–1744. [CrossRef] Zhang, X.F.; Zhang, J.; Qiao, L.; Shi, A.S.; Zhang, Y.G.; He, Y.; Guan, Z.W. Experimental study of the compression properties of Al/W/PTFE granular composites under elevated strain rates. Mater. Sci. Eng. A 2013, 581, 48–55. [CrossRef] Cai, J.; Nesterenko, V.F.; Vecchio, K.S.; Jiang, F.; Herbold, E.B.; Benson, D.J.; Addiss, J.W.; Walley, S.M.; Proud, W.G. The influence of metallic particle size on the mechanical properties of polytetraflouroethylene-Al-W powder composites. Appl. Phys. Lett. 2008, 92, 031903. [CrossRef] Xu, S.L.; Yang, S.Q.; Zhang, W. The mechanical behaviors of polytetrafluorethylene/Al/W energetic composites. J. Phys. Condens. Matter. 2009, 21, 285401. [CrossRef] [PubMed] Cai, J.; Walley, S.M.; Hunt, R.J.A.; Proud, W.G.; Nesterenko, V.F.; Meyers, M.A. High-strain, high-strain-rate flow and failure in PTFE/Al/W granular composites. Mater. Sci. Eng. A 2008, 472, 308–315. [CrossRef]
Materials 2016, 9, 590
9.
10. 11. 12. 13. 14. 15. 16. 17. 18. 19. 20. 21. 22.
23. 24. 25. 26. 27. 28. 29.
30. 31.
32. 33.
15 of 16
Herbold, E.B.; Nesterenko, V.F.; Benson, D.J.; Cai, J.; Vecchio, K.S.; Jiang, F.; Addiss, J.W.; Walley, S.M.; Proud, W.G. Particle size effect on strength, failure, and shock behavior in polytetrafluoroethylene-Al-W granular composite materials. J. Appl. Phys. 2008, 104, 103903. [CrossRef] Osborne, D. The Effects of Fuel Particle Size on the Reaction of Al/Teflon Mixtures. Master’s Thesis, Texas Tech University, Lubbock, TX, USA, 2006. Wang, H.F.; Zheng, Y.F.; Yu, Q.B.; Liu, Z.W.; Yu, W.M. Impact-induced initiation and energy release behavior of reactive materials. J. Appl. Phys. 2011, 110, 074904. [CrossRef] Bai, Y.L.; Wang, H.Y.; Xia, M.F.; Ke, F.J. Trans-scale mechanics: Looking for the missing links between continuum and micro/nanoscopic reality. Acta Mech. Sin. 2008, 24, 111–126. [CrossRef] Bai, Y.L.; Xia, M.F.; Ke, F.J.; Li, H.L. Closed trans-scale statistical microdamage mechanics. Acta Mech. Sin. 2002, 18, 1–17. Li, S.G.; Wongsto, A. Unit cells for micromechanical analyses of particle-reinforced composites. Mech. Mater. 2004, 36, 543–572. [CrossRef] Gitman, I.M.; Askes, H.; Sluys, L.J. Representative volume: Existence and size determination. Eng. Fract. Mech. 2007, 74, 2518–2534. [CrossRef] Li, S. General unit cells for micromechanical analyses of unidirectional composites. Compos. Part A Appl. Sci. 2001, 32, 815–826. [CrossRef] Huang, H.; Bush, M.B. Finite element analysis of mechanical properties in discontinuously reinforced metal matrix composites with ultrafine microstructure. Mater. Sci. Eng. A 1997, 232, 63–72. [CrossRef] Sun, C.T.; Vaidya, R.S. Prediction of composite properties, from a representative volume element. Compos. Sci. Technol. 1996, 56, 171–179. [CrossRef] Song, W.D.; Liu, H.Y.; Ning, J.G. Tensile Property and Crack Propagation Behavior of Tungsten Alloys. Int. J. Mod. Phys. B 2011, 25, 1475–1492. [CrossRef] Meijer, G.; Ellyin, F.; Xia, Z. Aspects of residual thermal stress/strain in particle reinforced metal matrix composites. Compos. Part B Eng. 2000, 31, 29–37. [CrossRef] Wang, M.R.; Pan, N. Elastic property of multiphase composites with random microstructures. J. Comput. Phys. 2009, 228, 5978–5988. [CrossRef] Guo, Z.Y.; Shi, X.H.; Chen, Y.; Chen, H.P.; Peng, X.Q.; Harrison, P. Mechanical modeling of incompressible particle-reinforced neo-Hookean composites based on numerical homogenization. Mech. Mater. 2014, 70, 1–17. [CrossRef] Leite, J.P.B.; Slowik, V.; Apel, J. Computational model of mesoscopic structure of concrete for simulation of fracture processes. Comput. Struct. 2007, 85, 1293–1303. [CrossRef] Mishnaevsky, L.; Derrien, K.; Baptiste, D. Effect of microstructure of particle reinforced composites on the damage evolution: Probabilistic and numerical analysis. Compos. Sci. Technol. 2004, 64, 1805–1818. [CrossRef] Bergstrom, J.S.; Boyce, M.C. Mechanical behavior of particle filled elastomers. Rubber Chem. Technol. 1999, 72, 633–656. [CrossRef] Van Dommelen, J.A.W.; Brekelmans, W.A.M.; Baaijens, F.P.T. Micromechanical modeling of particle-toughening of polymers by locally induced anisotropy. Mech. Mater. 2003, 35, 845–863. [CrossRef] LLorca, J.; Segurado, J. Three-dimensional multiparticle cell simulations of deformation and damage in sphere-reinforced composites. Mater. Sci. Eng. A Struct. 2004, 365, 267–274. [CrossRef] White, B.W.; Springer, H.K.; Jordan, J.L.; Spowart, J.E.; Thadhani, N.N. Mesoscale Simulations of Particle Reinforced Epoxy-Based Composites. AIP Conf. Proc. 2012, 1, 1426. Duschlbauer, D.; Bohm, H.J.; Pettermann, H.E. Computational simulation of composites reinforced by planar random fibers: Homogenization and localization by unit cell and mean field approaches. J. Compos. Mater. 2006, 40, 2217–2234. [CrossRef] Li, M.S.; Ghosh, S.; Rouns, T.N.; Weiland, H.; Richmond, O.; Hunt, W. Serial sectioning method in the construction of 3-D microstructures for particle-reinforced MMCs. Mater. Charact. 1998, 41, 81–95. [CrossRef] Ekici, R.; Apalak, M.K.; Yildirim, M.; Nair, F. Simulated and actual micro-structure models on the indentation behaviors of particle reinforced metal matrix composites. Mater. Sci. Eng. A Struct. 2014, 606, 290–298. [CrossRef] Yotte, S.; Breysse, D.; Riss, J.; Ghosh, S. Cluster characterisation in a metal matrix composite. Mater. Charact. 2001, 46, 211–219. [CrossRef] Feder, J. Random Sequential Adsorption. J. Theor. Biol. 1980, 87, 237–254. [CrossRef]
Materials 2016, 9, 590
34. 35.
36. 37.
38.
39. 40.
16 of 16
Bergstrom, J.S.; Hilbert, L.B. A constitutive model for predicting the large deformation thermomechanical behavior of fluoropolymers. Mech. Mater. 2005, 37, 899–913. [CrossRef] Borbely, A.; Biermann, H.; Hartmann, O. FE investigation of the effect of particle distribution on the uniaxial stress-strain behaviour of particulate reinforced metal-matrix composites. Mater. Sci. Eng. A Struct. 2001, 313, 34–45. [CrossRef] Chen, C.; Lu, T.J.; Fleck, N.A. Effect of imperfections on the yielding of two-dimensional foams. J. Mech. Phys. Solids 1999, 47, 2235–2272. [CrossRef] Smit, R.J.M.; Brekelmans, W.A.M.; Meijer, H.E.H. Prediction of the mechanical behavior of nonlinear heterogeneous systems by multi-level finite element modeling. Comput. Method Appl. Mech. Eng. 1998, 155, 181–192. [CrossRef] Cheng, C.; Hiltner, A.; Baer, E.; Soskey, P.R.; Mylonakis, S.G. Deformation of Rubber-Toughened Polycarbonate—Microscale and Nanoscale Analysis of the Damage Zone. J. Appl. Polym. Sci. 1995, 55, 1691–1702. [CrossRef] Guo, Z.Y.; Peng, X.Q.; Moran, B. Large deformation response of a hyperelastic fibre reinforced composite: Theoretical model and numerical validation. Compos. Part A Appl. Sci. Manuf. 2007, 38, 1842–1851. [CrossRef] Zhang, P.; Li, F.G. Effect of particle characteristics on deformation of particle reinforced metal matrix composites. Trans. Nonferrous Met. Soc. China 2010, 20, 655–661. [CrossRef] © 2016 by the authors; licensee MDPI, Basel, Switzerland. This article is an open access article distributed under the terms and conditions of the Creative Commons Attribution (CC-BY) license (http://creativecommons.org/licenses/by/4.0/).