Microspatial gene expression patterns in the Amazon River Plume Brandon M. Satinskya, Byron C. Crumpb, Christa B. Smithc, Shalabh Sharmac, Brian L. Zielinskid, Mary Dohertye, Jun Mengc, Shulei Sunf, Patricia M. Medeirosc, John H. Pauld, Victoria J. Colese, Patricia L. Yagerc, and Mary Ann Moranc,1 Departments of aMicrobiology and cMarine Sciences, University of Georgia, Athens, GA 30602; bCollege of Earth, Ocean, and Atmospheric Science, Oregon State University, Corvallis, OR 97331; dCollege of Marine Science, University of South Florida, St. Petersburg, FL 33701; eHorn Point Laboratory, University of Maryland Center for Environmental Science, Cambridge, MD 21613; and fCenter for Research in Biological Systems, University of California, San Diego, La Jolla, CA 92093 Edited by Edward F. DeLong, Massachusetts Institute of Technology, Cambridge, MA, and approved June 23, 2014 (received for review February 14, 2014)
|
|
metatranscriptomics metagenomics biogeochemistry gene expression ratios marine bacteria
|
|
fully quantitative inventories of microbial genes and transcripts in a natural ecosystem, producing a highly resolved view of gene expression driving carbon and nutrient flux through FL and particle-associated (PA) microbes of the Amazon Plume. We compare the level of transcription for the same gene in each microenvironment, enumerate transcripts mediating key carbon and nutrient transformations, and predict the biogeochemical roles of transcriptionally active FL and PA cells. Results and Discussion A Quantitative Multiomics Dataset. Inventories of microbial genes
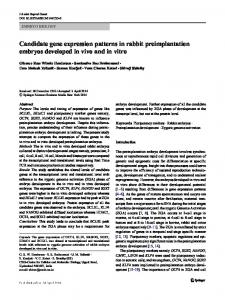
and transcripts were obtained from PA and FL cells (defined operationally as PA, >2.0 μm; FL, 0.2–2.0 μm) in Amazon Plume waters at the outer continental shelf in July 2010 (station 10). Coverage of eukaryotic transcripts was improved by additionally targeting poly(A)-tailed mRNAs in the PA fraction (Fig. 1). Each sequence library obtained in duplicate for the three metaomics data types contained 1.2–11 × 106 possible protein-encoding reads averaging 190 nt. The eukaryotic community was dominated by sequences that binned to the genomes of diatoms Thalassiosira pseudonana, Phaeodactylum tricornutum, and Odontella sinensis and the green picoeukaryote Micromonas sp. RC299; direct microscopic observation confirmed a dense multispecies diatom bloom. We focus here on analysis of the genes and transcripts from Bacteria and Archaea [hereafter referred to as prokaryotes (15)], accounting for ∼70% of the annotated reads. Based on internal standard recoveries, the sequencing depth for each sample (percentage of sampled genes or transcripts sequenced) ranged from 1.5 × 10⁻⁶ to 8.7 × 10⁻⁴ (SI Appendix, Table Significance
M
icrobially mediated biogeochemical transformations in the ocean take place within a poorly characterized matrix of particles, colloids, and dissolved phase materials (1) (Fig. 1). This microspatial structure affects the taxonomy and functional gene inventories of microbial communities (2, 3), driven by differences in nutrient concentrations, light exposure, oxygen availability, and predation (4, 5), and undoubtedly affects the types and rates of biogeochemical processes occurring as well. Bacteria associated with particulate material have higher rates of extracellular enzyme activity (6, 7) and metabolism (8, 9) compared with free-living (FL) cells. However, these differences remain difficult to measure and challenging to link to biogeochemistry. The microspatial structure of the Amazon River Plume is strongly influenced by the mixing of riverine dissolved organic carbon (DOC) and particulate organic carbon (POC) into the tropical Atlantic. Fluvial export from the Amazon River amounts to 22.3 Tg·y−1 of DOC and 13.7 Tg·y−1 of POC (10) and equals that of the next eight largest rivers of the world combined (11). Although relatively dilute compared with other rivers (12), this mixture of dissolved and particulate nitrogen, phosphate, silica, and iron that is delivered to the ocean stimulates marine microbial activity and affects both primary productivity and carbon sequestration at a global scale (13). Here, a metaomics methodology benchmarked with internal standards (14) was used to assemble, to our knowledge, the first www.pnas.org/cgi/doi/10.1073/pnas.1402782111
The microbial community of the Amazon River Plume determines the fate of the world’s largest input of terrestrial carbon and nutrients to the ocean. By benchmarking with internal standards during sample collection, we determined that each liter of plume seawater contains 1 trillion genes and 50 billion transcripts from thousands of bacterial, archaeal, and eukaryotic taxa. Gene regulation by taxa inhabiting distinct microenvironments provides insights into micron-scale patterns of transformations in the marine carbon, nitrogen, phosphorus, and sulfur cycles in this globally important ecosystem. Author contributions: B.M.S., B.C.C., J.H.P., P.L.Y., and M.A.M. designed research; B.M.S., B.C.C., C.B.S., B.L.Z., M.D., and J.M. performed research; P.M.M. and V.J.C. contributed new reagents/analytic tools; B.M.S., B.C.C., C.B.S., S. Sharma, M.D., S. Sun, P.M.M., P.L.Y., and M.A.M. analyzed data; and B.M.S. and M.A.M. wrote the paper. The authors declare no conflict of interest. This article is a PNAS Direct Submission. Data deposition: The sequences reported in this paper have been deposited in the Sequence Read Archive, www.ncbi.nlm.nih.gov/sra [accession nos. SRP039390 (metagenomes), SRP037995 (nonselective metatranscriptomes), and SRP039544 (poly(A)-selected metatranscriptomes)]. 1
To whom correspondence should be addressed. Email:
[email protected].
This article contains supporting information online at www.pnas.org/lookup/suppl/doi:10. 1073/pnas.1402782111/-/DCSupplemental.
PNAS | July 29, 2014 | vol. 111 | no. 30 | 11085–11090
ENVIRONMENTAL SCIENCES
We investigated expression of genes mediating elemental cycling at the microspatial scale in the ocean’s largest river plume using, to our knowledge, the first fully quantitative inventory of genes and transcripts. The bacterial and archaeal communities associated with a phytoplankton bloom in Amazon River Plume waters at the outer continental shelf in June 2010 harbored ∼1.0 × 10¹³ genes and 4.7 × 10¹¹ transcripts per liter that mapped to several thousand microbial genomes. Genomes from free-living cells were more abundant than those from particle-associated cells, and they generated more transcripts per liter for carbon fixation, heterotrophy, nitrogen and phosphorus uptake, and iron acquisition, although they had lower expression ratios (transcripts·gene−1) overall. Genomes from particle-associated cells contributed more transcripts for sulfur cycling, aromatic compound degradation, and the synthesis of biologically essential vitamins, with an overall twofold up-regulation of expression compared with free-living cells. Quantitatively, gene regulation differences were more important than genome abundance differences in explaining why microenvironment transcriptomes differed. Taxa contributing genomes to both free-living and particle-associated communities had up to 65% of their expressed genes regulated differently between the two, quantifying the extent of transcriptional plasticity in marine microbes in situ. In response to patchiness in carbon, nutrients, and light at the micrometer scale, Amazon Plume microbes regulated the expression of genes relevant to biogeochemical processes at the ecosystem scale.
Particle - Associated
Free-Living
transcripts L-1 versus transcripts L-1 Transcript Inventories
transcripts gene versus transcripts gene
% of taxon transcriptome versus % of taxon transcriptome
Gene Expression Ratios
Environmental RNA-Seq
Fig. 1. Sampling and calculation strategies for gene expression analyses. Maroon text indicates calculations for FL cells and green text for PA. Approaches to expression analysis are indicated in boxes, with the first two making use of internal gene and transcript standards.
S1), leading to estimates of prokaryotic gene and transcript numbers per liter of seawater of ∼1 × 10¹³ and 5 × 10¹¹ (Table 1). Two independent measures of prokaryotic cell abundance provided a check on quantitation from internal standard recoveries. First, flow cytometric counting indicated 5.8 × 10⁹ cells·L−1 at this station, whereas standard-normalized metagenomic read counts estimated 3.6 × 10⁹ cells·L−1 (Table 2). Second, direct microscopic counts of phycoerythrin- and chlorophyll-a fluorescing cells indicated 6.9 × 10⁸ cells·L−1 for Synechococcus (16), whereas calculated genome equivalents based on standard-normalized metagenomic data were 6.8 × 10⁸ cells·L−1 (Table 2). Natural History of Amazon Plume Prokaryotes. Protein sequence comparisons against reference genomes indicated that the prokaryotic assemblage was dominated by Cyanobacteria in the Synechococcaceae family and heterotrophic bacteria in the Gammaproteobacteria, Bacteroidetes, and Alphaproteobacteria. The average percentage identity between the metagenomic reads and the reference proteins they binned to ranged from 62% to 92% for the dominant taxa (Table 2). About 0.1% of metagenomic reads contained 16S rRNA gene fragments, and the taxonomic distribution of these matched the metagenomic protein binning and the patterns of PCR-amplified 16S rRNA genes (SI Appendix, Fig. S1).
Prokaryotic genes in the Amazon Plume were present in higher copy number than the mRNAs produced from them. This is consistent with earlier studies of Escherichia coli (17) and marine bacterioplankton (18, 19) and reflects a small and dynamic mRNA pool in environmental cells. Genes were split 68%/32% between the FL and PA fractions, and transcripts were split 49%/51%. Thus, per-gene expression levels were twofold greater for PA cells than FL cells (Table 1), a finding in line with previous reports of higher rates of growth and enzymatic activity for attached cells (6). Approximately 99% of prokaryotic genes and transcripts were bacterial and ∼1% were archaeal. The compositional difference between FL and PA prokaryotes was small at station 10. Although disruption of the microspatial structure during sampling could homogenize the communities, samples collected identically from other stations had distinct compositional differences between microenvironments (SI Appendix, Fig. S2). There were also substantial differences in transcription patterns between size fractions within a single genome bin at this station (SI Appendix, Fig. S3). Transcript Inventories of Biogeochemically Relevant Genes. Transcript abundance per liter of seawater (Fig. 1) was determined for prokaryotic genes involved in transport, fixation, and metabolism of C, N, P, and S (SI Appendix, Table S2). Counts ranged from near the detection limit at ∼105 transcripts·L−1 for phosphonate utilization gene phnG up to ∼2 × 10⁹ transcripts·L−1 for proteorhodopsin (Fig. 2). Most genes had higher transcript counts in the FL microenvironment (Fig. 2) due in part to the greater abundance of FL genomes (Table 2). These included genes involved in heterotrophic C metabolism (12 of 15), phototrophy (5 of 10), N cycling (5 of 7), P cycling (10 of 15), and motility (5 of 5). Only a few genes had transcript inventories biased toward the PA community; these included vitamin B6 biosynthesis gene pdxH; S cycling genes cysI, soxB, and dmdA; and aromatic ring cleavage gene pcaH (Fig. 2). Summing across genes with related functions, a liter of seawater at this plume station contained more transcripts mediating C and N cycling originating from genomes of FL cells but more transcripts for vitamin biosynthesis and S cycling from PA cells. Expression Ratios of Biogeochemically Relevant Genes. A different calculation approach scaled transcript copies to gene copies (transcripts·gene−1) to ask whether the same gene is differentially regulated in the two microenvironments (Fig. 1). Heterotrophic C transformation genes were up-regulated in genomes of PA cells compared with those from FL cells (Fig. 3), including genes for the catabolism of aminopeptidases (pepA,L,M), glycolysis (GAPDH),
Table 1. Metagenome and metatranscriptome datasets from Amazon River Plume station 10 in June 2010 0.2–2.0 μm size fraction*
Metatranscriptomes Parameter Total reads Paired reads† Genes or transcripts·L−1 Bacterial Archaeal Eukaryotic Viral Expression Ratio Bacterial Archaeal Eukaryotic Viral
ACM11
≥2.0 μm size fraction
Metagenomes
ACM29
ACM4
Metatranscriptomes
ACM36
ACM12
Poly(A)-selected metatranscriptomes
Metagenomes
ACM30
ACM3
ACM37
3.22 × 10⁷ 2.04 × 10⁷ 1.32 × 10⁷ 1.44 × 10⁷ 4.22 × 10⁷ 3.08 × 10⁷ 1.22 × 10⁷ 4.66 × 10⁶ 5.39 × 10⁶ 3.70 × 10⁶ 4.66 × 10⁶ 1.33 × 10⁶ 5.08 × 10⁶ 5.36 × 10⁶ 4.21 × 10⁶ 1.31 × 10⁶ 1.60 1.75 1.25 7.88
× × × ×
1011 109 1010 109
2.89 2.92 2.49 3.92
× × × ×
1011 109 1010 1010
6.43 7.33 1.46 8.01
× × × ×
1012 1010 1011 1011
6.12 6.18 5.96 6.71
× × × ×
1012 1010 1011 1011
9.51 1.31 5.42 6.70
× × × ×
1010 109 1010 109
0.034 0.033 0.048 0.030
3.82 1.56 1.03 5.90
× × × ×
1011 109 1012 1010
3.45 3.28 3.55 5.99
0.075 0.046 0.755 0.072
× × × ×
1012 1010 1011 1011
2.59 2.61 1.01 2.73
× × × ×
ACM8
ACM27
3.66 × 10⁷ 4.46 × 10⁷ 1.16 × 10⁷ 8.05 × 10⁶
1012 — — 1010 — — 1012 5.40 × 10¹⁰ 2.57 × 10⁹ 1011 — — — — — —
Per liter calculations are based on recovery of internal standards (SI Appendix, Table S1). *Replicate samples analyzed for each size fraction and data type are shown. Post-quality control sequences.
†
11086 | www.pnas.org/cgi/doi/10.1073/pnas.1402782111
Satinsky et al.
Table 2. Contribution of the most abundant prokaryotic taxa (out of 2,999 total) to Amazon Plume metagenomes and metatranscriptomes
Genome bin Synechococcus sp. CB0205 Candidatus Pelagibacter sp. HTCC7211 Gammaproteobacterium HTCC2080 Synechococcus sp. CB0101 Gammaproteobacterium NOR51-B Synechococcus sp. RS9916 Muricauda ruestringensis DSM13258 Gammaproteobacterium HTCC2148 Fluviicola taffensis DSM 16823 Haliscomenobacter hydrossis DSM1100 Kordia algicida OT-1 Gammaproteobacterium IMCC3088 Gammaproteobacterium HTCC2207 Zobellia galactanivorans Erythrobacter litoralis HTCC2594 Total
Genes per L
PA PA Genes in Genome genes, % of total reference equivalents % of cell Protein % Transcripts transcripts, % of total % genes genome per L count* identity per L % transcripts
1.60 × 10¹² 3.62 × 10¹¹
39.09 30.99
15.96 3.63
2,719 1,447
5.87 × 10⁸ 2.50 × 10⁸
10.13 4.31
89.5 75.9
1.90 × 10¹⁰ 2.07 × 10⁹
16.7 52.8
7.36 0.80
2.51 × 10¹¹
27.72
2.53
3,185
7.89 × 10⁷
1.36
71.2
8.25 × 10⁹
30.9
3.20
1.50 × 10¹¹ 1.48 × 10¹¹
40.69 27.90
1.50 1.49
3,010 2,930
4.98 × 10⁷ 5.05 × 10⁷
0.86 0.87
87.8 70.7
2.83 × 10⁹ 7.18 × 10⁹
19.5 34.7
1.10 2.78
1.24 × 10¹¹ 9.81 × 10¹⁰
46.20 29.32
1.24 0.99
2,961 3,432
4.20 × 10⁷ 2.86 × 10⁷
0.72 0.49
83.9 69.3
2.91 × 10⁹ 3.46 × 10⁹
26.6 48.5
1.13 1.34
9.05 × 10¹⁰
29.29
0.91
3,827
2.37 × 10⁷
0.41
66.2
2.63 × 10⁹
35.6
1.02
7.55 × 10¹⁰
50.56
0.75
4,033
1.87 × 10⁷
0.32
64.4
7.23 × 10⁹
41.9
2.80
7.55 × 10¹⁰
49.87
0.75
6,858
1.10 × 10⁷
0.19
61.7
1.90 × 10⁹
48.2
0.74
7.46 × 10¹⁰ 6.52 × 10¹⁰
34.22 27.83
0.75 0.65
4,514 2,855
1.65 × 10⁷ 2.28 × 10⁷
0.29 0.39
67.5 67.6
1.91 × 10⁹ 1.98 × 10⁹
48.0 35.3
0.74 0.77
6.34 × 10¹⁰
27.14
0.64
2,388
2.66 × 10⁷
0.46
62.4
2.26 × 10⁹
23.7
0.88
6.29 × 10¹⁰ 6.27 × 10¹⁰
30.77 62.52
0.63 0.62
4,732s 3,011
1.33 × 10⁷ 2.08 × 10⁷
0.23 0.36
68.6 76.9
1.80 × 10⁹ 3.36 × 10⁹
44.6 45.3
0.70 1.30
4.87 × 108*
21.39
33.04
26.66
and aromatic compound metabolism (pcaH but not lignin-related vanA). Only one heterotrophy gene was significantly up-regulated in FL cells, and this mediates the degradation of cellular carbon reserves (phaZ) and does not contradict the higher organic C availability signal for PA cells. Up-regulated genes in PA prokaryotes also included those for synthesis of vitamin B6 (pdxH) and B1 (thiL) required for amino acid and central carbon metabolism (20, 21). Genes for uptake of siderophore-bound Fe and Fe+2 were upregulated in genomes from PA cells as well, possibly linked to the role of iron–sulfur clusters and heme in respiratory chains and TCA cycle enzymes. Thus, although PA prokaryotes contributed fewer transcripts to the water column, they were more transcriptionally active per gene in C heterotrophy than FL cells. Among nutrient acquisition genes, those encoding P uptake had the greatest differences in regulation between microenvironments. Low-affinity phosphate transporter pitA was up-regulated in the PA transcriptome, and high-affinity pstA was up-regulated in the FL transcriptome (Fig. 3). Together with the up-regulation of phosphonate transporter gene phnE by FL genomes, turnover of labile P in bulk seawater is predicted to be more rapid and competition more intense compared with particle microenvironments. For N cycle genes, differences in expression levels were smaller, and N availability status was therefore predicted to be more similar between microenvironments. An exception was a dissimilatory nitrate reductase homolog binning exclusively to Thaumarchaeota genomes and up-regulated in the FL fraction, although the function of the nirK homolog in Thaumarchaeota is uncertain (22). Expression ratios were higher in PA cells for genes that mediate organic and inorganic S metabolism, including dimethylsulfoniopropionate (DMSP) and sulfate. Thus, although nutrient concentrations at this station (0.2 μM NOx, 0.4 μM PO4) were high compared with more offshore regions of the plume, transcription patterns suggested microscale differences in their availability and Satinsky et al.
turnover. Genes associated with light harvesting were also expressed differently (Fig. 3); FL cells had higher expression of genes for autotrophic light utilization [photosynthesis and C fixation genes pufM, psbB, «-CA, and rbcL (type IA)], whereas PA cells had higher expression of photoheterotrophic light utilization (proteorhodopsin). FL prokaryotes also had higher expression ratios of flagellar genes (Fig. 3). Gene Abundance Versus Gene Regulation. Three reference genomes with high sequence coverage were used for taxon-specific determinations of whether genome abundance (genomes·L−1) or gene regulation (transcripts·gene−1) contributed more to differences in microenvironment transcriptomes. The potential complication that a genome bin was derived from different populations in each microenvironment was considered. However, analysis of percentage identity patterns for three housekeeping genes (rpoB, gyrB, and recA) indicated that although genomes may recruit more than one population, the relative population abundances did not differ substantively between FL and PA fractions for the Synechococcus sp. CB0205, Pelagibacter sp. HTCC7211, and gammaproteobacterium HTCC2070 bins (SI Appendix, Fig. S4). Regarding genome abundance differences, Synechococcus sp. CB0205-like populations had 1.6-fold fewer genomes·L−1 in the PA microenvironment. Regarding gene regulation differences, all metabolic pathways in CB0205 that exhibited significant differences in expression levels were down-regulated in PA cells compared with FL cells (62 pathways; Table 3). These included pathways related to autotrophy (photosynthesis, carotenoid biosynthesis, and C fixation), as well as biosynthesis of amino acids, fatty acids, and peptidoglycan (Table 3). At the individual gene level, a total of 516 were down-regulated in PA cells compared with FL (SI Appendix, Table S3). Among them were genes transcribed by picocyanobacteria when experiencing N limitation (ntcA; PNAS | July 29, 2014 | vol. 111 | no. 30 | 11087
ENVIRONMENTAL SCIENCES
Data are based on replicates ACM3, ACM4, ACM11, and ACM12, and size fractions are summed. *Genome equivalents for the 250 most abundant taxa (75% of prokaryotic genes) = 2.7 × 10⁹. The direct cell count at station 10 was 5.80 × 10⁹ cells·L−1.
4E+08
Heterotrophy
Nitrogen
Phosphorus
2E+08
1E+08
0E+00
pe pepA pe pL p p M pe epN p G P( A X) PD p H m gi e bg tF pc lA vaaH phnA phaC phaP a ph R aZ am amoA cp tB cphA h gl B n na A p ni A rK ph phnD ph nE phnG ph nH phnM phoA phoD phoU o pi X pp tA k pp 1 psk2 pstA pstC tS
Greater in FL Greater in PA
Transcripts L-1
3E+08
1E+08
2E+08
12.0E+08
3.2E+08
8.3E+08
2E+08
1E+08
Chemotaxis and Motility
Vitamins and Iron
1E+08
5E+07
rb c rb L ( c L IA (II ) )
P bc R h pu X pu fL ps fM cpbB cD
th iC th pd iL pdxH fe xJ c fe A o Ft B af r1 u af A uB
5E+07
fli C fli F fli m G ot m A o ch tB cheA cheB ch eR eW
0E+00
ap aprA r cy B cy sI ddsK dddD dmdQ sodA soxA xB
Greater in FL Greater in PA
Transcripts L-1
Sulfur
Tables S4 and S5). Stress-related functions (heat shock protein, acid tolerance protein, chaperones, and GST) and transporters (ammonium, amino acids, taurine, polyamine, and glycine betaine; SI Appendix, Fig. S5) were represented. Overall, genome abundance and gene regulation differences worked in opposite directions in the HTCC7211 and HTCC2080 bins; when averaged across the genome, cells assigned to these two heterotrophic taxa were less abundant by ∼2.5-fold but more transcriptionally active by ∼three- to fourfold when associated with particles (Fig. 4). A Prokaryotic Perspective on Amazon Plume Biogeochemistry. High rates of C fixation and a deficit of dissolved inorganic C in the water column (∼100 μmol·L−1) signaled a major system shift to net autotrophy at station 10, driven by release from light limitation and stimulation by river-derived nutrients. This hotspot of primary production was upstream of an area of high POC deposition (25), indicative of sequestration of new production in nearby continental slope sediments. Surface water was dominated by dense populations of coastal diatom species, suggesting substantial
1E+08
1E+08
Photoautotrophy and Phototrophy
2E+08
Fig. 2. Transcript inventories for biogeochemically relevant genes. Bars above the x axis indicate more transcripts contributed by the FL prokaryotes (maroon), and those below indicate more contributed by PA prokaryotes (green). Asterisks indicate significant differences between fractions. afu, iron transport; amoA, ammonium monooxygenase; amtB, ammonium transporter B; apr, adenosine-5′-phosphosulfate reductase; bchX, chlorophyll iron protein; bglA, beta-glucosidase; CA, carbonic anhydrases; che, chemotaxisrelated; cpcD, phycocyanin-associated linker polypeptide; cph, cyanophycinrelated; cysI, sulfite reductase; cysK, cysteine synthase; ddd, DMSP lyase; dmdA, DMSP demethylase; fecA, Fe dicitrate transporter; feoB, Fe(II) G protein-like transporter; fli, flagellar proteins; Ftr1, high affinity Fe(II) permease; GAPDH, glyceraldehyde-3-phosphate dehydrogenase; glnA, glutamine synthetase; metF, methylenetetrahydrofolate reductase; mot, flagellar motor; napA, nitrate reductase; nirK, nitrite reductase; pcaH, protocatechuate 3,4-dioxygenase (3,4PCD); pdx, vitamin B6 synthesis; pep, aminopeptidases; pgi, glucose-6-phosphate isomerase; pha, polyhydroxyalkanoate-related; phn, phosphonate assimilation; pho, alkaline phosphatase; pitA, low affinity PO4 transporter; ppk, polyphosphate kinase; PR, proteorhodopsin; psbB, photosystem II; pst, high affinity PO4 transporter; puf, photosynthetic reaction center; rbcL, ribulose 1,5-bisphosphate carboxylases/oxygenases; sox, sulfur oxidation; thi, thiamine synthesis; vanA, vanillate demethylase.
Heterotrophy
pepA pepL pepM pepN pepP(X) GAPDH pgi metF bglA pcaH vanA phaC phaP phaR phaZ amoA amtB cphA cphB glnA napA nirK
Nitrogen
phnD phnE phnH phnM phoA phoD phoU phoX pitA ppk1 ppk2 pstA pstC pstS
Phosphorus
aprA aprB cysI cysK dddD dddQ dmdA soxA soxB
Sulfur
fourfold down-regulated) and P limitation (pstS; sixfold downregulated) (23, 24). Only 23 individual genes were up-regulated in PA cells, including stress-related proteins (universal stress protein, peroxiredoxin, and glutaredoxin) and cell-wall–modifying proteins (SI Appendix, Fig. S5 and Table S3). Overall, the transcriptome of CB0205-like cells was affected equally and in the same direction by genome abundance and gene regulation factors; when averaged across the genome, PA genes were less abundant by ∼1.6-fold and less transcriptionally active by ∼1.6-fold (Fig. 4 and SI Appendix, Fig. S5). The two heterotrophic taxa likewise had lower abundance of PA genomes (2.2-fold for Pelagibacter sp. HTCC7211 and 2.6fold for gammaproteobacterium HTCC2080; Fig. 4) but different gene regulation patterns compared with the Synechococcus bin. For HTCC7211, all metabolic pathways with differences in expression levels (39 pathways) were up-regulated in PA compared with FL cells (Table 3), including amino acid, nucleic acid, carboxylic acid, C1 compound, and taurine metabolism pathways (Table 3). For gammaproteobacterium HTCC2080, 31 metabolic pathways were up-regulated in PA cells, including carboxylic and fatty acid metabolism and siderophore production, whereas three were down-regulated, including flagellar assembly (Table 3). At the individual gene level, HTCC7211 had 84 genes up-regulated in PA compared with FL cells, and HTCC2080 had 44 (SI Appendix, 11088 | www.pnas.org/cgi/doi/10.1073/pnas.1402782111
fliC fliF fliG motA motB cheA cheB cheR cheW
Chemotaxis and Motility
Vitamins and Iron
thiC thiL pdxH pdxJ fecA feoB Ftr1 afuA afuB PR
Photoautotrophy bchX pufL and Phototrophy pufM psbB cpcD
rbcL (IA) 10
10
10
1
0
10
Transcripts L-1 / Genes L-1
Fig. 3. Gene expression ratios of biogeochemically relevant genes. Dotted lines indicate the average expression ratio for all genes in each size fraction. Maroon, FL; green, PA. Asterisks indicate significant differences between size fractions. Gene abbreviations are as in the Fig. 2 legend.
Satinsky et al.
Pathway
Description
ko00010 Glycolysis/gluconeogenesis ko00030 Pentose phosphate pathway ko00051 Fructose, mannose metabolism ko00071 Fatty acid metabolism ko00190 Oxidative phosphorylation ko00195 Photosynthesis ko00196 Photosynthesis–antenna ko00230 Purine metabolism ko00240 Pyrimidine metabolism ko00253 Tetracycline biosynthesis ko00260 Glycine, serine, threonine metabolism ko00280 Val, leu, isoleu degradation ko00310 Lysine degradation ko00330 Arginine, proline metabolism ko00340 Histidine metabolism ko00360 Phenylalanine metabolism ko00380 Tryptophan metabolism ko00430 Taurine metabolism ko00480 Glutathione metabolism ko00500 Starch, sucrose metabolism ko00521 Streptomycin biosynthesis ko00523 Polyketide biosynthesis ko00620 Pyruvate metabolism ko00630 Glyoxylate, dicarboxylate metabolism ko00640 Propanoate metabolism ko00650 Butanoate metabolism ko00670 One carbon pool by folate ko00710 Carbon fixation ko00730 Thiamine metabolism ko00740 Riboflavin metabolism ko00760 Nicotinate metabolism ko00770 Pantothenate, CoA biosynthesis ko00780 Biotin metabolism ko00790 Folate biosynthesis ko00860 Porphyrin, chlorophyll metabolism ko00910 Nitrogen metabolism ko00920 Sulfur metabolism ko01053 Biosynthesis siderophore NRPs ko01055 Biosyntheis Vancomycin ko02020 Two-component systems ko02040 Flagellar assembly ko03030 DNA replication ko03060 Protein export ko03430 Mismatch repair ko03440 Homologous recombination
CB0205 HTCC7211 HTCC2080 FL FL FL
FL FL FL FL FL FL
PA
PA PA
PA PA PA
PA PA
PA PA
PA PA PA
PA FL FL FL FL
PA
PA
PA PA
PA PA
FL FL FL FL FL FL FL
PA PA
PA PA
PA FL
PA PA
PA FL FL FL FL FL FL FL
PA
PA PA
FL FL FL
PA PA
FL FL
PA PA
PA
PA
PA PA PA
FL FL
PA
FL FL FL FL
PA PA PA PA
PA FL PA
Within this matrix of marine and terrestrial organic matter, the up-regulation of photosynthesis genes in FL cells of the dominant prokaryotic primary producers in the Synechococcus clade (Fig. 3 and SI Appendix, Fig. S6) accords with their higher abundance in FL microenvironments in this study (Table 2) and others (2). Synechococcus transcription patterns also suggested greater nutrient competition when free living based on N and P stress genes ntcA and pstS, and this may reflect higher nutrient demand in support of photosynthetic activity as well as lower nutrient availability to cells in the FL microenvironment. Expression of nitrate and nitrite transporters in both microenvironments indicated that Synechococcus competed with eukaryotic primary producers for riverine-derived N (Table 3 and SI Appendix, Table S3). Although the ∼1-μm–diameter cells are not typically thought to sink efficiently in the ocean, some studies suggest that picophytoplankton indeed contribute to deep flux in proportion to their biomass (4, 26). At this outer plume station, picocyanobacteria accounted for ∼12% of prokaryotic cells (∼109·L−1) (Table 2), a value at the upper range for coastal oceans. In contrast, the photoheterotrophic prokaryotes showed higher expression ratios of light-capturing proteorhodopsin in the particle microenvironment (Fig. 3), with transcripts dominated by Flavobacteria and SAR116. The SAR11 HTCC7211 bin differed from this pattern in having similar proteorhodopsin expression ratios in both microenvironments (1.0 and 0.8 transcripts·gene−1), and previous studies agree that SAR11 proteorhodopsin genes are not highly regulated (27). Aerobic anoxygenic phototrophy appeared insignificant here, given gene counts and expression ratios ∼2 orders of magnitude lower for bchX, pufL, and pufM compared with proteorhodopsin and the oxygenic photosynthesis genes (Fig. 3). Overall, transcription patterns suggest that micrometer-scale heterogeneity within a single water depth influences the rates and location of prokaryotic phototrophic activity. A persistent question in microbial biogeochemistry is whether the typically higher activity of less abundant PA cells outweighs the typically lower activity of more abundant FL cells in mediating biogeochemical transformations (2, 6). For the 74 biogeochemically relevant genes assayed here, there were five answers to the question (Fig. 5). One gene class was up-regulated sufficiently strongly in PA cells (∼fivefold greater than in FL) that they dominated the community transcriptome despite fewer genomes in this microenvironment; this group included functions related to S cycling, vitamin biosynthesis, and aromatic compound degradation. Another gene class was significantly up-regulated in PA cells, but the fold difference (three- to fourfold) was insufficient to overcome genome abundance differences and the community transcriptomes had statistically indistinguishable representation; this group included genes for Fe acquisition, P storage, S transformation, and vitamin biosynthesis. For the three remaining outcomes, significantly more transcripts were contributed by cells in the FL microenvironment. These consisted of a gene group upregulated in PA cells but at fold differences insufficient to make up for the greater number of FL genomes (∼1.5- to twofold; proteorhodopsin, C heterotrophy, and other Fe and S genes), a group with no difference in expression ratios but for which there were more transcripts produced by the more numerous FL cells (phosphate and phosphonate acquisition genes), and a group up-regulated in FL prokaryotes (∼threefold greater than in PA) and dominating
PA PA 5
contributions by these cells to the particulate material. Indeed, phytoplankton C accounted for ∼80% of POC (676 μg·C·L−1 estimated from cell count and biovolume measures, compared with 842 μg·C·L−1 total POC), in agreement with δ13C analysis and terrestrial biomarker concentrations (triterpenoids, C29sterols, isoprenoids, and selected sugars) that suggested only 10–20% terrestrial POC. Satinsky et al.
Fold-Difference in Transcripts L-1 (PA/FL)
FL, greater in FL cells; PA, greater in PA cells.
4
Due to genome abundance Due to gene regulation
3 2 1 0 -1 -2 -3
CB0205
HTCC7211
HTCC2080
Fig. 4. Role of cell abundance versus gene regulation in the differential contribution of PA cells to the Amazon Plume metatranscriptome.
PNAS | July 29, 2014 | vol. 111 | no. 30 | 11089
ENVIRONMENTAL SCIENCES
Table 3. Selected pathways from the Kyoto Encyclopedia of Genes and Genomes database with different expression ratios (transcripts·gene−1) between microenvironments for Synechococcus sp. CB0205, Pelagibacter sp. HTCC7211, and Gammaproteobacterium HTCC2080
More Transcripts L-1 in FL
8.0
rbcL
Transcripts Gene-1 (log2 fold-difference)
Upregulated in FL
4.0
-CA phoX 2.0
ppk2 napA bglA 0.3
1.0
0.5
pstS
Upregulated in PA
amtB
2.0
phaP
4.0
pitA
PR Ftr1 feoB aprA amoA pepL GAPDH phoD motB pepM pepA
0.5
cysI thiL
phnE
pufM
phaZ
phnD fliF fliG motA phoU psbB pstA pdxJ fliC
ppk1
More Transcripts L-1 in PA
pcaH
nirK
afuA afuB cysK glnA pepN pgi pstC
8.0
phaC phoA pstC thiC vanA metF pepP(X)
fecA 0.3 dmdA soxB pdxH dddD 0.1
Transcripts L-1 (log2 fold-difference)
Fig. 5. Outcome of differential transcript inventories and expression ratios for biogeochemically relevant genes. Inventory ratios are plotted on the x axis and gene expression ratios on the y axis. Green symbols, genes upregulated in the PA fraction and in greater abundance in the PA community (circles), no difference in abundance between PA and FL communities (triangles), or greater abundance in the FL community (diamonds). Gray symbols, genes not up-regulated in either fraction, but in greater abundance in the FL community. Maroon symbols, genes both up-regulated and more abundant in the FL community. Gene abbreviations are as in the Fig. 2 legend.
abundance of each taxon’s genome but also by the regulation of its genes. By benchmarking with internal standards, differences in gene regulation were determined to be more important than differences in genome counts in explaining transcriptome composition at this Amazon Plume station. Up to 65% of the genes in individual taxa exhibited significantly different expression when FL and PA cells were compared (Fig. 4); on average, PA cells had twice as many transcripts as FL cells (Table 1); and expression of biogeochemically relevant genes varied by up to sixfold between the microenvironments (Fig. 3). With the important caveat that mRNA abundance cannot be interpreted as a proxy for elemental flux (19), we hypothesize that the FL prokaryotic community contributed more to C fixation, heterotrophy, N and P uptake, and iron acquisition than the PA community in this ecosystem, whereas the PA community contributed more to S cycling, aromatic compound degradation, and the synthesis of biologically essential vitamins. The scale of spatial heterogeneity relevant to ecological processes (1) is indeed at the micrometer level in this ecosystem, with patchiness in abundance and regulation of prokaryotic genes within a single water mass signaling the partitioning of functions that drive elemental cycling. Materials and Methods Surface seawater was collected ∼500 km north of the Amazon River mouth in June 2010. Two size fractions were obtained by sequential filtration of 156 μm prefiltered water through 2.0 μm and 0.2 μm pore size membrane filters. Duplicate metagenomes and metatranscriptomes were obtained from each fraction as 2 × 150 bp reads. Internal standards were added immediately before cell lysis in known copy numbers (SI Appendix, Table S1). Assignment of reads to taxonomic bins and functions was based on Blastx searches against RefSeq or a custom database of 74 selected genes. Detailed sample collection, processing, and statistical analysis methods can be found in SI Appendix, Supplemental Methods.
the community transcriptome (up to 10-fold; CO2 fixation, motility, and P acquisition; Fig. 5). The importance of microspatial partitioning of microbial activities in the ocean was first suspected based on differences in taxonomic composition between FL and PA cells (8) and later supported by analysis of gene inventories (2, 3). At the transcriptome level, contributions are determined not just by the
ACKNOWLEDGMENTS. We appreciate the help of A. Burd, E. Carpenter, A. Mehring, C. English, J. Mrazek, and R. Nilsen. Resources were provided by the University of Georgia’s Georgia Advanced Computing Resource Center and the Community Cyberinfrastructure for Advanced Microbial Ecology Research and Analysis. This work was funded in part by the Gordon and Betty Moore Foundation through Grants GBMF2293 and GBMF2928 and National Science Foundation Grant OCE-0934095.
1. Azam F, Malfatti F (2007) Microbial structuring of marine ecosystems. Nat Rev Microbiol 5(10):782–791. 2. Ganesh S, Parris DJ, DeLong EF, Stewart FJ (2014) Metagenomic analysis of sizefractionated picoplankton in a marine oxygen minimum zone. ISME J 8(1):187–211. 3. Smith MW, Zeigler Allen L, Allen AE, Herfort L, Simon HM (2013) Contrasting genomic properties of free-living and particle-attached microbial assemblages within a coastal ecosystem. Front Microbiol 4:120. 4. Kiorboe T, Jackson GA (2001) Marine snow, organic solute plumes, and optimal chemosensory behavior of bacteria. Limnol Oceanogr 46(6):1309–1318. 5. Stocker R, Seymour JR, Samadani A, Hunt DE, Polz MF (2008) Rapid chemotactic response enables marine bacteria to exploit ephemeral microscale nutrient patches. Proc Natl Acad Sci USA 105(11):4209–4214. 6. Crump BC, Baross JA, Simenstad CA (1998) Dominance of particle-attached bacteria in the Columbia River estuary, USA. Aquat Microb Ecol 14(1):7–18. 7. Karner M, Herndl GJ (1992) Extracellular enzymatic-activity and secondary production in free-living and marine-snow-associated bacteria. Mar Biol 113(2):341–347. 8. Delong EF, Franks DG, Alldredge AL (1993) Phylogenetic diversity of aggregateattached vs free-living marine bacterial assemblages. Limnol Oceanogr 38(5):924–934. 9. Hopkinson CS, Sherr B, Wiebe WJ (1989) Size fractionated metabolism of coastal microbial plankton. Mar Ecol Prog Ser 51(1-2):155–166. 10. Richey JE, et al. (1990) Biogeochemistry of carbon in the Amazon River. Limnol Oceanogr 35(2):352–371. 11. Coles VJ, et al. (2013) The pathways and properties of the Amazon River Plume in the tropical North Atlantic Ocean. J Geophys Res-Oceans 118(12):6894–6913. 12. Ryther JH, Menzel DW, Corwin N (1967) Influence of the Amazon River outflow on the ecology of the western tropical Atlantic. J Mar Res 25(1):69–83. 13. Subramaniam A, et al. (2008) Amazon River enhances diazotrophy and carbon sequestration in the tropical North Atlantic Ocean. Proc Natl Acad Sci USA 105(30): 10460–10465. 14. Satinsky BM, Gifford SM, Crump BC, Moran MA (2013) Use of internal standards for quantitative metatranscriptome and metagenome analysis. Meth Enzymol, ed DeLong EF (Academic, Burlington, MA), Vol 531, pp 237–250.
15. Whitman WB (2009) The modern concept of the procaryote. J Bacteriol 191(7): 2000–2005, discussion 2006–2007. 16. Goes JI, et al. (2014) Influence of the Amazon River discharge on the biogeography of phytoplankton communities in the western tropical north Atlantic. Prog Oceanogr 120:29–40. 17. Taniguchi Y, et al. (2010) Quantifying E. coli proteome and transcriptome with singlemolecule sensitivity in single cells. Science 329(5991):533–538. 18. Church MJ, Wai B, Karl DM, DeLong EF (2010) Abundances of crenarchaeal amoA genes and transcripts in the Pacific Ocean. Environ Microbiol 12(3):679–688. 19. Moran MA, et al. (2013) Sizing up metatranscriptomics. ISME J 7(2):237–243. 20. Fitzpatrick TB, et al. (2007) Two independent routes of de novo vitamin B6 biosynthesis: Not that different after all. Biochem J 407(1):1–13. 21. Koenigsknecht MJ, Downs DM (2010) Thiamine biosynthesis can be used to dissect metabolic integration. Trends Microbiol 18(6):240–247. 22. Hollibaugh JT, Gifford S, Sharma S, Bano N, Moran MA (2011) Metatranscriptomic analysis of ammonia-oxidizing organisms in an estuarine bacterioplankton assemblage. ISME J 5(5):866–878. 23. Lindell D, Post AF (2001) Ecological aspects of ntcA gene expression and its use as an indicator of the nitrogen status of marine Synechococcus spp. Appl Environ Microbiol 67(8):3340–3349. 24. Scanlan DJ, Mann NH, Carr NG (1993) The response of the picoplanktonic marine cyanobacterium Synechococcus species WH7803 to phosphate starvation involves a protein homologous to the periplasmic phosphate-binding protein of Escherichia coli. Mol Microbiol 10(1):181–191. 25. Chong LS, et al. (2014) Carbon and biogenic silica export influenced by the Amazon River Plume: Patterns of remineralization in deep-sea sediments. Deep Sea Res Part I Oceanogr Res Pap 85:124–137. 26. Close HG, et al. (2013) Export of submicron particulate organic matter to mesopelagic depth in an oligotrophic gyre. Proc Natl Acad Sci USA 110(31):12565–12570. 27. Steindler L, Schwalbach MS, Smith DP, Chan F, Giovannoni SJ (2011) Energy starved Candidatus Pelagibacter ubique substitutes light-mediated ATP production for endogenous carbon respiration. PLoS ONE 6(5):e19725.
11090 | www.pnas.org/cgi/doi/10.1073/pnas.1402782111
Satinsky et al.
Supplemental Methods: Sample Collection Duplicate surface samples were collected from the Amazon River plume aboard the R/V Knorr in June 2010 (4 52.71’N, 51 21.59’W) during a period of high river discharge. The collection site (Station 10, 4° 52.71’N, 51° 21.59’W; S = 21.0; T = 29.6°C), located ~ 500 Km to the north of the Amazon River mouth, was characterized by the presence of coastal diatoms in the top 8 m of the water column. Sampling was conducted between 0700 and 0900 local time by gently impeller pumping (modified Rule 1800 submersible sump pump) surface water through 10 m of tygon tubing (3 cm) to the ship's deck where it then flowed through a 156 µm mesh into 20 L carboys. In the lab, cells were partitioned into two size fractions by sequential filtration (using a Masterflex peristaltic pump) of the pre-filtered seawater through a 2.0 µm pore-size, 142 mm diameter polycarbonate (PCTE) membrane filter (Sterlitech Corporation, Kent, CWA) and a 0.22 µm pore-size, 142 mm diameter Supor membrane filter (Pall, Port Washington, NY). Metagenomic and non-selective metatranscriptomic analyses were conducted on both pore-size filters; poly(A)-selected (eukaryote-dominated) metatranscriptomic analyses were conducted only on the larger pore-size filter (2.0 µm pore-size). All filters were immediately submerged in RNAlater (Applied Biosystems, Austin, TX) in sterile 50 mL conical tubes, o incubated at room temperature overnight and then stored at -80 C until extraction. Filtration and stabilization of each sample was completed within 30 min of water collection. Additionally, samples were collected and preserved for flow cytometry. After staining with 1X SYBR Green II and incubating in the dark for at least 10 minutes, samples were analyzed using a Beckman Coulter Cyan flow cytometer with an excitation wavelength of 488nm and emission detection filter of 530nm. Bacterial cells were quantified using a combination of light scatter and fluorescence detection with a bead standard of known concentration used to calculate the volume counted by the machine. Total Community RNA Processing for Metatranscriptomes Prior to RNA extraction, the filters were thawed, removed from the preservative solution, placed in Whirl® Pak bags (Nasco, Fort Artkinson, WI), and flash-frozen in liquid nitrogen. RNA extraction and DNA removal were carried out as previously described (1-3). In brief, a lysis tube was prepared for each sample consisting of a sterile 50 mL conical tube containing 8 mL of RLT Lysis Solution (Qiagen, Valencia, CA), 3 grams of RNA PowerSoil beads (Mo-Bio, Carlsbad, CA), and internal standards (described below). Filters inside the bags were broken into small pieces using a rubber mallet and transferred to the lysis tubes. Tubes were vortexed for 10 min to lyse cells, and RNA was purified from cell lysate using an RNeasy Kit (Qiagen, Valencia, CA) followed by two successive treatments with the Turbo DNA-free kit (Invitrogen, Carlsbad, CA) to completely remove residual DNA. Ribosomal RNA (rRNA) was selectively removed using community-specific biotinylated-rRNA probes prepared with DNA from a sample collected simultaneously (4). To maximize the removal of rRNA, probes were created for Bacterial and Archaeal 16S and 23S rRNA and Eukaryotic 18S and 28S rRNA. Probe-bound rRNA was removed via hybridization to streptavidin-coated magnetic beads (New England Biolabs, Ipswich, MA), and successful removal of rRNA from the samples was confirmed using either an Experion automated electrophoresis system (Bio-Rad Laboratories, Hercules, CA) or a Bioanalyzer (Agilent Technologies, Santa Clara, CA). rRNA-depleted samples were linearly amplified using the MessageAmp II-Bacteria Kit (Applied Biosystems, Austin, TX), and amplified mRNA was converted into cDNA using the Superscript III First Strand synthesis system (Invitrogen, Carlsbad, CA) with random primers, followed by the NEBnext mRNA second strand synthesis module (New England Biolabs, Ipswich, MA), both according to manufacturer protocols. Synthesized cDNA was purified using the QIAquick PCR purification kit (Qiagen, Valencia, CA) followed by o EtOH precipitation, resuspended in 100 µL of TE buffer and stored at -80 C until library preparation for sequencing. Poly(A)-tail Selected RNA Processing for Metatranscriptomes To ensure sufficient coverage of eukaryotic transcriptomes, a second metatranscriptome protocol was used that selectively sequenced messages with poly(A) tails; this was carried out for the >2.0 µm pore-size filter only. Samples were prepared as described above with the following exceptions. Each lysis tube was prepared with 9 mL of RLT Lysis Solution, 250 µL of zirconium beads (OPS Diagnostics, Lebanon, NJ, USA), and an internal poly(A)-tailed mRNA standard (see below). Following lysis, poly(A)-tailed mRNA was isolated from total RNA using an Oligotex mRNA kit (Qiagen, Valencia, CA), and mRNA was linearly amplified with a MessageAmp II-aRNA Amplification Kit (Applied Biosystems, Austin, TX). Double stranded cDNA was prepared as described above except without ethanol precipitation. DNA Processing for Metagenomes
DNA was extracted and purified as previously described (5-7) with some modification. Briefly, each filter was thawed, removed from the preservative solution, and rinsed three times in autoclaved, filter-sterilized, 0.1% phosphate-buffered saline (PBS) to remove any residual RNAlater. Each filter was shattered as described above and placed in a tube containing DNA extraction buffer [DEB: 0.1 M Tris-HCl (pH 8), 0.1 M Na-EDTA (pH 8), 0.1 M Na2H2PO4 (pH 8), 1.5 M NaCl, 5% CTAB]. All liquid from the rinses as well as the original RNAlater was pushed through a 0.2µm Sterivex-GP filter capsule (EMD Millipore, Billerica, MA), which was subsequently rinsed 3 times to salvage any lost cells. The capsule was opened and the filter sliced into pieces and added to the tube with the original membrane filter and an internal genomic DNA standard (described below). Following treatments with proteinase-K, lysozyme, and sodium dodecyl sulfate, DNA was purified via phenol:chloroform extraction and isopropanol precipitation. Sequencing cDNA and DNA was sheared ultrasonically to ~200-250 base pair fragments and TruSeq libraries (Illumina Inc., San Diego, CA) were constructed for paired-end (2 x 150) sequencing using the Illumina Genome Analyzer IIx sequencing platform (Illumina Inc., San Diego, CA). Internal Standards Omics processing included the addition of internal standards (8) to allow for calculation of volume-based -1 absolute copy numbers for each gene or transcript type, rather than just relative quantification (i.e., counts L rather than percent of sequence library). Two mRNA standards without poly(A) tails (to mimic prokaryotic and organelle mRNAs) were synthesized by in vitro transcription using a method modified from (1). The standards were constructed by linearizing a pTXB1 vector (New England Biolabs, Ipswich, MA) with NcoI restriction enzyme (New England Biolabs, Ipswich, MA) or pFN18A Halotag T7 Flexi Vector (Promega, Madison, WI) with BamHI restriction enzyme (New England Biolabs, Ipswich, MA). Each was purified by phenol:chloroform:isoamyl alcohol extraction and ethanol precipitation. The 5’ nucleotide overhangs were removed using Mung Bean Nuclease (New England Biolabs, Ipswich, MA), followed by purification via phenol:chloroform:isoamyl alcohol extraction and ethanol precipitation. Complete digestion of the vector was confirmed on a 1% agarose gel. The DNA fragment was then transcribed in vitro using the Riboprobe in vitro Transcription System (Promega, Madison, WI) according to the manufacturer’s protocol using a T7 RNA polymerase to create 916 nt (pTXB1 standard) or 970 nt (pFN18A) artificial transcripts. Residual DNA was removed using RQ1 RNase-Free DNase and the RNA was purified by phenol:chloroform:isoamyl alcohol extraction and ethanol precipitation. The RNA standards were quantified using the Quant-iT Ribogreen RNA Reagent and Kit (Invitrogen, Carlsbad, CA), and RNA nucleotide length was confirmed with an Experion automated electrophoresis system (Bio-Rad 10 Laboratories, Hercules, CA). A known number of each standard (pTXB1 = 2.104 x 10 copies; pFN18A = 1.172 10 x 10 copies) was added independently to each lysis tube immediately prior to the addition of the sample filter. An mRNA standard with a poly(A) tail (to mimic eukaryotic nuclear mRNA) was created from an HAP-1 Protelomerase viral gene. To create the standard, a 544 bp amplicon containing a poly(A) tail and a T7 promoter was produced from the template DNA through PCR. The PCR amplicons were then used as the template DNA for an in vitro transcription reaction to produce the resulting 499 nucleotide poly(A)-tailed mRNA. The addition of 9 2.0 x 10 copies of the standard occurred immediately prior to cell lysis. The genomic internal standard for metagenomic samples consisted of Thermus thermophilus DSM7039 [HB8] genomic DNA (American Type Culture Collection, Manassas, VA) added immediately prior to cell lysis. The amount of DNA standard added was estimated to be ~ 1% (8.4 ng per liter filtered) of sample DNA based on yields of DNA from a typical filter (Table S1). 16S and 18S rRNA tag sequencing DNA was PCR-amplified in four replicate 20 µl reactions using bacterial 16S ribosomal RNA gene primers. The bacteria-specific forward primer began at 27F in the V2 region and included a 454B FLX linker (GCCTTGCCAGCCCGCTCAG TC AGRGTTTGATYMTGGCTCAG). The reverse primer began at 338R and included a 454A linker and a unique 8 base pair barcode (denoted by N in primer sequence; GCCTCCCTCGCGCCATCAG NNNNNNN CA TGCWGCCWCCCGTAGGWGT) (Modified from (9)). Products from replicate amplifications were combined and purified with the S.N.A.P. UV-Free Gel Purification Kit (Invitrogen, Carlsbad, CA) by gel isolation from a 0.8% agarose gel. Purified samples were sent for pyrosequencing on a Roche-454 FLX Pyrosequencer at Engencore at the University of South Carolina using titanium chemistry (http://engencore.sc.edu/). Bioinformatics Following sequencing, paired-end Illumina reads were joined using the She-ra program (10) with the default parameters and a quality metric score of 0.5. Paired reads were trimmed using Seqtrim (11) with default settings. To remove rRNA, tRNA, and internal standard sequences from the metatranscriptome reads, a Blastn
search was performed against a database containing representative ribosomal RNA and tRNA sequences along with the internal standard sequences. All reads with a bit score greater >50 to one of the sequences in the database were removed (1). To remove internal standard sequences from the metagenome reads, a Blastn search against the T. thermophilus HB8 genome was carried out, and any hits from the metagenome sequences with a bit score >50 were queried against the RefSeq protein database using a Blastx search; hits matching Thermus thermophilus proteins with a bit score >40 were designated as internal standard. Reads representing genes or transcripts of 74 selected biogeochemically-relevant genes were identified using a Blastx search against a custom database consisting of multiple reference sequences from diverse taxa for each gene, along with paralogs having sequences most similar to the gene of interest. This gene-specific reference database was tested on a subset of Amazon reads using a bit score >40, and re-analysis of the positive reads against the RefSeq protein database was used to adjust the composition of the database. To obtain an estimate of error that was propagated through the calculations, a Poisson distribution was generated for each gene using the rpois function in R with the lamba parameter equal to the count of reads and 10,000 randomly sampled values returned. The Poisson distributions were converted to normalized count distributions -1 (copies L ) and then averaged together for replicate samples. The resulting distributions were used to calculate -1 -1 expression ratios for each gene by dividing the transcripts L distribution by the genes L distribution. Expression ratios between size fractions were considered significantly different when separated by 2 standard deviations. For comparison, a one-tailed statistical comparison was also performed using Welch’s T-test, an adaptation of the standard T-test for two samples with unequal variances. Of the 55 genes identified to have significantly different ratios based on 2 standard deviations of the Poisson distribution, 50 of these (91%) had pvalues of 0.1 or less with the Welsh’s T-test, while the remaining 5 had p-values of