signment plan. This study may contribute to create more robust performance in virtualized environment. 1 Introduction. Migration can shorten the job completion ...
Migration, Assignment, and Scheduling of Jobs in Virtualized Environment Seung-Hwan Lim⋆, Jae-Seok Huh† , Youngjae Kim†, and Chita R. Das⋆ ⋆ Pennsylvania State University, † Oak Ridge National Laboratory {seulim, das}@cse.psu.edu, {huhj, kimy1}@ornl.gov
Abstract Migration is an interesting issue for managing resource utilization and performance in clusters. Recent advances in server virtualization have made migration a practical method to achieve these goals. Especially, the live migration of virtualized servers made their pausing times negligible. However, migration of a virtual machine (VM) can slow down other collocated VMs in multiresource shared systems, where all the system resources are shared among collocated VMs. In parallel execution environment, such sudden slow-down phase of systems is called system noise; it may slow down overall systems while increasing the variability of system performance. When we consider the virtual machine assignment problem as resource allocation, those performance issues are hard to be properly treated. In this work, we address how to consider performance in assigning VMs. To achieve this goal, we model a migration process of a VM instance as a pair of jobs that run at the hosts of sender and receiver. We propose a method to analyze the migration time and the performance impact on multiresource shared systems for completing given VM assignment plan. This study may contribute to create more robust performance in virtualized environment.
1 Introduction Migration can shorten the job completion time by reassigning jobs to the underutilized machines [7]. However, the residual dependency problem with process migration hindered migrating jobs in practice [3]. By decoupling an operating system instance from underlying hardware, server virtualization allows migration with negligible down-time of a virtualized server, also known as live migration [3]. With this novel feature of migration, many virtual machine assignment schemes have been proposed to increase the resource utilization of servers so as to reduce the total cost of ownership [2, 4, 8]. Recently, researchers have realized that the virtual machine assignment problem accompanies the cost to reassign VMs ac-
cording to the optimal assignment [4]. Hermenier et.al., in [4] showed that it could take around 50 minutes to reassign 35 VMs from an overloaded assignment to an optimal assignment when NASGrid Benchmark is running on them. Although the time to complete assignment could depend on assignment algorithms, the time taken to assign all the VMs is an order of magnitude higher than migrating single VM. Therefore, this study addresses how to manage the time to complete the entire assignment process and performance impact. Prior work mostly concerns the virtual machine assignment problem as a resource allocation problem [2, 6, 8]. Thus, they have focused on estimating resource demands of VMs and increasing the resource utilization by employing various bin packing algorithms. One of the most popularly adopted algorithms is First Fit Decreasing algorithm, where the VM instances are sorted according to resource demands before assigning them into physical machines. Since (re-)assigning VMs involves migrations of VMs, researchers have studied individual migration cost [9] or total migration cost [4] during assigning virtual machines. Since VMs with sufficient resources may provide reasonable performance, we addressed the virtual machine assignment problem as the resource allocation problem. However, with current VM assignment schemes, we face the perception of unpredictable performance in virtualized environment [1]. Robust performance is critical to host jobs, especially, a large number of dependent jobs running on many virtual machines, such as MapReduce workloads and scientific workloads. One job with outliered completion time may affect the completion time of the entire workload due to the synchronization among all the dependent jobs. Performance with large variance stems from the fact that we assign virtual machines according to estimated resource demands instead of the estimated performance. Worse, the time to arrive at the optimal assignment incurs additional performance interferences with the workloads. Therefore, we
Sender Machine
VM
Sender
Domain-0 (CPU0, 1)
Migration in Sender
Receiver
VM VM2 (CPU0)
migration time = down time (a)
Sender VM
VM1* (CPU1)
Receiver Machine Domain-0 (CPU0, 1)
down time ~ 0
Receiver
Migration in Receiver
VM VM3 (CPU0)
migration time
VM1* (CPU1)
(b)
Figure 2: Experiment:VM∗1 migrates.
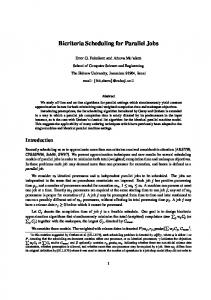
Figure 1: Illustrations of migration and down-time of non-live (a) and live (b) migrations. For live migrations, down-time cannot be a measure of the migration overhead and the effect on the system performance should be understood in terms of the additional workloads of sender and receiver processes.
Completion Rates (Jobs/sec)
45
need a performance-aware virtual machine assignment scheme. In this work, we discuss how to reduce the additional performance interference that comes from reassigning virtual machines. Migration involved in reassigning virtual machines can be considered as an auxiliary job to the system, which can not be seen from virtual machines. Thus, performance inteference with migration is unexpected and invisible cost to process workloads. Contributions in this work are as follows:
40
Migration Starts
Migration Ends
VM1* VM2 VM3
35 30 25 20 15 10 5 0 0.00 5.00 10.00 15.00 20.00 25.00 30.00 35.00 40.00 45.00 Time (sec)
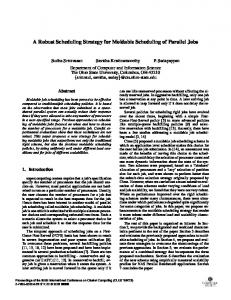
Figure 3: Job completion rates; VM∗1 represents the migrated VM, VM2 has remained in sender and VM3 has remained in receiver.
• We treat migration as a job in the system to analyze and measure the performance impact on the system due to migration. • We define the assignment cost – the total completion time to reassign virtual machines. • We provide a performance analysis method in shared service systems with multi resource contention, along with validation results. • We illustrate how to profile job characteristics and estimate assignment cost and performance impact due to migrations.
During a non-live migration, the migration time is considered to be identical to the down-time; a VM is paused first and resumes after all the required migration workloads are done. In a live migration, the situation is quite different; the suspension of the VM (hence, the downtime) is mostly negligible. However, the migration workloads still exist significantly during the migration time. Thus, the down-time becomes inappropriate for the measure of the migration overhead. Performance impact due to migration Let us discuss the performance impact on the system during migration time. We migrated VM∗1 from machine 1 (sender) to machine 2 (receiver) while VMs, VM∗1 , VM2 , and VM3 , are processing the same workload as shown in Figure 2. The experimental environment for this work is shown in Table 1. The performance impact of three VMs and CPU usage of each VM and domain-0 are shown in Figure 3 and Figure 4, respectively. During the migration period , we observe:
2 Analysis of Migration Cost Migration-time and Down-time For an appropriate description of migration overhead during live migrations, we need to clarify the difference between migration time and down-time. When a migration is issued, two migration processes – sender and receiver – should be initiated on a pair of physical machines. We assume that the duration of these two (temporary) processes are identical, i.e., they are synchronized. We call this time span the migration time, during which dumping, transfer, and reloading are completed. By down-time, we denote the duration of the suspension of a migrated VM (refer to Fig. 1).
• VMs in sender show lower job completion rates than that of receiver, due to the fact that sender has two workloads and receiver has one workload when mi2
CPU utilization (%)
VM1*
100 80 60 40 20 0
VM2
5.0
100 80 60 40 20 0
VM3
5.0
Dom-0(Sender)
CPU utilization (%)
CPU utilization (%)
100 80 60 40 20 0 100 80 60 40 20 0 100 80 60 40 20 0
10.0
15.0
20.0 25.0 30.0 Time (sec)
35.0 40.0 total
45.0 I/O
10.0
15.0
20.0 25.0 30.0 Time (sec)
35.0
40.0
45.0
20.0 25.0 30.0 Time (sec)
35.0 40.0 total
45.0 I/O
Dom-0(Receiver)
5.0
(a) CPU utilization of virtual machines
10.0
15.0
(b) CPU utilization of domain-0’s
Figure 4: Migration interferes with workloads on the migrated VM (VM∗1 ) and remained VMs (VM2 and VM3 ). Table 1: Experimental Environment.
Dom0
VM
35
Two single-core AMD Opteron 2.4GHz 4GB NFS 1Gbps Ethernet, 10Gbps Infiniband Xen 3.4.2 Linux 2.6.18 runs on both CPUs Linux 2.6.18 runs on one CPU varied from 256 to 2048MB tap:aio, bypasses the buffer cache of Dom0 compressing 2560 files of size 256KB
1G Ethernet, multiple 256MB RAM VMs 1G Ethernet, single VM 10G IBA, multiple 256MB VMs 10G IBA, single VM
30 Total migration time (sec)
System
CPU RAM Storage Network Hypervisor Kernel CPU Kernel CPU RAM I/O access mode Workload
25 20 15 10 5 0 0
1
gration is initiated. • CPU utilization of Domain-0 in sender is higher than that of receiver, which supports the above observation. • Job completion rate of VM2 follows that of VM∗1 that migrates, which means that migration competes for resources with all the VMs in the system.
1000 1500 2000 Total size of migrated memory (MB)
2500
3000
Figure 5: Migration time is proportional to the total migrated memory and the number of concurrently migrated virtual machines. migrations. Although the total size of migrated memory is dominant factor to the migration time, the network system also affects. In those experiments, we confirm that migration is a job that spends multiple resources. Thus, migration time is not sufficient to describe migration cost properly. We need to understand the performance of shared service systems with multiple resources, which is described in the following section.
Those observations support that migration is a job that competes for system resources with workloads. Let us find which resources are spent by migration. Migration consumes system resources We migrated idle VMs and analyzed which resources are the critical factor of migration time (Figure 5). Since migration transfers data in memory from the sender to the receiver, we varied the size of memory and experimented with two different network technology. Also, to find additional overheads, we migrated varing number of VMs with 256MB RAM. For the given hardware, we find that the completion time of migration depends on the total size of migrated memory and the number of concurrent migrations. The completion time of migration is linearly proportional to the total size of migrated memory with some additional overheads. The additional overheads are accumulated as we increase the number of concurrent 1 VM shows longer completion time because the overlapped 3 with VM∗1 and VM3 is longer than that of VM∗1 and VM2 .
500
3 Estimating Performance Impact and Assignment Cost The overheads of migration have two dimensions – time and performance impact. Let us denote the migration time by the time to complete an individual migration. Then, assignment cost can be defined by the total completion time to assign all the virtual machines according to given assignment plan. The performance impact falls into three categories – the performance impact on the sender and receiver during an individual migration, the performance impact on the migrating virtual machine,
period
3
Algorithm 1 Constructing the loading vector pj
and the performance impact on the system during reassigning virtual machines according to given assignment plan. Then, it is clear that our objective should be managing assignment cost and the performance impact on the system to complete the assignment of all the virtual machines, more formally,
1: Measure τ , the execution time of job j when it is the only
workload in the system. 2: Measure T , the expanded execution time of job j when 2
instances of job j are running concurrently in the�system. p
3: As to Equation 2, pj = 21 1 ± 1 − 2(2 − Tτ ) 4: Obtain the loading vector pj = (pj , 1 − pj ).
Definition 1 (The Virtual Machine Assignment Cost Problem) Consider a set of virtual machines {1, . . . , n}. Let a virtual machine v ∈ {1, . . . , n} have a size of pv and a migration g has a size of pg . Given the set of virtual machines to be migrated {i, . . . , j}, we want to minimize the assignment cost, T , with bounded performance variation, β, for reassigning them to a set of machines {1, . . . , m} according to the given assignment decision.
sec 500
15.8 % error
Measure without collocated jobs Measure with collocated jobs Estimation
450 400
378.15
350 300 250
Solving this problem incur challenges in determining job sizes, pv and pg , and estimating the assignment cost T and performance variation β since we have to consider those parameters in the context of shared service systems with multiple resources. We proceed to explain how to determine the job size pj of job j, assignment cost T and performance variation β. The performance model in shared service systems with multiple resources Since the time to complete a job is a primary performance metric, we propose a model to estimate the expanded execution time of jobs when they compete for multiple system resources. Due to the page limits, we explain a two-resource, two-job model. Refer to [5] for an m-resource, n-job model. Suppose that a system consists of only two resources, r1 and r2 . Let us assume that we know the probability of accessing those resources by two jobs, j1 and j2 , which can be represented by loading vector p1 = (p1 , 1 − p1 ) and p2 = (p2 , 1 − p2 ), where pi is the probability of accessing r1 by job i. Execution times will be expanded if two workloads access the same resource at the same time. The probability of accessing the same resource by two independent jobs is p1 p2 +(1−p1 )(1−p2 ). Thus, the expectations of expanded execution times of two competing jobs, Ti , are given by T1 = τ1 (1 + p1 p2 + (1 − p1 )(1 − p2 ))
(1a)
T2 = τ2 (1 + p1 p2 + (1 − p1 )(1 − p2 )) ,
(1b)
200 150 2.4 % error
100 43.43
50 0
File Only
File w/ Mail
Mail Only
Mail w/ File
Figure 6: Collocating two different workloads does not lead to linear performance degradation. Loading vectors for fileserver and mailserver are, pf = (0.02, 0.98) and pm = (0.10, 0.90), respectively. We can obtain τ by running one instance of job j and T by running two instances of job j. Substituting T and τ in Equation 2 yields a quadratic equation for p. Hence, by solving a quadratic equation for p, we can obtain pj for job j. Algorithm 1 illustrates the procedure to construct loading vector pj for job j in the system. We propose pj as the job size of job j. Then, the assignment P T cost T is the function of pj . We may define β = j τjj , which means the sum of slow-downs of expanded execution times of jobs due to migrations. As shown in Figure 6, experiments with two predefined workloads in FileBench Benchmark– file server and mail server confirm that our model captures the resulting performance with multiple resource contention in shared service systems. Here, the size of memory reserved to each guest machine is 1GB and other system specifications are the same to Table 1. Numerical examples for migration We may characterize migration as described in Algorithm 1. From the values in Figure 5, we can construct pmig = (0.85, 0.15) for 10Gbps infiniband and pmig = (0.94, 0.06) for 1Gbps Ethernet. Also, we know the time τmig to perform migration when system is idle; around 3.12 sec for 1G Ethernet and 2.64 sec for 10Gbps infiniband in our experimental environment. Suppose we have a workload j with pj = (0.8, 0.2) and we know the execution time τ when the workload j is the only workload in the system. Then, according to Equation 1, we can obtain
where 1 comes from the original execution time of each job. Note that the above equations are quadratic, which implies that the execution time of a job with multiple resource contention does not linearly increase. However, a challenge is how to determine the probability that job j accesses each resource, loading vector pj . We can obtain the access probability of each resource by job j, loading vector pj from actual systems as follows. For two identical jobs, Equation 1 becomes � T = τ 1 + p2 + (1 − p)2 . (2) 4
Tmig = 5.33sec for 1G Ethernet and Tmig = 4.59sec for 10Gbps infiniband. We can reason the performance impact of workload j as follows. The workload will contend for resources during those migration periods. For τ > 5.33, Tj = 5.33 + τ − 5.33/1.71. Since the third term, the processed portion of the workload during migration is already included in the first term 5.33, we subtract it. Similarly, we can obtain the expanded execution time of workload j for infiniband. Note that we quantified the performance impact on the system during migration period as well as the assignment cost in this numerical example. We may perform similar calculations to obtain the cost to reassign virtual machines. Suppose that we perform n migrations without any workload in the system, for simplicity. When we perform all the migrations simultaneously, the probability that one migration operation interferes with other n − 1 migrations is given by (n − 1)(p2 + (1 − p)2 ),
depends on the current load on the hosts of sender and receiver. Thus, we should determine the order of migrations when we optimize the assignment cost and performance impact.
4 Concluding Remarks This work studies the importance of assignment cost of migrated jobs in job scheduling. We argue that migration itself should be considered as an auxiliary job in the system, which owns asymmetrical performance impact on sender and receiver of the migrated job. We did not only empirically analyze the performance impact of migration on collocated workloads in the systems, but also, developed a mathematical model that characterizes the performance impact on the system. Current work is limited by quantifying and modeling the migration impact on systems between two nodes, however, it needs further investigation for multiple nodes that run parallel applications. We plan this as a future work and aim at developing an on-line job scheduler that incorporates the performance impact of migrated jobs to the system.
(3)
which is the sum of the probability of pairwise resource contention among migrations. Therefore, for the migration time without any interference τ , the assignment cost Tm , is given by Tm = τ (1 + (n − 1)(p2 + (1 − p)2 )).
5 Acknowledgments We acknowledge detailed comments from the anonymous reviewers, which helped us improve the quality of this paper. This work has been funded in part by Google.
(4)
However, when we perform all the migrations sequentially, the assignment cost Ts = nτ since individual migrations will be performed in τ . In this way, we could estimate the performance impact on workloads by migration, given the loading vectors of workloads. Challenges in solving the virtual machine assignment cost problem Here, we propose to consider the virtual machine assignment problem as the on-line scheduling problem in order to bound performance impact on the system during migration and whole assignment process. However, in order to adopt various scheduling algorithms, we face challenges. First, propagation effect in the performance impact needs to be considered. When a virtual machine is migrated, it incurs performance impact on other collocated virtual machines in the hosts of sender and receiver, which will slow down other dependent jobs in different hosts. This would be exacerbated if multiple migrations occur whether they are sequential or concurrent. Second, the performance impact due to the migration does not linearly increase. As we discussed in this section, the expanded execution time of a job due to multiple resource contention can be described by a quadratic equation (Equation 1). Thus, summing up the performance impact due to an individual migration does not account for the resulting performance impact on the system. Third, the order of migration may result in different performance impact and assignment cost. Since migration is also a job, their performance impact also
References [1] A RMBRUST, M., F OX , A., G RIFFITH , R., J OSEPH , A. D., K ATZ , R., K ONWINSKI , A., L EE , G., PATTERSON , D., R ABKIN , A., S TOICA , I., AND Z AHARIA , M. A view of cloud computing. Communications of the ACM 53, 4 (2010), 50–58. [2] B OBROFF , N., K OCHUT, A., AND B EATY, K. Dynamic placement of virtual machines for managing SLA violations. In Proceedings of the 10th IFIP/IEEE International Symposium on Integrated Network Management, 2007. IM ’07. (2007). [3] C LARK , C., F RASER , K., H AND , S., H ANSEN , J. G., J UL , E., L IMPACH , C., P RATT, I., AND WARFIELD , A. Live migration of virtual machines. In Proceedings of the 2nd conference on Symposium on Networked Systems Design & Implementation - Volume 2. NSDI ’05 (2005). [4] H ERMENIER , F., L ORCA , X., M ENAUD , J.-M., M ULLER , G., AND L AWALL , J. Entropy: a consolidation manager for clusters. In Proceedings of the 2009 ACM SIGPLAN/SIGOPS international conference on Virtual execution environments. VEE ’09 (2009). [5] L IM , S.-H., H UH , J.-S., K IM , Y., S HIPMAN , G. M., AND D AS , C. R. A quantitative analysis of performance of shared service systems with multiple resource contention. Tech. Rep. CSE 10010, The Pennsylvania State University, University Park, 2010. [6] M ENG , X., PAPPAS , V., AND Z HANG , L. Improving the scalability of data center networks with traffic-aware virtual machine placement. In Proceedings of the 29th conference on Information communications, 2010. INFOCOM ’10. (2010). [7] S ANDERS , P., S IVADASAN , N., AND S KUTELLA , M. Online scheduling with bounded migration. Mathematics of Operations Research 34, 2 (2009), 481–498. [8] S INGH , A., K ORUPOLU , M., AND M OHAPATRA , D. Serverstorage virtualization: Integration and load balancing in data centers. In Proceedings of Interenational Conference for High Performance Computing, Networking, Storage and Analysis, 2008. SC 2008. (2008). [9] W OOD , T., S HENOY, P., V ENKATARAMANI , A., AND Y OUSIF, M. Sandpiper: Black-box and gray-box resource management for virtual machines. Comput. Netw. 53 (December 2009), 2923– 2938.
5