The highly soluble CaO in the fly ash is expected to increase the pH of the ... precipitation of hydrous oxides such as amorphous iron(iii) hydroxide, ferrihydrite,.
Mineralogy and Trace Element Partitioning in Coal Fly Ash/Acid Mine Drainage Co-Disposed Solid Residues M.W. Gitari1, L. F. Petrik1, D. Key1, O. Etchebers1 and C. Okujeni2 1
Environmental Remediation Group, Department of Chemistry, University of the Western Cape, Department of Earth Sciences, University of the Western Cape, Private Bag X17, Bellville, 7535, South Africa 2
Abstract Acid mine drainage (AMD) was reacted with coal fly ash in a 24 hour equilibration time using 3:1 and 1.5:1 AMD: FA ratios by weight to produce neutral and alkaline process waters and remove major and minor elements from solution. The elemental concentration trends with time in the solution were used to discern which elements have solubility control in the neutralization process. The resulting co-disposal solid have been characterized using dissolution techniques coupled with differential x-ray diffraction in an attempt to detect the minerals precipitating out during the process. The trace elements extracted in the dissolution process were correlated with the total extractable Fe, Mn and Al in an attempt to establish any significant association. SEM and SEM-EDS have been used to detect the morphological changes of the solid residue particles on extraction. Key words: Coal fly ash, Acid mine drainage, co-disposal reaction, differential X-ray diffraction (DXRD), co-disposal solid residues, solubility control, trace elements. Introduction Acid mine drainage (AMD) often contains high concentrations of heavy metals such as Fe, Mn, Al and anions like SO42- in addition to elements like Zn, Co, Pb, Cr, Cu, in trace concentrations which necessitate these waters to be treated before release. Fly ash consists mainly of aluminosilicate glass matrix in addition to crystalline mullite and quartz [1]. The glass phase in fly ash has been found to be associated with elements such as As, Na, Mg, K, Sr, B, Mo as soluble salts on the surface of the fly ash spheres [2,3][Table 1]. The highly soluble CaO occurring as sub-micron fragments on the fly ash particles is highly reactive and can be utilized in the neutralization of acid mine drainage. In South Africa most power stations producing fly ash are located near the coal mining sites, which provides a good opportunity to co-dispose of the two pollutants. The alkalinity of the fly ash may not be as high as that of lime or limestone [4, 5] but availability in large quantities offers a cost effective method of neutralizing acid mine drainage. Moreover the formation of stable mineral phases with trace metal co-precipitation and adsorption in this process could result in residues suitable for disposal than the unreacted fly ash. A method of using coal fly ash for coal mine backfilling with no risk of groundwater contamination is sought.
The neutralization of AMD with various liming agents such as limestone [6, 7] and various uses of fly ash have been studied extensively [8, 9, 10]. The application of fly ash to control acid generation from sulphidic wastes such as mine tailings and coal spoils has been studied [11]. Most of the studies on treatment of AMD with fly ash have used synthetic AMD consisting mainly of the major parameters (SO42-, Fe3+, Fe2+, Al3+ and Mn). A preliminary co-disposal study, using a synthetic AMD with a leachate derived from an Eskom fly ash was undertaken [12]. This study showed that the pH and EC of the leachate could successfully be reduced by the addition of synthetic acid mine drainage (SAMD). Several authors point out that the dominant chemical characteristics of a fly ash leachate (pH, EC) are usually established within minutes of addition of water. This results from the flush of ions to the solution from readily soluble minerals present in the ash [13, 14]. After several hours of dissolution and precipitation reactions, the kinetics slow down substantially and a relatively stable solution composition is attained [14, 15]. Secondary minerals may precipitate out immediately depending on the ion concentration in solution after the initial rapid dissolution. However the quantities of secondary mineral precipitates may be too low to be detected by X-ray diffraction. This may partly be due to dilution by the major phases of fly ash such as mullite and quartz. Reardon and co-researchers [13] conducted leaching studies of fly ash at two different water/solid ratios and they were able to detect the existence of mineral solubility control for some elements. They argued that if an element concentration does not double when the water: solid (W: S) ratio is halved, then there must be a solid phase control on the element concentration in solution. In the AMD: fly ash neutralization reactions the elements occurring as soluble salts on the surfaces of the fly ash particles are expected to undergo initial rapid dissolution and mineral precipitation will occur depending on the species concentration. After several hours a stable solution composition will be achieved especially for elements whose hydroxides are highly soluble or exist as anions in solution (Mo, Se, As and B). The concentration trends of these elements in the first few hours can be used to discern whether any mineral solubility control exists in this neutralization reactions. The highly soluble CaO in the fly ash is expected to increase the pH of the AMD on contact. As pH increases Fe3+, Al3+ and Mn concentration are expected to decrease primarily due to precipitation of hydrous oxides such as amorphous iron(iii) hydroxide, ferrihydrite, schwertmannite, or goethite and amorphous aluminium (iii) hydroxide or poorly crystalline gibbsite. The formation and accumulation of these hydrous oxides promotes sorption and coprecipitation of dissolved Mn, Cu, Co, Ni and Zn [6] hence stabilizing them in the co-disposal solids. It is well known that Fe-oxides, with their high surface area, sequester cations such as transition metals and radionuclides, in proportions that are a function of solution composition and pH. Fe-oxides are also strong adsorbers of anionic complexes such as AsO43-, CrO42- and PO43- [16, 17, 18, 19, 20]. Thus Fe-compounds are useful for retarding transport and immobilizing contaminants. They are expected to play a great role in immobilization of trace metal contaminants in the fly ash/AMD treatment process. In the AMD:fly ash neutralization reactions Fe3+ is expected to be rapidly precipitated and Fe2+ quickly oxidized and hydrolyzed once the mixture attains optimum pH (>5.0). With the high
SO42- content (>10000 ppm) (Table 2) of the AMD it is likely that some of the SO42- could be incorporated into the structure or adsorbed on the surface of the iron oxides/oxyhydroxides [21, 22]. Several authors have observed that size or density fractionation of soil or fly ash play a role on detection limits of the minor mineral phases [23, 24] which are more concentrated in the small size fractions. McCarty and co-authors [24] observed gypsum by XRD in clay size separations which could not be detected in the bulk sample. Schulze [25] notes that in the analysis of iron oxide minerals in soil, particle size fractionation usually reduces problems with quartz by concentrating Fe-oxides in the fine fractions and quartz in the coarse ones. Schwertmann and co authors [21] observed that the fine fraction (≤2µm) obtained by repeated gravity sedimentation in water gave better differential X-ray diffraction patterns due to less interference from quartz. The most common method of identifying poorly ordered amorphous iron minerals is by oxalate dissolution [21, 24]. It was observed that the technique can be used to separate the crystalline iron oxides such as goethite, hematite or lepidocrocite from the amorphous Fe-oxides since non of these oxides could be identified in samples with high proportion of oxalate-soluble Fe. It was concluded that what is dissolved in 2 hours of oxalate dissolution is mainly ferrihydrite. Dold [26] coupled ammonium oxalate extraction with differential X-ray diffraction (DXRD) to successfully detect schwertmannite at low concentrations in oxidized mine tailings. Schulze [25] was able to show by DXRD that the material dissolved by oxalate treatment from a soil sample was ferrihydrite. Schwertmann and co-authors [21] further observe that ammonium oxalate dissolution coupled to DXRD improves the detection limits for ferrihydrite by a factor of six or seven. A sought after method for disposal of fly ash has been to put it back in coal mined out areas with a hope that it will consolidate, harden and provide support for the overburden to reduce subsidence. However there is concern that release of toxic trace elements will lead to deterioration of groundwater quality. It is anticipated that the reaction of fly ash and AMD will produce less reactive co-disposal solids that can be backfilled without risk for groundwater contamination. Understanding the interaction between the toxic elements in both fly ash and acid mine drainage and mineral phases being formed or likely to control their concentration in the neutralization process will be important in designing a treatment process. The nature of the associations between the toxic elements and mineral phases in the co-disposal solids will greatly dictate the release of the toxic elements if the co-disposed solids were to be used for backfilling and thereafter come into contact with aggressive ground water. The objectives of this study were: 1] to evaluate the process water chemistry with time for the AMD: FA ratios 3:1 and 1.5:1 and possible solubility controls for the major and minor elements. 2] to determine if the method of DXRD can facilitate identification of the poorly crystalline Feoxides formed in the process. 3] to study mineralogy and trace element association of the codisposal solids by using extractions methods designed to selectively dissolve Mn, Fe, and Al oxides. Methodology Sample description
The fly ash used was obtained directly from the Arnot power station in South Africa and kept in tightly locked PVC buckets to prevent ingress of CO2 which leads to loss of alkalinity [26]. AMD samples here referred to as Navigation were obtained at Navigation colliery in Witbank, South Africa. The results of the chemical characterization of the samples used are presented in tables 1 and 2. Experimental The fly ash/AMD neutralization experiments were conducted by stirring a mixture of fly ash and AMD in which the fly ash and AMD were weighed to give a specific AMD/FA ratio. The AMD was stirred for 30 minutes for equilibration before the fly ash was added. An overhead stirrer was used for all the experiments. The progress of the reaction was monitored by measuring the pH and EC with a Hanna HI 991301 portable pH/EC/TDS/Temperature meter. The reactions were stopped at designated time intervals (1, 3, 10, 15, 30, 60, 90, 150, 210, 270, 300, 360, 420, 480, 720 and 1440 minutes). The mixture was filtered through 0.45 µm nucleopore membrane and the filtrate analysed for the major elements, trace elements and SO42-. Elemental analysis of the water samples was done by ICP-MS (ELAN 6000). The accuracy of the analysis was monitored by analysis of NIST water standards. Fe2+/Fe3+ analysis was done by the colorimetric method using 2,2-bipyridal as the complexing reagent. SO42- analysis was done by Ion Chromatography. Solid residue preparation The solid residues were dried for 12 hours at 105oC and crushed in a mortar to a fine powder. The dried samples were then suspended in ultra-pure water in a water : solid (W: S) ratio of 20:1 and agitated in a ultrasonic bath for four hours. The suspension was allowed to stand for 10 minutes and then filtered through 0.45 µm nucleopore membrane to collect the very fine and light fraction. The remaining fraction was allowed to settle completely. Two fractions were thus distinct from the settled material hereby referred to as coarse and fine and were separated manually by using a spatula. The three size fractionated samples were oven dried for three hours at 600C before and after solvent extractions. The dissolution of the three size fractions was done by reaction with 0.2 M ammonium oxalate at pH 3.0 in the dark using the method of [28] but the extraction time was increased to 4 hours. The differential X-ray diffraction (DXRD) was done following the method of Schulze [25] after NH4-oxalate extraction of the three size fractionated samples. XRD and Scanning electron microscope investigations XRD spectra of the powder mounts of the untreated fractionated fractions and oxalate treated were obtained by step-scanning at intervals of 0.020 2θ from 50 to 850 and counted for 0.5 seconds per step. A Phillips PANalytical instrument was used with a pw3830 x-ray generator operated at 40 kV and 25 mA. The X’pert Graphics and identify program was used to identify the mineral phases using the JCPDF database. Samples for scanning electron microscope investigation were disaggregated in ethanol in a ultra-sonic bath. Drops were dispersed on a carbon tape using a pasteur pipette and then air dried. A scanning electron microscope (Hitachi X-650 micronanalyzer) was used to characterize the change in the morphology and chemical characteristics of the fractionated and extracted samples. Analysis by scanning electron
microscope coupled to energy dispersive analysis of X-rays spectrometer (SEM-EDX) of the codisposal solids and unreacted fly ash was done to qualitatively identify probable mineral phases that formed in the process and eluded detection by XRD. Calculation of saturation states Precipitation of solid phases may be the most important chemical process influencing on the fate of major (SO42-, Fe3+, Fe2+, Al, Mn, Ca, K, Na) and minor elements (B, Ba, Zn Cu, Sr, Mo, Ni, Si, Se, Co, Cr) in acid mine waters in this process. Activities of aqueous species and mineral saturation indices of selected mineral phases were calculated using PHREEQC software [29] and the WATEQ4F database. Saturation index (SI) is used when large deviations from equilibrium are observed. For SI=0, there is equilibrium between the mineral and the solution; SI0 supersaturation. For a state of subsaturation dissolution of the solid phase is expected and supersaturation suggests precipitation. Sequential Extraction experiments Co-disposal solids collected at pH 9.2 for the AMD:FA ratio 3:1 were subjected to a sequential extraction procedure to investigate trace metal partitioning in mineral phases. The methods described by Muller and co-author [30], Shuman [31], Jackson and co-authors [28] were adopted. The following fractions were identified: (1) soluble in water (Milliq water, 2 Hours), (2) specific surface complexes (NH4OAc 1M pH 6.4, 24 Hours), (3) Mn-oxides, NH2OH-HCl in 0.01M HNO3, pH 2.0, 0.5 Hours), (4) Crypto-crystalline Fe-oxides (amorphous), NH4Oac 0.2 M + Oxalic acid 0.2 M, pH 3.0, shake for 4 Hours (5) crystalline Fe oxides, NH4Oac 0.2 M + Oxalic acid 0.2 M + Ascorbic Acid 0.1 M, pH 3.25, 0.3 Hours at 96oC in dark. (6) Residue, Aqua Regia digestion, 7.5 ml 37 % HCL + 2.5 ml 65 % HNO3. Results and discussions Sample characterization The XRF results (Table 1) show that the fly ash consists of three major phases: Al2O3, Fe2O3 and SiO2. The American Society for Testing and Materials [35] uses these three major phases to classify fly ashes based on coal source. From the analysis (SiO2 +Al2O3+Fe2O3≥ 70%) the Arnot fly ash can be categorized as class F, which is either derived from anthracitic or bituminous coals [2]. Among the minor elements Arnot fly ash shows high concentrations of Sr, Ba, Cr, Zr and Ni. Traces of Mo are also present. These concentrations are within the concentration ranges reported by [3] and are higher than values generally found in coals and soils indicating that the combustion process tends to enrich the fly ash with minor elements. The Navigation AMD is strongly acidic (pH 2.39). The pH of mine water can be driven towards acidic or alkaline mode depending on the relative abundance and extent of weathering of pyrite and calcite neutralization. Low pH values of the AMD imply a deficiency of calcareous minerals and absence of carbonate buffering in mine tailings or boulders through which the groundwater flows. Major elements include Na, Ca, Mg, Al, Mn and Fe. Dissolution of silicate minerals such as feldspar, kaolinite and chlorite accounts for most or all of the dissolved K, Na, Mg, Al and Ca
[32]. The Navigation AMD has high SO42- content (Table 2) typical of leachate from sulphide rich coal mine tailings and underground mine lakes [27].
Table 1: Chemical characteristics of Arnot fly ash.
Table 2: Chemical and physical characteristics of Navigation AMD.
Major elements(%) SiO2 TiO2 Al2O3 Fe2O3
Arnot fly ash
Parameter
53.390 (2.390) 1.342 (0.054) 23.402 (1.086) 4.721(0.963)
MnO MgO CaO Na2O K2O P2O5 Cr2O3 NiO V2O5 ZrO2 LOI
0.059 (0.002) 2.698(0.045) 8.434(0.574) 0.351(0.253) 0.493(0.032) 0.348(0.216) 0.033(0.009) 0.011(0.0007) 0.0189∗ 0.0516∗ 2.365 (0.191)
pH EC(mS/cm) Acidity(mg/l CaCO3) TDS(mg/L) B Na Mg Al Si K Ca Mn Fe2+ Fe3+ Ni Cu Zn Se Sr Mo Ba SO42ClNO3-
Trace elements(ppm)
Arnot fly ash
Cu Mo Ni Pb Sr Zn Zr Co Cr V Ba
47.34(6.58) 5.229∗ 93.41(6.49) 56.35(13.63) 1463.9(111.8) 57.33(4.71) 488.10(125.7) 18.25(13.08) 179.2(1.14) 147.4(39) 928.0(91.9)
Navigation AMD 2.78 13.71 14450 16765 10.3 102.9 399.4 453.4 99.2 BDL 146.9 95.8 4444.9 2065.6 6.16 7.10 15.71 10.39 1.95 0.014 0.108 24880 370 90
Neutralization Reactions The evolution of pH values with time for the 3:1 and 1.5:1 AMD: FA ratios are presented in Figure 1. 12
10
pH
8
6
4
3:01
2
1.5:1
0
0
3
30
90
210
360
720
contact time (mins)
Figure 1: pH change with contact time for the AN31 and AN151 reactions
Fe3+, Al3+, Fe2+ and Mn2+ (Table 2). The relative quantities of soluble bases (oxides) in fly ash and hydrolysable constituents in AMD dictate whether the final solution at a given contact time will have a dominant acid or basic character. There are two factors that will finally dictate the nature of the final solution in these co-disposal reactions: a) AMD: FA ratio b) Contact time While the 1.5:1 ratio achieves a breakthrough to alkaline pH (8.0 to 9.0) after only 120 minutes, the 3:1 ratio achieves the same breakthrough after1440 minutes. This confirms the importance of the amounts of available soluble oxides in controlling the pH of the process waters. XRD and SEM-EDX analysis of the codisposal solids
pH Values The pH values for the 3:1 ratio are characterized by two buffer regions, at pH 4 - 4.5 and pH 6.0. The 1.5:1 ratio shows two buffer regions, at pH 4.5 - 5.0 and at pH 9.0. The buffering exhibited by the AMD at the 1.5:1 ratio is stronger. This is evidenced by the lower gradient of the curves at this buffer regions. The buffering region at pH 9.0 is absent in the 3:1 ratio since the system did not attain pH 9.0 within the contact time investigated. The buffering region at pH 9.0 for 1.5:1 ratio could be attributed to the formation of soluble hydrous complexes by cations such as Al(OH)4- at high pH [36]. There are two opposing processes which establish the pH value for the solution in this neutralization process. The dissolution and hydrolysis of oxide components such as CaO and MgO (eqns 1 and 2) from fly ash contributes to an increase in solution pH : CaO + H 2 O → Ca 2+ + 2OH − ………(1) MgO + H 2O → Mg 2+ + 2OH − ……...(2) Offsetting the pH increase contributed by the dissolution of the oxide components is the hydrolysis of AMD constituents such as
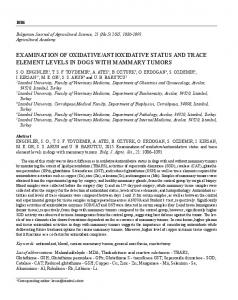
The SEM-EDX spot analysis were done on AN31 and AN151 co-disposal solids collected at pH 8.0-9.2. The spots analysed are shown in figures 2 and 3 below.
Figure 2: SEM micrograph of AN31 co-disposal solid showing the areas (A, B, C, D) where spot analysis was done 1(mg*1000)
1
Mg-magnification
amounts of Zn and Cu. K can be replaced by Ca, Pb, Ba, Sr, or Ce, Sulphate can also be replaced by PO4, AsO4, CO3, SbO3, CrO4 or SiO4 [37]. The XRD of the co-disposal solids revealed gypsum as the only new mineral phase formed at all contact times (Fig 4). Table 3: SEM-EDX spot analysis (weight %) of the AN31 co-disposal solids precipitated at pH 9.20. Figure 3: SEM micrograph of AN31 co-disposal solids showing the areas (E, F, G) where spot analysis was done. Element Arnot AN31 AN31 AN31 AN31 AN31 AN31 AN31G fly A B C D E F ash O 32.72 15.17 33.26 30.42 36.02 19.47 27.45 34.05 Al
20.8
19.59 15.6
14.59 11.15 28.74 32.84 10.19
Si
33.57 39.15 20.06 24.08 23.89 27.7
36.31 6.45
P
ND
ND
ND
1.7
2.82
0.72
ND
ND
S
ND
ND
1.95
1
8.8
0.98
ND
11.24
Mg
ND
3.14
5.07
3.13
1.26
2.05
ND
0.96
Ca
6.76
13.82 10.89 14.27 16.02 6.57
0.76
34.59 ND
K
1.46
ND
0.43
0.61
0.45
1.6
0.78
Ti
3.08
5.56
1.01
2.69
0.3
2.84
0.21
0.45
V
ND
0.34
ND
0.15
ND
1.08
ND
ND
Fe
1.6
3.23
10.04 6.24
1.38
8.97
1.64
2.08
G
G G
Q
M
intensity
According to SEM-EDX analysis it can be deduced that the mechanism of the reaction could be a dissolution of most of the surface soluble salts. The dissolved salts then react with the AMD components in the bulky of the solution and the minerals either precipitate on the surface of the large spheres or fill in between the small spheres leading to aggregation. The SEM-EDX elemental profiles indicated a general increase in content of Ca, Mg and Si in most of the spots analysed. These spots do not show any crystallinity. Analysis of the crystals observed (AN31-D and AN31 G) (figs 2 and 3) suggests gypsum and ettringite are crystallizing out in this process. Ettringite could not be detected by XRD though. Analysis of the aggregating fly ash spheres indicates an increase in Fe, suggesting that an iron-rich phase is being formed (AN31B)(Table 3). Analysis of the small fly ash spheres with fine coatings also reveal increased iron content (AN31-C). Analysis of spot C of this sphere showed increased Ca, Mg, Fe, P, S (Table 3). The presence of P, S and Ca suggests a type of jarosite mineral being precipitated where K or Na is being replaced by Ca, Mg in the jarosite. Jarosite is a hydroxysulfate of Fe and K or Na, Fe can be replaced by Al and by smaller
M +Q
G Q
M +Q A N31720
A N31480
0
50
100
degrees tw o theta
Fig 4: XRD spectra of co-disposal solids collected at 360 and 720 minutes of contact (G-gypsum, Qquartz, M-mullite)
DXRD analysis of size fractionated codispsal solids
Table 4: Total (2Feo) extracted from the three size fractions Sample AN31coarse AN31fine AN31Very fine
2
Dissolution time 4hrs 4hrs 4hrs
Feo-oxalate extractable Fe
Concentration mg /kg 6919 7256 7200
% 0.692 0.725 0.720
intensity
200 150 100 50 0 -50
0
20
40 60 degrees tw o theta
80
Fig 5: DXRD pattern of fine fraction after 4hrs treatment with NH4-oxalate
Sulfate trends Figure 6 below shows the SO42- trends for the AN31 and AN151 reactions for a 24 hour contact time. 30000
3:01
25000
conc (mg/l)
No significant difference was observed in the total Fe extracted between the three size fractions (Table 4).The fine and the very fine fraction had slightly higher concentration than the coarse fraction. The DXRD pattern did not show presence of ferrihydrite (Fig 5). The concentration (2Feo) in the three size fractions varied from 0.692 % to 0.720 % Fe dry weight (Table 4). The XRD patterns of the NH4-oxalate extracted and non-extracted sample fraction were similar except that the intensity of the main crystalline peak quartz increases in relative intensity. The baseline was observed to straighten with a disappearance of some of the smaller peaks which could indicate that some mineral phases were dissolved but could not be detected probably due to their low concentration. Figure 5 below shows the DXRD pattern of the fine fraction. Schwertmann and co-authors [21] observed ferrihydrite in soil samples with 13.3 % Feo (oxalate extractable Fe) but not in sample with 2.9 %. They concluded that the lower limit of detection of ferrihydrite lies somewhere between these two Feo values. The size fractionated co-disposal solid samples had % Feo below 2.9 % (Table 4).
250
1.5:1
20000 15000 10000 5000 0 0
3
30
90
210
360
contact tim e (m ins)
720
2-
Figure 6: SO4 concentration in process water for AN31/151 reactions
Navigation AMD samples were characterized by high SO42- levels (24880 mg/L)(Fig 6, Table 2). A decreasing SO42 concentration to a minimum was observed with time for both AMD: FA ratios. A sharp decrease was observed when the mixture attained pH>5.5 (Fig 6 and 1) for ratio 1.5:1. At pH>6.0 Fe2+ oxidation is optimum and iron hydroxides that precipitate out are known to adsorb high concentrations of SO4 [33]. XRD and SEM-EDX detected gypsum (Fig 2 and 6)in solids collected for all the contact times indicating that it had control on SO42- levels. Doubling the mass of fly ash relative to volume of AMD did not result in increase of final SO42- levels, which further confirms presence of solubility control (Fig 6). At pH 8.00(AN31) and 9.20 (AN151) SO42- levels were observed to increase and
1600 1400 1200
conc (mg/l)
then decrease between 720-1440 minutes. Formation of ettringite (3CaO.Al2O3.3CaSO4.32H2O) could account for the decrease at this pH. Ettringite was identified by SEM-EDX in co-disposal solids collected at pH>9.0.
1000 800 600 400
3:01
200
1.5:1
0
The trends of major and minor elements in the process waters with time are shown in figures 7 to 21 below 1200
conc (mg/l)
1000 800
3:01
0
3
210
360
720
40
1.5:1
35 30 25 20 15
3:01
10
1.5:1
5 0
400
0
3
30
0 0
3
30
90
210
360
720
cocntact time (mins)
conc(mg/l)
160 140 120 100 80
3:01
60
1.5:1
20 18 16 14 12 10 8 6 4 2 0
3:01 0
40 20 0 0
3
30
90
210
360
contact time (mins)
720
3:01
0.8
1.5:1
0.6
720
3
30
90
1.5:1 210
360
contact time (mins)
720
1.2 1
conc (mg/l)
1
360
Figure 12: Sr concentration in process water for AN31 and AN151 reactions
Figure 8: Na concentration in process water for AN31 and AN151 reactions 1.2
210
Figure 11: B concentration in process water for AN31 and AN151 reactions
Figure 7: Ca concentration in process water for AN31 and AN151 reactions 180
90
contact time (mins)
200
conc (mg/l)
90
45
600
conc(mg/l)
30
contact time (mins)
Figure 10: Mg concentration in process water for AN31 and AN151 reactions
conc (mg/l)
Trends of major and minor elements in the process water for AN31 and AN151 reactions
3:01
0.8
1.5:1
0.6 0.4 0.2
0.4
0 0
0.2
3
30
90
210
360
720
contact time (mins)
0 0
3
30
90
210
360
contact time (mins)
720
Figure 9: Ba concentration in process water for AN31 and AN151 reactions
Figure 13: Mo concentration in process water for AN31 and AN151 reactions
3:01
1
1.5:1
0 4.92 6.02
6.1
6.32 6.22
6.95 9.12
pH 2+
0
10
150 300 480 conctact time (mins)
1440
Figure 14: Se concentration in process water for AN31 and AN151 reactions 500 450 400 350 300 250 200 150 100 50
0
3:01
0
3
30
Figure 18: Removal of Fe , Fe3+ and total Fe with change in pH in process waters for Arnot fly ash and navigation AMD for the reaction ratio 3:1
1.5:1
90
210
18 16 14 12 10 8 6 4 2 0 0
360
720
120
3:01
1.5:1
conc (mg/l)
Figure 15: Al concentration in process water for AN31 and AN151 reactions
3
30
80
210
contact time (mins)
10 9 8 7 6 5 4 3 2 1 0
360
720
3:01
60
0
3
40
30
90
210
1.5:1
360
720
contact time (mins)
Figure 20: Cu concentration in process water of AN31 and AN151 reactions
20 0 0
3
30
90
210
360
720
contact time (mins)
7000
120 100
2500
total Fe Fe2+ Fe3+
6000
total Fe/Fe2+
Figure 16: Si concentration in process water for AN31 and AN151 reactions
5000 4000 3000
1000
60
0
3:01
20
500 0
30
90
210
4.45
5.69
6.32
9.16
9.14
9.2
pH
1.5:1
0 3
1500 1000
2.19
40
2000
2000
80
0
90
1.5:1
Figure 19: Zn concentration in process water for AN31 and AN151 reactions
contact time (mins)
100
3:01
Fe3+
conc (mg/l)
1500
500
0.5
conc (mg/l)
2000
1000
2.78 4.17
0
conc (mg/l)
total Fe Fe2+ Fe3+
Fe3+
Fe2+/Fe total
1.5
conc (mg/l)
conc (mg/l)
2
2500
7000 6000 5000 4000 3000 2000 1000 0
360
contact time (mins)
720
Figure 17: Mn concentration in process water for AN31 and AN151 reactions
Figure 21: Removal of Fe2+, Fe3+ and total Fe with change in pH in process waters for Arnot fly ash and Navigation AMD for the reaction ratio 1.5:1
Mineral solubility controls on major and minor elements Figures 7 to 21 show the variation of major and minor elements in the process waters at various contact time for AMD: FA ratios of 3:1 and 1.5:1. Two groups of elements are evident from the concentration profiles obtained for the two ratios. Ni, Fe, Al, B do not show doubling of the concentration in solution with doubling of fly ash. This is an equivocal evidence for solubility control on their solution concentration for the entire contact time investigated [13]. The second group of elements (Na, Ca, Ba, Mg, Sr, B, Mo, Se, Si, Mn, Zn, Ni) show doubling of concentration in solution when the fly ash is doubled at certain contact times. This indicates development of solubility controls through dissolution kinetics or equilibrium precipitation which can be predicted by geochemical equilibrium model [34]. The main feature prevalent in this group of elements is the doubling of concentration in the first 3 minutes of contact with AMD. This observation indicate that these elements could be present initially as readily soluble mineral phases or salts. New mineral phases formed as a result of the elements leaching from fly ash and interacting with species in AMD could be controlling the concentration of these elements in solution Table 5: Calculated saturation indices for selected mineral phases at selected contact times (minutes) Contact time (min) Al (OH)3 (a) Barite (BaSO4) Basaluminite (Al4(OH)10SO4) Boehmite (AlOOH) Celestite (SrSO4) Fe (OH)3 (a) Gibbsite (Al(OH)3) Goethite (FeOOH) Gypsum (CaSO4:2H2O) Jarosite-Na (NaFe3(SO4)2(OH)6) Jurbanite (AlOHSO4) Kaolinite (Al2Si2O5(OH)4) Quartz (SiO2) Sepiolite(Mg2Si3O7.5OH:3H2O) SiO2(a)
1 min -4.11 1.03 -4.41 -1.91 -0.07 1.53 -1.39 4.88 -0.29 6.58 0.64 0.09 1.03 -14.14 -0.27
3 min -3.19 0.79 -1.34 -0.98 0.2 -6.79 -0.48 5.32 0.04 7.54 1.21 2.21 1.18 -12.81 -0.11
30 min -0.86 7.99 1.36 4.99 0.23 1.82 -2.2 5.16 0.18 7.62 -0.09 -1.6 1 -13.93 -0.3
90 min -0.86 1.36 4.99 1.35 0.3 4.16 1.85 7.59 0.17 10.1 0.72 5.26 0.37 -9.46 -0.91
210 min -1.16 1.29 3.58 1.05 0.27 3.73 1.54 7.18 0.14 8.85 0.37 4.49 0.3 -9.53 -0.98
480 min 0.02 1.11 5.27 2.23 0.22 4.23 2.72 7.68 -0.12 5.62 -1.49 5.46 -0.4 -5.57 -1.68
1440 min -2.44 1.03 -8.96 -0.22 0.2 2.68 0.26 6.14 -0.15 -5.54 -8.32 -0.48 -0.92 1.38 -2.19
Calcium, Sodium, Barium and Strontium The concentration of Ca, Na, Ba and Sr exhibited a similar trend (Figures 7, 8, 9, 12), initially showing an increase (after 3 minutes of contact) for both ratios. The ratio 1.5:1 initially gives higher concentration than the 3:1 ratio which indicates that fly ash is a source of these elements. The 1.5:1 ratio, after the initial increase, a decrease to values slightly lower than the 3:1 ratio suggests solubility control for these elements. The solution was highly oversaturated with Na jarosite (Table 5, Fig 8) and, which could account for the decreasing levels of Na. Gypsum was detected by XRD in all the co-disposal solids collected at different contact times (Fig 4). Saturation indices (Table 4) show that the solution was slightly oversaturated with gypsum from
3 to 210 minutes of contact indicating that gypsum controlled Ca concentration in process waters. Although Sr and Ba show evidence of solubility control after the initial release from fly ash Sr was observed to increase steadily for the rest of the experiment for both ratios (Fig 9 and 12). The solution was at saturation with celestite but oversaturated with barite for the entire contact time (Table 5). Boron, Molydenum and Selenium B concentration show pH dependence (Fig 11). An initial increase is observed for both ratios to a maximum. This is followed by a decrease as the pH increases. The initial increase is due to dissolution of soluble surface oxide precipitates [1]. The higher concentration observed for 3:1 ratio could indicate that B concentration is limited by the dissolution rates of its soluble oxides. Several authors have reported interaction of B with Ca at high pH [38, 39]. Precipitating ettringite is also reported to incorporate oxyanions such as borate in alkaline solutions and could account for the decreasing B concentrations at high pH. Mo exhibited a slight increase in concentration for both ratios until pH=6.0-7.0, when a sharp increase was observed. After 60 minutes of contact the Mo concentrations doubled with halving of the AMD in the reaction mixture, which is a strong indication of lack of solubility control and that the main source is fly ash (Figure 13). Between 1 and 30 minutes of contact, the concentration for both ratios differed slightly, which could indicate presence of solubility control. Eary and co-authors 1990 [3] observed that Mo exists as an oxyanion over most of the pH range and its concentration is likely to be controlled by metal molybdates. Observation of the Mo trends for both ratios indicates that Mo concentration increases significantly when the reaction mixture attains pH>7.0 (Figure 13), At this pH most of the heavy metals are out of solution. Eary [3] reports that Mo concentration could be controlled by metal molybdates and lack of dissolved metals at high pH explains the increasing concentration of Mo. Se concentration shows a strong pH dependence with concentration initially high at low pH decreasing to a minimum at near-neutral pH (Fig 14) and then showing an increase as the reaction mixture attains pH >7.0 for both ratios. The concentration for the 1.5:1 ratio was higher than the ratio 3:1 by a factor of two for the entire contact time which is a strong indication of lack of solubility control and that fly ash could have been the main source. An observation of the trends for both ratios shows that the concentration starts to increase when the mixture attains pH=7.0 for 3:1 and pH=9.0 for 1.5:1. Van der Hoek and Comans [40] report that aluminium oxide and iron oxide have a great adsorption ability for selenite and the adsorption is pH dependent.This is enhanced when monoanionic species are present (HSeO3-). An observation of the Se trends (Fig14) indicates that minimum Se concentration were attained within a pH range of 4.5 to 7.0 for 3:1 and 5.0 to 9.0 for 1.5:1. The Pka values for selenite are 2.53 and 7.3 which corresponds closely to the pH range observed (Fig 14). Significant quantities of alumina and iron oxide were identified in Arnot fly ash by XRF (Table 1) Se trends reflects the adsorption behaviour for these oxides. Aluminium and Silicon At both ratios, Al and Si decreased with increasing pH (Figures 15, 16). The concentration decreased significantly when the reaction mixture attained a pH.5.0 (Fig 1). At pH 5.0- 8.8 the solid Al(OH)3 is most prevalent and controls Al concentration. No crystalline Al phases were detected by XRD though. Calculation of saturation indices indicates that basaluminite, boehmite,
gibbsite were oversaturated between 30 and 480 minutes of contact (Table 5). At low pH, jurbanite is slightly oversaturated, indicating control on Al concentration. For Si, the concentration for the 3:1 ratio remained slightly higher than the 1.5:1 ratio for the rest of the experiment. A sharp decline in Si concentration was observed when the mixture attained pH > 5.0 for both ratios. An observation of the saturation indices for kaolinite (Table 5) indicates oversaturation at 90 minutes of contact when the solution attained pH >5.0 (Figure 1). Amorphous SiO2 is near equilibrium with the solution for the first 210 minutes of contact (pH5.0. Then a significant drop in concentration was observed (Fig 10). The fact that more than 50 % of Mg was lost from solution at a lower pH than predicted by thermodynamic calculations (pH=9.8) [41] indicates that other processes such as adsorption could account for its removal. At pH >8.0, saturation index calculations (Table 5) indicate oversaturation with sepiolite (Table 5) which could be a control for Mg. Stoessel [42] observed formation of sepiolite at similar pH conditions. Similarly, a significant proportion of Mn was removed from solution at a lower pH (>60 % at pH 7.0)(Fig 17) than predicted by thermodynamic stability of its hydroxide. However complete removal was achieved when the mixture attained pH >8.0, which is close to the pH when Mn is expected to be out of solution (pH 9.0). According to Britton [41], Cu hydroxide precipitates at pH>5.3, Zn hydroxide at pH> 7.0. Observation of the removal trends for Cu for both ratios indicates that greater than 75 % of the total concentration is out of solution when the mixture attained pH>5.5 (Fig 19, 20). At ratio 3:1 significant drop in concentration is observed at lower pH than 5.5 which indicates another process apart from hydroxide precipitation is responsible for Cu removal. At pH >5.0 optimum oxidation of Fe2+ is achieved and co-precipitation and adsorption by the iron oxyhydroxides being precipitated could account for earlier removal of Cu [6]. Similarly it can be observed that Zn concentration significantly reduced on the mixture attaining pH>5.5 (Fig 19) which is lower than that predicted by thermodynamic calculations (pH=6.6) [41]. Kooner [47] reported that the relative adsorption of Cu and Zn on iron oxides such as goethite is related to the ability of the metals to be hydrolyzed in aqueous solution. Over 50 % Cu and Zn is adsorbed at pH >5.5 and >7.0 respectively which corresponds to the first hydrolysis constants (pK1) of these metals (Cu=7.3, Zn=9.5). Total Fe, Fe3+, Fe2+ and SO42The removal of total iron follows a similar trend for both ratios, with > 90 % being removed on the mixture attaining pH>7.0 (Figures 18 and 21). The initial decrease in concentration indicates removal of Fe3+ probably as Fe (OH)3. According to Britton [41], Fe3+ hydroxide precipitates out at pH 3.0. The increase thereafter could be attributed to leaching from fly ash. Significant quantities of Fe2O3 were identified by XRF (Table 1) in the fly ash. The H+ from the AMD reacted with the iron oxide, releasing Fe3+which subsequently hydrolyzed [43]. On the mixture attaining pH > 5.5, a significant drop in total Fe concentration was observed for both ratios
(figure 18 and 21). The sharp drop on total iron at this pH is accounted for by the optimum oxidation of Fe2+ [44] followed by hydrolysis. Observation of figure18 indicates that the removal pattern at pH>6.0 of total Fe follows that of Fe2+ for the ratio 3:1. The Fe2+ is completely removed from solution at pH 8.0. The observed pattern indicates that Fe2+ is removed from solution by precipitation, probably as Fe(OH)3 after oxidation and subsequent hydrolysis. Calculation of saturation indices shows that amorphous Fe(OH)3 and goethite are at oversaturation for the duration of the experiment (Table 5). SEM-EDX detected Fe rich mineral phases coating fly ash particles in the co-disposal solids. This indicates that the iron rich mineral phases are too amorphous to be detected by XRD or the concentration is below the detection limits. The SO42- concentration decreased gradually and didn’t vary significantly between the two ratios for the first 60 minutes of contact (Figure 6). However as the mixture attained pH 5.5 the ratio 1.5:1 exhibited a sharp drop in SO42- concentration, stabilizing at (3178 mg/L) after150 minutes of contact. A significant drop was also observed when the ratio 3:1 mixture attained pH 6.0, stabilizing at 7000 mg/L. The sharp drop observed for the two ratios corresponds to the pH for optimum oxidation of Fe2+, iron oxyhydroxides that precipitate out on oxidation of Fe2+ and hydrolysis are known to adsorb or incorporate high concentrations of SO42- [45]. Gypsum was detected by XRD and SEM-EDX for all the co-disposal solids collected at all contact times investigated. Calculation of saturation indices indicated saturation with gypsum at contact times of 3 to 210 minutes. Formation of gypsum could probably account for the initial gradual decrease in SO42- concentrations (figure 6). Sequential extraction results The sequential extraction results of the 3AN31 co-disposal solid are presented in figure 22. From observation of figure 22, it is prevalent that a significant percentage % of the trace elements (except B) are associated with the amorphous Fe-oxides. It indicates that the Fe-oxides are an important sink for trace metals in this process. B was significantly associated with the specific surface complex fraction. Eary and co-authors [3] argues that B concentration in leachates may only be limited by the dissolution rates of surface precipitates in fly ash and the glassy particles and subsequent adsorption on precipitates formed. Cravotta and co-authors [6] reported a removal of dissolved Mn, Zn, Ni and Co from solution, and the corresponding enrichment relative to Fe in particles and coatings on limestone. They attributed the enrichment to sorption and co-precipitation reactions with hydrous oxides of Fe3+, Mn2+ and Mn4+. Several authors [22, 46] report that sorption of trace elements can be enhanced by the incorporation of SO42- with hydrous Fe3+ oxides, where SO42- can be part of the crystal lattice as in schwertmannite. A sharp drop in SO42- concentration was observed when the reaction mixture attained pH 5.5 for both ratios (figure 6) suggesting either adsorption or incorporation into the iron (iii) oxyhydroxides being formed. At this pH, a corresponding sharp drop in both total Fe and Fe2+ was observed (figures 18 and 21). An observation of the trends (figures17, 19, 20) for trace elements (Zn, Cu, Mn) indicates a significant removal at pH 5.5. A significant proportion of Al and Si is observed to be associated with the amorphous Fe-oxide phase (figure 22). Although the reagent NH4-oxalate solution (pH 3.0) has been used extensively to identify amorphous Fe-oxides [21, 25, 26], it extracts noncrystalline aluminosilicates and this 3
AN31-Arnot fly ash + Navigation AMD co-disposal solids for AMD : FA ratio of 3:1.
could account for the large proportion of Al and Si associated with this fraction. Ca and Sr were observed to be associated in fairly large proportion with the soluble fraction and the residue. Gypsum was identified by XRD and SEM-EDX and celestite was predicted to be precipitating out (Table 5). This could indicate the presence of these elements as soluble salts such as gypsum or celestite on the surface of the solids and also locked in the unaltered aluminosilicate matrix of the fly ash. A significant proportion of Ca, B and Sr was also associated with the Mn-oxide fraction probably through adsorption.
soluble in water specific surface complexes Mn-oxides
B
cryptocrystalline Fe-oxides Crystalline Fe-oxides 0%
20%
40%
60%
80%
100%
Final Residue
Si Ca
Al
0%
20%
40%
60%
80%
100%
0%
20%
40%
60%
80%
100%
20%
40%
60%
80%
100%
0%
20%
40%
60%
80%
100%
0%
20%
40%
K
Fe
Mg Na 0%
20%
40%
60%
80%
0%
100%
Ba
Mn Mo 0%
20%
40%
60%
80%
100%
Sr
Zn
Se
Cu 0%
20%
40%
60%
80%
100%
60%
80%
Fig 22: Sequential extraction results for AN31 co-disposal solids collected at pH 9.20
100%
Conclusions The objective of this study was to evaluate the chemistry of the resulting process water as the sulphate and metal rich AMD interact with fly ash, to relate the solution chemistry and formation of solid phases. Understanding the behavior and ultimate fate of the SO42-, major and trace elements in AMD and fly ash during the treatment process is a major determinant in usage of fly ash as a liming agent. The dissolution and hydrolysis of oxide components such as CaO and MgO from fly ash on contact with AMD contributes to an increase in solution pH. In turn an increase in dissolved concentration of Ca and Mg is observed as the reaction progresses. There are two factors that finally dictate the final pH of the process waters-1] AMD: FA ratio, 2] contact time. Increased removal of elements such as B, Mg, Mn, Al, Si, total Fe, Zn and was observed at the lower AMD : FA ratio indicating the importance of precipitation reactions in this process. The elements Fe, Al, B appear to have solubility control for the entire contact time investigated. Calculated SI values and mineralogical analysis indicate that SO42- Fe and Al are controlled by mineral solubility. Al concentrations are controlled by secondary phases such as boehmite, basaluminite and gibbsite, Fe by amorphous Fe(OH)3 and goethite, Ca and SO42- by gypsum. The elements Na, Ca, Ba, Mg, Sr, B, Mo, Se, Si, Mn, Zn show development of solubility controls at certain contact times after the initial dissolution. It is probable that they are present as soluble salts and, on dissolution, interact with components in AMD to form new stable mineral phases which control their concentrations. Mn, Mg, Zn and Cu were removed from solution at a lower pH (5.5-7.0) than predicted by thermodynamic calculations indicating that other processes such as adsorption and coprecipitation were responsible for increased metal removal. The strong association of these elements with the amorphous iron oxide fraction reinforces this hypothesis. Fe2+ was removed through oxidation and subsequent hydrolysis and this was evident when the mixture attained pH.5.5. A corresponding decrease in SO42- concentration was observed indicating the relevance of the iron-oxyhydroxides in SO42- removal in this process. This was clearly evident at 1.5:1 AMD: FA ratio with levels dropping to minimum of 3178 mg/L on the mixture attaining pH>5.5 as compared to 3:1 ratio. ACKNOWLEDGEMENTS The authors wish to express their gratitude to the Water Research Commission (WRC), Coaltech 2020 Consortium, and the National Research Foundation (NRF) for providing financial support to perform this study. We would also like to express our gratitude to the CSIR and ESKOM, for their assistance in the collection of samples. Special thanks go to the Chemistry Department of the University of the Western Cape for the assistance provided during this study.
References [1] Hullet L.D. and A.J. Weinbeger. Some etching studies of the microstructure and composition of large aluminosilicate particles in fly ash from coal-burning power plants. Environmental Science and Technology, 1980, vol 14, No 8. [2] Mattigod S.V, Dhanpat Rai, L.E. Eary, and C.C. Ainsworth. Geochemical factors controlling the mobilization of inorganic constituents from fossil fuel combustion residues: I. Review of the major elements. J. Environ. Qual. 1990, 19,188-201. [3] Eary L.E, Dhanpat Rai, S.V. Mattigod, and C.C. Ainsworth. Geochemical Factors controlling the mobilization of inorganic constituents from fossil fuel combustion residues: II. Review of the minor elements. J. Environ. Qual. 1990, 19, 202-214. [4] Maree J. P., M. De Beer. Effect of power station ash on water quality when contacted with acid mine water. COALTECH 2020, 2000,TASK 2.7.1: To determine and quantify the benefits of ashfilling (and slurries) in coal mining. [5] Klink. M. The potential use of South African coal fly ash as a neutralization treatment option for acid mine drainage. MSc Thesis. 2004. University Of The Western Cape. [6] Cravotta C.A. III, Mary Kay Trahan.. Limestone drains to increase pH and remove dissolved metals from acidic mine drainage. Applied Geochemistry. 1999, 14, 581-606. [7] Maree J.P. and G.J Van Tonder. Limestone neutralization of Iron(II) rich acid water.WISA 2000 biennial conference, suncity, South Africa, 28th May to 1st June 2000. [8] Thomson J.G. Acid mine waters in South Africa and their amelioration. Water SA, 1980,Vol. 6. No. 3. [9] Hodgson L, Dan Dyer, and D.A. Brown. Neutralization and dissolution of High-Calcium fly ash. J. Environmental Quality, 1982, Vol. 11, no. 1.. [10] Jenke R.D and Gordon K. Pagenkpof. Chemical changes in concentrated, acidic, metalbearing waste waters when treated with lime. Environmental Science and Technology, 1983,Vol 17, No. 4. [11] Xenidis Anthimos, Evangelia Mylona, Ioannis Paspaliaris. Potential use of lignite fly ash for the control of acid generation from sulphidic wastes. Waste Management, 2002, 22, 631-641. [12] O’Brien, R.D. The Neutralisation of Acid Mine Drainage by Fly Ash. MSc Thesis, 2000. University of Cape Town, RSA. [13] Reardon E.J., C.A. Czank, C.J. Warren, R. Dayal, and H.M. Johnston. Determining controls on element concentrations in fly ash leachate. Waste Management and Research, 1995,13, 435 450. [14] Campbell A. Chemical, physical and mineralogical properties associated with the hardening of some South African fly ashes. MSc thesis, 1998. University of Cape Town, RSA. [15] Kopsick, D. and Angino, E. E. Effect of leachate solutions from fly ash and bottom ash on groundwater quality. Journal of hydrology, 1981, 54, 341-356. [16] Randall, S.R., Sherman, D. M., Ragnarsdottir, K.V. Sorption of As(V) on green rust (Fe4(II) Fe2(III)(OH)12SO4.3H2O) and lepidocrocite (γ-FeOOH): surface complexes from EXAFS spectroscopy. Geochim. Cosmochim. Acta, 2001, 65, 1015-1023. [17] Ding, M., de Jong, B.H.W.S., Roosendaal, S.J., Vredenberg, A. XPS studies on the electronic structure of bonding between solid and solutes: adsorption of arsenate, chromate, phosphate, Pb2+, and Zn2+ ions on amorphous black ferric oxyhydroxide. Geochim. Cosmochim. Acta, 2000, 65, 1209-1219.
[18] Russel, J.D., Parfitt, R.L., Fraser, A.R., Farmer, V.C. Surface structures of gibbsite, goethite and phosphated goethite. Nature, 1974, vol 248, 220-221. [19] Persson, P., Nilson, N., Sjöberg, S. Structure and bonding of orthophosphate ions at the iron oxide-aqueous surface. J. colloid interface Sci, 1996, 177, 263-275. [20] Agyei N.M. C.A. Strydom., J.H. Potgieter. The removal of phosphate ions from aqueous solution by fly ash, slag, ordinary portland cement and related blends. Cement and Concrete Research, 2002, Vol 32, 1889-1897. [21] Schwertmann U, Schulze D.G and Murad E. Identification of Ferrihydrite in Soils by Dissolution Kinetics, Differential X-ray Diffraction, and Mössbauer Spectroscopy. Soil Sci. Soc. Am. J, 1982,Vol. 46. [22] Rose Seth and Ghazi Mohamad A. Release of sorbed sulfate from iron oxyhydroxides precipitated from acid mine drainage associated with coal mining. Environ. Sci. Technol, 1997, 31, 2136-2140. [23] Mattigod Shas V. and Ervin O. Jarel. Scheme for density separation of compound forms in size fractionated fly ash. Fuel, 1983, Vol 62. [24] McCarty K. Douglas, Johnnie N. Moore and W. Andrew Marcus. Mineralogy and trace element association in an acid mine drainage iron oxide precipitate; Comparison of selective extractions. Applied Geochemistry, 1998, Vol 13, 165-176. [25] Schulze D.G. Identification of soil iron oxides minerals by differential X-ray diffraction. Soil. Sci. Soc. Am. J., 1981, Vol. 45. [26] Dold Bernhard. Dissolution kinetics of schwertmannite and ferrihydrite in oxidized mine samples and their detection by differential X-ray diffraction (DXRD). Applied Geochemistry 2003 [27] Uhlmann W, H. Buttcher, O. Totsche, and C.E.W. Steinberg. Buffering of Acidic Mine Lakes: The Relevance of Surface Exchange and Solid bound Sulphate. Mine Water and Environment. 2004, 23: 20-27. [28] Jackson M.L., Lim C.H. and Zelazny L.W. Oxides, hydroxides and aluminosilicates. In Methods of Soil Analysis, Part 1, Physical and Mineralogical Methods, ed. A Klute, 2nd Edn, Chap. 6, pp. 101-150. Agronomy Monograph no. 9, Am. Soc. Agron. 1986, Soil Sci. Soc. Am., Madison, WI. [29] Parkhurst, D.L. User's guide to PHREEQC--A computer program for speciation, reactionpath, advective-transport, and inverse geochemical calculations: U.S. Geological Survey WaterResources Investigations Report. 1995, 95-4227, 143 p. [30] Muller, J., Seiler, K.P. Relevance of self-sealing processes in pyrite sinters for heavy metal mobility. In: Armanson, A.H. (Ed), 5th Symposium in Geochemistry of the Earth’s surface Balkema, Rotterdam, 1999, pp. 211-214. [31] Shuman L.M. Separating Soil Iron and Manganese oxide fractions for Micro-element analysis. Soil, Sci, Soc Am J. 1982, 46: 1099-1102. [32] Crouse, H.L. and A.W. Rose. Natural beneficiation of acid mine drainage by interaction with stream water and stream sediment. In: 6th Symposium on Coal Mine Drainage Research, National Coal Association/Bituminous Coal Research, 1976, Inc., pp. 237-269. [33] Seth Rose and W. Crawford Elliot. The effects of pH regulation upon the release of sulfate from ferric precipitates formed in acid mine waters. Applied Geochemistry, 2000, 15, 27-34.
[34] Doye Isabelle and Duchesne Josee. Neutralization of acid mine drainage with alkaline
industrial residues: Laboratory investigation using batch-leaching tests. Applied Geochemistry
2003, 18: 1197-1213
[35] American Society for Testing and Materials. Standard specification for fly ash and raw or
calcined natural pozzolan for use as a mineral admixture in Portland cement concrete. 1988,
C618-88. ASTM, Philadelphia, PA.
[36] Ricoh, P., Lecuyer, I and Le. Cloirec, P. Removal of Cu2+, Zn2+ and Pb2+ by adsorption
onto fly ash and fly ash/lime mixture. Water Science and Technology, 1999, Vol 39, 239-247.
[37] Scott, K.M. Solid solution in, and classification of gossan-derived members of the alunite
jarosite family, northwest Queensland, Australia. Am. Mineral. 1987, 72, 178-187.
[38]. Akira Iwashita, Yuka Sakaguchi, Tsunenoni Nakajima, Hirokazu Tokanashi, Akira Oliki,
Shinji Kambara. Leaching characteristics of boron and selenium for various coal fly ashes. Fuel,
2005, 84: 479- 485.
[39]. Kitano Yasushi, Minoru Okumura and Masatoshi Idogaki. Co-precipitation of borate-boron
with calcium carbonate. Geochemical Journal. 1978, Vol 12, pp 183-189.
[40] Van der hoek E.E, Comans R.N.J. Environ, Sci. Technol. 1996, Vol 30: 517-523.
[41] Brittons H.T.S. Hydrogen ions, fourth edition. 1956, Chapman and Hall, London.
[42] Stoessell, R.K. 25oC and 1 atm dissolution experiments of sepiolite and kerolite.
Geochimica et Cosmochimica. Acta, 1988, 52, 365-374.
[43] William R. Roy and Robert A. Griffin. Illinois Basin Coal Fly Ashes. 2. Equilibria
Relationships and qualitative modeling of Ash-water reactions. Environ. Sci. Technol, 1984, Vol
18, No 10.
[44] Stumm, W and Lee, G.F. Oxygenation of Ferrous iron. Industrial and Engineering
Chemistry, 1961, 53(2), 143-146.
[45] Seth Rose and W.Crawford Elliot. The effects of pH regulation upon the release of sulfate
from ferric precipitates formed in acid mine drainage. Applied Geochemistry, 2000, 15, 27-34
[46] Webster, J.G; Swedlund, P.J., Webster, K.S. Trace metal adsorption onto an acid mine
drainage iron (iii) oxyhydroxy sulfate. Environ. Sci. Technol, 1998, 32, 1361-1368.
[47] Kooner Z.S. Comparative study of adsorption behavior of copper, lead, and zinc onto
goethite in aqueous systems. Environmental Geology, 1993, vol 21, 242-250.