remote sensing Article
Minimizing the Residual Topography Effect on Interferograms to Improve DInSAR Results: Estimating Land Subsidence in Port-Said City, Egypt Ahmed Gaber 1, * 1 2
*
ID
, Noura Darwish 1 and Magaly Koch 2
Geology Department, Faculty of Science, Port-Said University, Port-Said 42522, Egypt;
[email protected] Center for Remote Sensing, Boston University, Boston, MA 02215, USA;
[email protected] Correspondence:
[email protected]
Academic Editor: Richard Gloaguen Received: 22 May 2017; Accepted: 18 July 2017; Published: 21 July 2017
Abstract: The accurate detection of land subsidence rates in urban areas is important to identify damage-prone areas and provide decision-makers with useful information. Meanwhile, no precise measurements of land subsidence have been undertaken within the coastal Port-Said City in Egypt to evaluate its hazard in relationship to sea-level rise. In order to address this shortcoming, this work introduces and evaluates a methodology that substantially improves small subsidence rate estimations in an urban setting. Eight ALOS/PALSAR-1 scenes were used to estimate the land subsidence rates in Port-Said City, using the Small BAse line Subset (SBAS) DInSAR technique. A stereo pair of ALOS/PRISM was used to generate an accurate DEM to minimize the residual topography effect on the generated interferograms. A total of 347 well distributed ground control points (GCP) were collected in Port-Said City using the leveling instrument to calibrate the generated DEM. Moreover, the eight PALSAR scenes were co-registered using 50 well-distributed GCPs and used to generate 22 interferogram pairs. These PALSAR interferograms were subsequently filtered and used together with the coherence data to calculate the phase unwrapping. The phase-unwrapped interferogram-pairs were then evaluated to discard four interferograms that were affected by phase jumps and phase ramps. Results confirmed that using an accurate DEM (ALOS/PRISM) was essential for accurately detecting small deformations. The vertical displacement rate during the investigated period (2007–2010) was estimated to be −28 mm. The results further indicate that the northern area of Port-Said City has been subjected to higher land subsidence rates compared to the southern area. Such land subsidence rates might induce significant environmental changes with respect to sea-level rise. Keywords: field calibrated DEM; SBAS DInSAR; land-subsidence; Port-Said City; Egypt
1. Introduction 1.1. SAR Interferometry Differential Interferometry Synthetic Aperture Radar (DInSAR) is a technique which can measure the vertical ground movement of an area in millimeter accuracy [1]. In the last decade a number of Synthetic Aperture Radar (SAR) space-borne satellites have been launched and operated using different wavelengths and polarizations. These repeat-pass interferometric SAR (InSAR) systems have repeatedly proven their efficiency due to their high precision and high spatial resolution [1–3]. When the SAR system images the ground, both amplitude (strength) and phase (time) of the backscattered signals are recorded by the receiving antenna. By computing the phase difference
Remote Sens. 2017, 9, 752; doi:10.3390/rs9070752
www.mdpi.com/journal/remotesensing
Remote Sens. 2017, 9, 752
2 of 22
from two SAR images acquired at different times, it is possible to generate a radar interferogram, which contains information about the (static) topography and any displacement in the slant range direction that may have occurred between the two SAR image acquisition dates. Radio interferometry was developed after the Second World War. U.S. military performed the first experiments with airborne radar (SAR) interferometry for topographic mapping in 1971 as reported by Graham in 1974 [4] who used two vertically deployed antennas to record the relative phase difference of the backscattered signals. The application of interferometry derived from satellite data using the repeat-pass method, where the satellite revisits an acquisition area after a certain period, was first demonstrated by Li and Goldstein using historic Seasat data [5]. The main focus of radar interferometry in early applications was on topographic estimation, yielding elevation accuracies comparable with optical methods. A problem in those early applications was that for an effective baseline larger than zero, the topographic signal was always mixed with the deformation signal. A suitable solution to this problem was differential interferometry, where the topographic signal obtained from a so-called reference elevation model was scaled to the baseline conditions of the deformation interferogram and subtracted from it, yielding a differential interferogram [6]. The first demonstration of differential radar interferometry for mapping the displacement field of the Landers earthquake was reported by Massonnet et al. [7]. It follows that an accurate reference digital elevation model is crucial to minimize the effect of the residual topography and improve the generated interferograms, and thus, enhance the final DInSAR results. Most of the different factors limiting interferometry applications are related to ground surface features and the geometry of radar acquisitions [8]. The interferogram shows the phase difference (φ), which represents the difference in distance measured in the radar line of sight (LOS) and includes mainly topography, orbital shifting, surface deformation, and atmospheric effects: ∆∅ = ∆∅Topo + ∆∅Defo + ∆∅Atm + ∆∅Noise
(1)
Several sources of uncertainty arise when calculating the deformation of the surface between the two acquisitions, namely (∅Deformation ), (∅Topography ) which is related to errors in the topographic model, (∅Orbit ) represents the orbital errors, (∅Noise ) represents the total noise introduced due to the instrument and (∅Atmosphere ) is related to errors produced by atmospheric delay mainly caused by the differences in tropospheric water vapor content between scenes at low surface elevations [9]. SAR Interferometry (InSAR) calculates the difference of the phases of two SAR images acquired over the same point from two different positions in space and at different times. Differential interferometry (DInSAR) provides an accurate surface deformation by subtracting the topographic phase from SAR interferograms using an independent DEM, as performed in this study or from another InSAR image depending on the method the interferograms were generated. There are different methodologies in differential interferometry (e.g., two-pass, three-pass, and four-pass interferometry) and with relatively new advanced algorithms (e.g., the Permanent Scatterers (PS) and the Small BAseline Subset (SBAS)) [9–11]. These techniques enable the mapping of subtle vertical surface movements (e.g., due to subsidence) down to millimeters [12–17]. In this study, the differential synthetic aperture radar interferometry technique (DInSAR), using the Small BAseline Subset (SBAS) algorithm [11] was used to monitor the land subsidence rates in Port-Said City of Egypt, in an attempt to obtain precise detection of land deformation of the study area. 1.2. Land Subsidence in the Nile Delta The Nile Delta of Egypt is among the most densely populated agricultural areas in the world, with 1360 inhabitants per km2 [18]. Its coastline is about 400 km long, from Alexandria in the west to Port-Said and the outlet of the Suez Canal in the east. The low elevation and flat relief of the Nile Delta make it a vulnerable area which is easily subjected to different environmental hazards such as shoreline retreat and sea level rise [19–24]. The combination of land subsidence and sea level rise in
Remote Sens. 2017, 9, 752
3 of 22
coastal areas may result in serious problems and has a significant and direct impact on the economy, environment and society [22,25,26]. Hereher [22] stated that around one quarter of the Nile Delta’s area would be flooded if the Remote Sens. 2017, 9, 752 3 of 21 sea-level raises 1 m. Consequently, over two million people would be enforced to abandon their homes and around 214,000 jobs andthat over US $35 billion in of land property, and tourism would besealost [27]. Hereher [22] stated around one quarter the value, Nile Delta’s area would be flooded if the Furthermore, and Clemente that the construction of new dams intheir the upper level raisesStanley 1 m. Consequently, over[26] two add million people would be enforced to abandon homes Nile Basinand willaround only exacerbate by value, reducing Nile water and sediment to 214,000 jobsthe andproblem over US of $35subsidence billion in land property, and tourism would besupply lost [27]. Furthermore, Stanley and Clemente [26] add that the construction of new dams in the upper the lower Nile Basin and Egypt’s delta margin. Consequently, updated maps of the Nile Delta and Nile Basin only exacerbate the problem subsidence by reducing Nile water and sediment coastal cities of will Egypt provide decision makersofwith useful information for integrated development supply to the lower Nile Basin and Egypt’s delta margin. Consequently, updated maps of the Nile and sustainable use of natural resources. Delta and coastal cities of Egypt provide decision makers with useful information for integrated Numerous studies have recorded the vertical land subsidence velocities of the Nile Delta by development and sustainable use of natural resources. using in situ observations [23,26,28–32] as well as remote sensing techniques [15,19,33–40]. Across Numerous studies have recorded the vertical land subsidence velocities of the Nile Delta by the northern Delta, about 87[23,26,28–32] continuousas sediment drill cores from the National Museum of Natural using in situ observations well as remote sensing techniques [15,19,33–40]. Across the History (NMNH) ofabout the Smithsonian Institution provide estimates of its subsidence northern Delta, 87 continuous sedimentwere drill used cores to from the National Museum of Natural [41]. TheseHistory drill cores are between 10 and 45 m long were and used weretorecovered along transects across[41]. the Nile (NMNH) of the Smithsonian Institution provide estimates of its subsidence DeltaThese at intervals of 5are to between 15 km [41]. The45average ground movement rate was recorded as over drill cores 10 and m long vertical and were recovered along transects across the Nile Delta atacross intervals 5 toDelta, 15 kmwhile [41]. The average vertical movement rate was recorded 4 mm/year theof Nile the maximum rates ground of subsidence were estimated at theas east of over 4 mm/year across the Delta,down-stream while the maximum rates of subsidence were estimated at the and the Damietta promontory (theNile eastern branch of the River Nile). Recently, Stanley east of[26] thereported Damiettathat promontory (the eastern down-stream branch of estimated the River Nile). Clemente the maximum subsidence rates have been as 8.4Recently, mm/year in Stanley and Clemente [26] reported that the maximum subsidence rates have been estimated as 8.4 the NE Delta. The highest subsidence velocities were attributed to the major eastern Mediterranean mm/year in the NE Delta. The highest subsidence velocities were attributed to the major eastern fault system with accelerated velocities attributed to the thick belt of Holocene sediments (Figure 1). Mediterranean fault system with accelerated velocities attributed to the thick belt of Holocene This unique geological has important on subsidence ratesoninsubsidence Port-Saidrates City and sediments (Figure 1).setting This unique geological implications setting has important implications will be discussed in a later section. in Port-Said City and will be discussed in a later section.
Figure 1. The top map shows the average thickness of Holocene sediments in the northern delta
Figure 1. The top map shows the average thickness of Holocene sediments in the northern delta (modified after Stanley and Clemente, [26]) and the bottom map shows the regional structural setting (modified after Stanley and Clemente, [26]) and the bottom map shows the regional structural setting of the northern Nile Delta (modified after Mosconi et al. [42]). of the northern Nile Delta (modified after Mosconi et al. [42]).
Becker and Sultan [19] used a set of 14 ascending ERS-1 and ERS-2 satellite radar images of the Nile Delta covering period to ascending 1999 to estimate theand landERS-2 subsidence rates. Theyimages reportedof the Becker and Sultanthe [19] usedfrom a set1992 of 14 ERS-1 satellite radar the maximum vertical subsidence velocity as ranging from 6 to 8 mm/year. The study concluded Nile Delta covering the period from 1992 to 1999 to estimate the land subsidence rates. They that reported the maximum rates of subsidence correlate with relatively recent deposition and distribution of the maximum vertical subsidence velocity as ranging from 6 to 8 mm/year. The study concluded that young sediments [19]. In another study, a total of 46 descending SAR scenes were used for measuring
Remote Sens. 2017, 9, 752
4 of 22
the maximum rates of subsidence correlate with relatively recent deposition and distribution of young sediments [19]. In another study, a total of 46 descending SAR scenes were used for measuring land Remote Sens. 2017, 9, 752 4 of 21 subsidence rates on the north portion of the Nile Delta [39]. Scene acquisition dates range from 1992 to 2000 covering a time span approximately In this study, the delta was subdivided intofrom three land subsidence rates onofthe north portion 8ofyears. the Nile Delta [39]. Scene acquisition dates range tracks, i.e., northwestern, north-central, and northeastern tracks. 1992 to 2000 covering a time span of approximately 8 years. In this study, the delta was subdivided into three tracks, i.e., northwestern, north-central, and rate northeastern tracks. In the northwestern track, the maximum measured of uplift was 12.6 mm/year and maximum In rate the of northwestern track,11.0 themm/year maximum measured of upliftvelocity was 12.6 mm/year andfor measured subsidence was with average rate subsidence of 0.7 mm/year maximum measured rate of subsidence was 11.0 mm/year with average subsidence velocity of 0.7 the entire section. In the north-central track, the maximum measured rate of uplift was 12.7 mm/year mm/year for the entire section. In the north-central track, the maximum measured rate of uplift was and maximum measured rate of subsidence was 16.8 mm/year. In the northeastern track, the 12.7 mm/year and rate maximum measured rate of subsidence was 16.8 mm/year.rate In of thesubsidence northeastern maximum calculated of uplift was 4.1 mm/year and maximum calculated was track, the maximum calculated rate of uplift was 4.1 mm/year and maximum calculated rate of 10.2 mm/year. subsidence was 10.2 mm/year. Repeated GPS observations for six stations over the Nile Delta covering the period from 2012 to Repeated GPS observations for six stations over the Nile Delta covering the period from 2012 to 2015 were compiled, processed, and analyzed to estimate the land subsidence rate by Hoda et al. [32]. 2015 were compiled, processed, and analyzed to estimate the land subsidence rate by Hoda et al. [32]. Results of the Hoda et al. [32] study show that land subsidence exists in Port Said and Tanta (Figure 2), Results of the Hoda et al. [32] study show that land subsidence exists in Port Said and Tanta (Figure while the remaining four stations of the Nile Delta show uplift with vertical land movements ranging 2), while the remaining four stations of the Nile Delta show uplift with vertical land movements from +4.9 to −6.5 mm/year, while the horizontal ground movements vary from 4.2 to 6.6 mm/year in ranging from +4.9 to −6.5 mm/year, while the horizontal ground movements vary from 4.2 to 6.6 the northeast direction [32]. mm/year in the northeast direction [32].
Figure 2. Land subsidence rate for six six stations stationsover overthe theNile NileDelta Delta Figure 2. Land subsidence rateusing usingrepeated repeatedGPS GPSobservations observations for (Modified after Hoda et al. [30]). (Modified after Hoda et al. [30]).
precise geodetic measurementshave havebeen beenconducted conducted within NoNo precise geodetic measurements within Port-Said Port-SaidCity Citytotoestimate estimatethe the modern land subsidence rate using the Differential Interferometry SAR method. The only modern land subsidence rate using the Differential Interferometry SAR method. The onlydetailed detailed work been conducted farininthis thisarea areawas wasperformed performed by work thatthat hashas been conducted sosofar by Gaber Gaberet etal. al.[43] [43]where wherethey theyused used the DInSAR technique based on a reference DEM derived from freely available SRTM data, which the DInSAR technique based on a reference DEM derived from freely available SRTM data, which has has limited vertical and horizontal accuracy. The other few existing DInSAR studies in the Delta limited vertical and horizontal accuracy. The other few existing DInSAR studies in the Delta region region do not cover Port-Said City, even though it is considered as one of the most important coastal do not cover Port-Said City, even though it is considered as one of the most important coastal cities cities in Egypt. The motivation to extend our previous work [43] was driven by the need to improve in Egypt. The motivation to extend our previous work [43] was driven by the need to improve the the generated interferograms by minimizing the effect of the residual topography component in order generated interferograms by minimizing the effect of the residual topography component in order to obtain more precise subsidence measurements. Thus, in this work, a field calibrated and more to obtain more precise subsidence measurements. Thus, in this work, a field calibrated and more accurate reference DEM was derived from the ALOS/PRISM sensor for Port-Said City with its almost accurate reference DEM was derived the ALOS/PRISM sensor for Port-Said with its almost flat topography, resulting in muchfrom higher accuracies for land subsidence ratesCity than previously flatpossible topography, resulting in much higher accuracies for land subsidence rates than previously possible by applying the differential interferometry SAR method. by applying the differential interferometry SAR method.
Remote Sens. 2017, 9, 752 Remote Sens. 2017, 9, 752
5 of 22 5 of 21
2. Materials and Methods 2.1. Study Study Area Area and and Geological Geological Setting Setting 2.1. Port-Said Governorate northeastern side the Nile Nile Delta Delta extending extending about about 30 30 km km along along Port-Said Governorate lies lies in in the the northeastern side of of the ◦ 000 N and 31◦ 200 N, the coast of the Mediterranean Sea and north of the Suez Canal between latitudes 31 the coast of the Mediterranean Sea and north of the Suez Canal between latitudes 31°00′N and and longitudes 32◦ 000 E and32°00′E 32◦ 300 Eand (Figure 3). The Governorate is bounded by the 31°20′N, and longitudes 32°30′E (Figure 3). The Governorate is Mediterranean bounded by Sea the from the north, Sea Lakefrom Manzala from Lake the west, Lakefrom Malaha east, and has a total about Mediterranean the north, Manzala thefrom west,the Lake Malaha from the area east, of and has 2 with an approximate population of 517,216 [44]. 1351 km a total area of about 1351 km2 with an approximate population of 517,216 [44].
Figure 3. High spatial resolution WorldView-2 image of Port-Said and Port-Fuad. Figure 3. High spatial resolution WorldView-2 image of Port-Said and Port-Fuad.
The geology of Port-Said is composed of thick layers of sands and pebbles at its base (Pleistocene The geology of Port-Said is composed thick sands layers and of sands andfrom pebbles at itsfloods base Mit Ghamr Formation) which are overlain byofcoastal deposits the Nile (Pleistocene Mit Ghamr Formation) which are overlain by coastal sands and deposits from the Nile (Holocene Bilqas Formation) [45]. The plate tectonic development of the eastern Mediterranean plays floods (Holocene Bilqas Formation) [45]. The plate tectonic development of the eastern Mediterranean an important role in shaping the Nile Delta region. It is bounded by the northern margin of the plays anPlate, important in shaping the subduction Nile Delta region. It is bounded by the northern margin of the the African whichrole extends from the zone adjacent to the Cretan and Cyprus arcs to African Plate, which extends from the subduction zone adjacent to the Cretan and Cyprus arcs to the Red Sea where it drifted apart from the Arabian plate. Red Sea it drifted from the by Arabian plate. earthquakes along existing minor faults. The Thewhere Nile Delta has apart been affected small-scale The Nile been affectedmap) by small-scale along existing Pelusium Line Delta Fault has (Figure 1 bottom is the mainearthquakes structural feature along theminor studyfaults. area, The Pelusium Line Fault (Figure 1 bottom map) is the main structural feature along the studyofarea, trending NE to SW and bounding the eastern part of Port Said City [29,46,47]. The implications the trending NE to SW and bounding the eastern part of Port Said City [29,46,47]. The implications of the Pelusiac Fault system on current subsidence rates in Port-Said City are largely unknown although Pelusiac Fault system on current subsidence rates in Port-Said City are largely unknown although there might be a possible contribution by this fault system. there might be a possible contribution by this fault system. 2.2. Field Work 2.2. Field Work This work builds on and significantly refines previous work done by Gaber et al. [43] in several This work builds on and significantly refines previous work done by Gaber et al. [43] in several aspects. For instance, a significantly higher number of 347 well distributed Ground Control Points aspects. For instance, a significantly higher number of 347 well distributed Ground Control Points (GCPs) were collected from the field (Figure 4). The increased number of GCPs was necessary to (GCPs) were collected from the field (Figure 4). The increased number of GCPs was necessary to improve the accuracy of calculated ground elevations. Leveling instrument (Sokkia B40) together improve the accuracy of calculated ground elevations. Leveling instrument (Sokkia B40) together with with the GPS (Leica viva GS15) were used define field points as reference GCPs to convert the height the GPS (Leica viva GS15) were used define field points as reference GCPs to convert the height values values of the ALOS/PRISM derived DEM for Port-Said from relative to absolute values. GPS (Leica of the ALOS/PRISM derived DEM for Port-Said from relative to absolute values. GPS (Leica viva viva GS15) was used for calculating two Bench Marks (BM), one of them in Port-Said at 31°15′31.32′′N and 32°16′35.83′′E and another one in Port-Fouad at 31°14′46.59′′N and 32°18′54.66′′E (Figure 4).
Remote Sens. 2017, 9, 752
6 of 22
GS15) was used for calculating two Bench Marks (BM), one of them in Port-Said at 31◦ 150 31.3200 N Remote Sens. 2017, 9, 752 6 of 21 and 32◦ 160 35.8300 E and another one in Port-Fouad at 31◦ 140 46.5900 N and 32◦ 180 54.6600 E (Figure 4). Precision Precisionleveling leveling(Sokkia (SokkiaB40) B40)was wasconducted conductedto toachieve achieveprecision precisionmeasurements measurementsin invertical verticalheight height and horizontal distance resolutions with respect to the BM (Figure 4). and horizontal distance resolutions with respect to the BM (Figure 4).
Figure 4. Two benchmarks (BM) were used as reference points for the 347 GCPs. Figure 4. Two benchmarks (BM) were used as reference points for the 347 GCPs.
2.3. DEM Generation from ALOS/PRISM Data 2.3. DEM Generation from ALOS/PRISM Data In order to obtain precise detection of land deformation of Port-Said area with millimeter In order to obtain precise detection of land deformation of Port-Said area with millimeter accuracy accuracy through the DInSAR technique, a very accurate DEM with proper spatial resolution should through the DInSAR technique, a very accurate DEM with proper spatial resolution should be used be used to minimize the effect of the residual topography on the generated interferograms [48]. to minimize the effect of the residual topography on the generated interferograms [48]. Previous Previous DInSAR subsidence studies of the Nile Delta have used widely available DEMs such as DInSAR subsidence studies of the Nile Delta have used widely available DEMs such as SRTM and SRTM and ASTER as reference DEMs with low spatial resolution and low height accuracy [19,39,43]; ASTER as reference DEMs with low spatial resolution and low height accuracy [19,39,43]; consequently, consequently, accurate elevation values and deformation results were not possible to achieve. As accurate elevation values and deformation results were not possible to achieve. As shown in Equation shown in Equation (1), generating an accurate DEM is very important for accurate estimation of the (1), generating an accurate DEM is very important for accurate estimation of the topographic model topographic model (∅ ) and thus detection of small deformations. (∅Topography ) and thus detection of small deformations. In this work, a stereo pair of ALOS/PRISM (nadir and backward) images acquired on the 9th of In this work, a stereo pair of ALOS/PRISM (nadir and backward) images acquired on the September 2014 over Port-Said City with a wavelength range of 0.52 to 0.77 μm, level 1B2R (geo9th of September 2014 over Port-Said City with a wavelength range of 0.52 to 0.77 µm, level reference data), and gain mode 2, was used to generate an accurate DEM with 2.5 m spatial resolution. 1B2R (geo-reference data), and gain mode 2, was used to generate an accurate DEM with 2.5 m It should be noted that ALOS/PRISM data are available for the entire world at moderate costs. spatial resolution. It should be noted that ALOS/PRISM data are available for the entire world at Extracting a DEM from a stereo pair of ALOS/PRISM data requires image processing software [49], moderate costs. Extracting a DEM from a stereo pair of ALOS/PRISM data requires image processing and is a multi-step decision making process involving the setting of many parameters. They are software [49], and is a multi-step decision making process involving the setting of many parameters. briefly summarized here. They are briefly summarized here. During the epipolar generation process, the nadir viewing image was used as the left stereo pair During the epipolar generation process, the nadir viewing image was used as the left stereo pair while the backward viewing image was used as the right stereo pair. To define the relationship while the backward viewing image was used as the right stereo pair. To define the relationship between between the two stereo images and get an absolute DEM, 50 ground control points (GCPs) and 23 tie the two stereo images and get an absolute DEM, 50 ground control points (GCPs) and 23 tie points points were used with 0.825 maximum y parallax (maximum displacement of pixels between two were used with 0.825 maximum y parallax (maximum displacement of pixels between two images in y images in y direction). Subsequently the epipolar geometry was calculated and generated direction). Subsequently the epipolar geometry was calculated and generated automatically by the automatically by the ENVI software. It is very important to re-project the stereo pair so that the left ENVI software. It is very important to re-project the stereo pair so that the left and right images have and right images have a common orientation. The DEM generation was carried out using epipolar a common orientation. The DEM generation was carried out using epipolar images to minimize the images to minimize the effect of noise in the PRISM data. To validate the quality of the generated effect of noise in the PRISM data. To validate the quality of the generated DEM from ALOS/PRISM DEM from ALOS/PRISM stereo-pair of Port-Said City, two different tests were carried out: (1) checking the quality of the generated DEM with 16 field collected GCPs; and (2) comparing it with the widely available SRTM DEM. It was found that the accuracy of the output ALOS/PRISM DEM was significantly higher than the SRTM one with a RMS error of 2.598 m. This finding is further
Remote Sens. 2017, 9, 752
7 of 22
stereo-pair of Port-Said City, two different tests were carried out: (1) checking the quality of the generated DEM with 16 field collected GCPs; and (2) comparing it with the widely available SRTM DEM. It was found that the accuracy of the output ALOS/PRISM DEM was significantly higher than the SRTM one with a RMS error of 2.598 m. This finding is further elaborated in Section 3 (Results). Such obtained accuracy is consistent with [50] results that evaluated the accuracy of the generated DEMs from ALOS/PRISM at Kanagawa Prefecture (Japan), and found that the vertical accuracy ranges Remote Sens. 2017, 9, 752 7 of 21 from 2 m (plain area) to 5 m (mountainous area) with a horizontal accuracy of around 10 m. elaborated in Section 3 (Results). Such obtained accuracy is consistent with [50] results that evaluated
2.4. ALOS/PALSAR Processing the accuracy ofData the generated DEMs from ALOS/PRISM at Kanagawa Prefecture (Japan), and found that the vertical accuracy ranges from 2 m (plain area) to 5 m (mountainous area) with a horizontal
The differential synthetic aperture radar interferometry technique (DInSAR), using the Small accuracy of around 10 m. BAseline Subset (SBAS) algorithm [11] was performed to monitor the land subsidence rates in Port-Said ALOS/PALSAR Data City of 2.4. Egypt. The same setProcessing of eight ALOS/PALSAR images that were used in Gaber et al., 2014 (observation number 608 and center frame number 610), covering periodusing from November The differential synthetic aperture radar interferometry technique the (DInSAR), the12Small ◦ incident 2007 toBAseline 4 April Subset 2010 were used from [11] an ascending orbit right looking mode rates and in 34.3 (SBAS) algorithm was performed to with monitor the land subsidence PortSaid City of Egypt. The same set of eight ALOS/PALSAR images that were used in Gaber et al., 2014 angle. PALSAR data were obtained in FBS (Fine Beam Single polarization observation mode with (observation with number 608 spatial and center frame number 610),ground coveringsurface the period from 12 November 2007 used to HH polarization) high resolution on the (about 7 m), and were to 4 April 2010 were used from an ascending orbit with right looking mode and 34.3° incident angle. estimate the required displacements information (Table 1). These eight ALOS/PALSAR images were PALSAR data were obtained in FBS (Fine Beam Single polarization observation mode with HH converted from thewith Committee on resolution Earth Observing System (CEOS) format Single Complex polarization) high spatial on the ground surface (about 7 m),to and were Look used to format (SLC). Thereafter the ALOS/PALSAR data were clipped to the area of interest in Port-Said City estimate the required displacements information (Table 1). These eight ALOS/PALSAR images were from the Committee on Earth System (CEOS) Look to focusconverted on the urban areas only which haveObserving high coherence pixels format valuestotoSingle reduce theComplex computational format5(SLC). Thereafter theprocessing ALOS/PALSAR data were clipped thestudy area ofusing interest Port-Said time. Figure summarizes the workflow applied in to this theinSBAS module. City to focus on the urban areas only which have high coherence pixels values to reduce the computational Figure 5 summarizes the processing applied in this study the Table 1. The time. ALOS/PALSAR data characteristics (noteworkflow that TB of 2009 images is veryusing large). SBAS module.
Year 2007 2008 2009 2010
Date Day/Month Perpendicular Baseline (m) Critical Baseline (m) Temporal Baseline (Days) Table 1. The ALOS/PALSAR data characteristics (note that TB of 2009 images is very large). 12 November 501.919 13,066.59 46 Year 28 Date Day/Month Perpendicular Baseline (m) Critical Baseline (m) Temporal Baseline (Days) December 12 November 2007 14 November 28 December 30 December 14 November 2008 28December May 30 17 November 28 May 2009 November 217January 2April January 4 2010 4 April
501.919
13,066.59
46
631.823
13,059.13
46
631.823 828.926
828.926
620.006
620.006
13,059.13 13,054.03
13,054.03
13,071.28
13,071.28
46 184
184 92
92
Figure 5. Applied processing workflow in this study using the DInSAR/SBAS module.
Figure 5. Applied processing workflow in this study using the DInSAR/SBAS module. The correlation between the two complex SAR images decreases systematically with increasing baseline length between until it completely disappearsSAR [51]. images The critical baselinesystematically is the baseline length for The correlation the two complex decreases with increasing which the two SAR images become completely decorrelated. Thus, calculating perpendicular, baseline length until it completely disappears [51]. The critical baseline is the baseline length for which temporal and critical baseline were necessary to examine the validity of DInSAR and can be expressed the twomathematically SAR images become completely decorrelated. Thus, calculating perpendicular, temporal and for flat surfaces using the following equation [52,53]:
Remote Sens. 2017, 9, 752
8 of 22
critical baseline were necessary to examine the validity of DInSAR and can be expressed mathematically for flat surfaces using the following equation [52,53]: Remote Sens. 2017, 9, 752
B⊥crit
λr tan(θi ) = 0 mδ(r )
8 of 21
=
(2) (2)
where the carrier wavelength is λ, r0 is the slant range, the incident angle θi and the effective critical wavelength is λ, perpendicular r is the slant range, the incident θ andδthe effective baselinewhere B⊥critthe arecarrier all defined in a plane to the flight paths.angle Therefore, slant-range r is the critical baseline B definedto in two a plane to the flight each paths.radar Therefore, δ isisthe are all equal resolution and m is the factor forperpendicular a repeat-pass, where image acquired slant-range resolution and m is the factor equal to two for a repeat-pass, where each radar image is with its own illuminator. Based on the previous equation, the SLC PALSAR image, which had been acquired with its own illuminator. Based on the previous equation, the SLC PALSAR image, which acquired on 14 November 2008, was chosen automatically as the super master image by generating a had been acquired on 14 November 2008, was chosen automatically as the super master image by connection grapha between the eightbetween ALOS PALSAR images using the SARscape software. Figure 6 generating connection graph the eight ALOS PALSAR images using the SARscape shows software. the relative positions of the used slave SAR with respect therespect supertomaster position, Figure 6 shows the relative positions of theimages used slave SAR imagesto with the super master and wasand used to understand and evaluate the connections the slave and Every and was used position, to understand evaluate the connections between the slavebetween and master images. master images. Every acquisition should be connected with others and if a group of acquisitions acquisition should be connected with others and if a group of acquisitions cannot be connected to the cannot be connected to the main network, all the acquisitions belonging to this group are discarded. main network, all the acquisitions belonging to this group are discarded. For this reason, it is suggested For this reason, it is suggested to collect images at regular time intervals with small baselines (Figure to collect images at regular time intervals with small baselines (Figure 6). All slant ranges of the eight 6). All slant ranges of the eight PALSAR images were co-registered with super master geometry, PALSAR images wereasco-registered with super master geometry, which was used as reference image. which was used reference image.
Figure 6. Plots show: time versus relative position (top); and time versus perpendicular baseline
Figure 6. Plots show: time versus relative position (top); and time versus perpendicular baseline (bottom). Selected acquisitions are displayed as green points and the super master as yellow. (bottom). Selected acquisitions are displayed as green points and the super master as yellow. During the interferometric generation stage, it is important to define the slant range multi-look. This typically calculated in generation order to obtain an almost square pixeltoofdefine the same It Duringis the interferometric stage, it is important thesensor slantresolution. range multi-look. is necessary to work with a multi-look image greater than 1:1 to increase the signal to noise ratio This is typically calculated in order to obtain an almost square pixel of the same sensor resolution. (SNR) of the interferograms and provide a robust coherence estimation and speed up the processing It is necessary to work with a multi-look image greater than 1:1 to increase the signal to noise ratio of large areas.
(SNR) of the interferograms and provide a robust coherence estimation and speed up the processing of large areas.
Remote Sens. 2017, 9, 752 Remote Sens. 2017, 9, 752
9 of 22 9 of 21
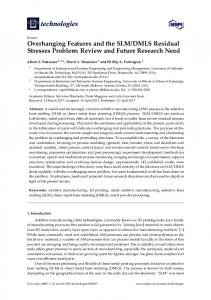
Each master and slave SAR images acquired with a certain temporal separation were combined Each22 master and slave SAR images acquired with configuration a certain temporal separation were combined to generate interferograms. Ideally, a zero-baseline would result in interferograms to generate 22 interferograms. zero-baseline configuration would in interferograms whose phase information would Ideally, only bearelated to the LOS displacement in result the scene. The orbit error whose phase information would only be related the LOS displacement in theanalysis, scene. The orbit contribution and atmospheric parameter ∆∅Atm to were corrected during SAR and theerror phase contribution andby atmospheric parameter ∆∅ The were corrected duringwas SAR analysis, phase noise was reduced applying an adaptive filter. orbital correction carried out and afterthe processing was into reduced by applying adaptive The baseline orbital correction carried out afterthe thenoise SAR data displacement timeanseries usingfilter. the small approach was of [11]. In addition, processing the SAR data into displacement time series using the small baseline approach of [11].initial In atmospheric correction was performed by estimating the statistical properties of SAR signals. An the atmospheric correction was estimating the statistical properties of SAR setaddition, of 22 wrapped interferogram-pairs wasperformed generatedbyduring the interferometric generation stage, signals. An initial set of 22 wrapped interferogram-pairs was generated during the interferometric and wrapped interferogram-pairs were subsequently filtered and used together with the coherence generation stage, and wrapped interferogram-pairs were subsequently filtered and used together data to calculate the phase unwrapping. The wrapped interferograms were analyzed in order to with the coherence data to calculate the phase unwrapping. The wrapped interferograms were discover unwanted behaviors or data problems (Figure 7) such as inaccurate orbits, un-coherent pairs, analyzed in order to discover unwanted behaviors or data problems (Figure 7) such as inaccurate atmospheric artifacts, phase jumps, phase ramps, etc. orbits, un-coherent pairs, atmospheric artifacts, phase jumps, phase ramps, etc.
Figure 7. (a) Wrapped interferogram phase with strong phase ramp (mostly in range direction) Figure 7. (a) Wrapped interferogram phase with strong phase ramp (mostly in range direction) originated from the orbit inaccuracies, together with a large atmospheric artifacts (master; 14 originated from the orbit inaccuracies, together with a large atmospheric artifacts (master; 14 November November 2008 and slave; 28 May 2009); (b) wrapped interferogram phase in high coherent area with 2008 and slave; 28 May 2009); (b) wrapped interferogram phase in high coherent area with small small atmospheric artifacts (master; 14 November 2008 and slave; 12 November 2007); and (c) well atmospheric artifacts (master; 14 November 2008 and slave; 12 November 2007); and (c) well unwrapped phase in high coherent areas (master; 14 November 2008 and slave; 4 April 2007). unwrapped phase in high coherent areas (master; 14 November 2008 and slave; 4 April 2007).
The wrapped interferograms with strong residual phase ramps originated from the orbit inaccuracies, together with large atmospheric artifacts were phase corrected by removing the residual phase The wrapped interferograms with strong residual ramps originated from the orbit frequency. The very large temporal or perpendicular baseline between the two acquisitions, inaccuracies, together with large atmospheric artifacts were corrected by removing the residual especially the SAR was acquiredorinperpendicular 2009 (Table 1)baseline resulted between in generating a total of four phase frequency. Thedata verythat large temporal the two acquisitions, wrappedthe interferograms withwas veryacquired low coherence and(Table these pairs were discarded. Small aatmospheric especially SAR data that in 2009 1) resulted in generating total of four artifactsinterferograms and phase jumps were removed during the refinement andwere the re-flattening steps.atmospheric The phase wrapped with very low coherence and these pairs discarded. Small unwrapping was performed and the 18 unwrapped interferogram pairs were evaluated to discard artifacts and phase jumps were removed during the refinement and the re-flattening steps. The phase the interferograms that were affected by large phase jumps and ramps. Subsequently, the 18 well-
Remote Sens. 2017, 9, 752
10 of 22
unwrapping was performed and the 18 unwrapped interferogram pairs were evaluated to discard the interferograms that were affected by large phase jumps and ramps. Subsequently, the 18 Remote Sens. 2017, 9, 752 10 of 21 well-unwrapped interferograms were chosen for further processing for estimating subsidence rate. Unwrapped interferogram phases were refined and re-flattened by the residual phase method to unwrapped interferograms were chosen for further processing for estimating subsidence rate. estimate and remove the remaining phase constants and phase ramps, in order to relate the changes in Unwrapped interferogram phases were refined and re-flattened by the residual phase method to slantestimate range toand theremove deformation only (due toconstants subsidence). the remaining phase and phase ramps, in order to relate the changes Therefore, about well distributed GCPs with an RMS horizontal error of 0.029 m were selected in slant range to the50deformation only (due to subsidence). aboutthe 50 unwrapped well distributed GCPs with animages RMS horizontal of 0.029the m were selectedphase to refine Therefore, and re-flatten interferogram in ordererror to remove remaining to refine and re-flatten the unwrapped interferogram images in order to remove the remaining phase and phase ramps (Figure 8). The ALOS/PRISM generated DEM was used as a reference DEM because and phase ramps (Figure 8). The ALOS/PRISM generated DEM was used as a reference DEM because of its high accuracy. The locations of the selected GCPs were carefully chosen on the geocoded of its high accuracy. The locations of the selected GCPs were carefully chosen on the geocoded unwrapped phase interferogram so that they would not be located in the residual topography fringes, unwrapped phase interferogram so that they would not be located in the residual topography fringes, phase jumps or displacement fringes. Only four reference points from the selected 50 GCPs were used phase jumps or displacement fringes. Only four reference points from the selected 50 GCPs were in this study and theirand displacement are assumed to beto0.beThe locations of of these used in this study their displacement are assumed 0. The locations thesereference reference points points were selected the from unwrapped phase file based on theonfollowing criteria: (a) no phase jump ororramps; werefrom selected the unwrapped phase file based the following criteria: (a) no phase jump (b) no residual topography fringes; and (c) no displacement fringes if known. Thus, the final DInSAR ramps; (b) no residual topography fringes; and (c) no displacement fringes if known. Thus, the final output measurements are relativeare torelative these selected reference points points [54]. [54]. DInSAR output measurements to these selected reference
Figure 8. (a) Unwrapped interferogram before the refinement and re-flattening steps (master; 14
Figure 8. (a) Unwrapped interferogram before the refinement and re-flattening steps (master; November 2008 and slave; 12 November 2007); and (b) well-unwrapped interferogram after the 14 November 2008 and slave; 12 November 2007); and (b) well-unwrapped interferogram after the refinement and re-flattening steps. refinement and re-flattening steps.
The phase information of such refined unwrapped interferograms was converted into height to estimate theinformation residual topography. As phase information characterizes was the displacement of height the The phase of such refined unwrapped interferograms converted into to reflecting surface in the radial (line sight)information direction andcharacterizes land subsidence most likely in the vertical estimate the residual topography. Asof phase theisdisplacement of the reflecting direction, the LOS displacement was converted vertical displacement following surface in the radial (line of sight) direction and landinto subsidence is most likelyusing in thethe vertical direction, equation [55]: the LOS displacement was converted into vertical displacement using the following equation [55]: =
∆S =
∆R ( ) cosθ(inc)
(3)
(3)
where Δ is the surface displacement in the vertical direction, ∆ is the LOS displacement and ( ) is the incidence angle. Linear mode was used for first estimation of displacement rate, because there where ∆S is the surface displacement in the vertical direction, ∆R is the LOS displacement and θ(inc) is is no prior information about the displacement behavior of the study area. The resulting displacement the incidence angle. Linear mode was used for first estimation of displacement rate, because there is pattern using the first inversion step is affected by the atmospheric artifacts. However, by applying no prior information about the displacement behavior of the study area. The resulting displacement the second estimation inversion, these artifacts were minimized [54]. pattern using the step first provides inversiona more step isrefined affected by the atmospheric However, by applying the The next estimation of the velocity.artifacts. At this stage, the displacement second estimation inversion, these artifacts were minimized [54]. location and its spatial coverage can be already retrieved. The estimated residual topography may be The next provides a moreartifacts refinedorestimation of the thus velocity. At this functionality stage, the displacement affected bystep ramps, atmospheric other distortion, the wavelet can be usedand for correct residual topography estimation Since inThe thisestimated study the SBAS processing chain may location its spatial coverage can be already [54]. retrieved. residual topography was used the wrong residual topography will compromise final SBAS geocoding,can be be affected by[54], ramps, atmospheric artifacts or estimation other distortion, thus the the wavelet functionality horizontal shifts in the results. Thus the wavelet number of levels, which refers to the power chain usedcausing for correct residual topography estimation [54]. Since in this study the SBAS processing
Remote Sens. 2017, 9, 752
11 of 22
was used [54], the wrong residual topography estimation will compromise the final SBAS geocoding, causing horizontal shifts in the results. Thus the wavelet number of levels, which refers to the power of two bases, determines what is kept of the estimated residual topography [56]. Berardino et al. [11] Remote Sens. 2017, 9, 752 11 of 21 suggested setting this value as a function of the reference DEM (which was used for the interferogram flattening) resolution. of two bases, determines what is kept of the estimated residual topography [56]. Berardino et al. [11] suggested setting this value as a function the reference DEM (which was used for the Thus, the wavelet number used in thisofstudy was set to zero level because ofinterferogram the high fidelity of flattening) resolution. the reference DEM derived from ALOS/PRISM data. Due to the DEM’s high spatial resolution, its wavelet number used in this study was set to zero level because of the high fidelity of sensitivity isThus, largethe enough to estimate the average residual topography to almost 0 m with a standard the reference DEM derived from ALOS/PRISM data. Due to the DEM’s high spatial resolution, its deviation equal to 9.5 m (Figure 9a). Moreover, the accuracy of the SRTM DEM data was checked in sensitivity is large enough to estimate the average residual topography to almost 0 m with a standard order todeviation compareequal its results the9a). field calibrated ALOS/PRISM DEM. Thedata 0 wavelet numbers was to 9.5 mwith (Figure Moreover, the accuracy of the SRTM DEM was checked in also used with the SRTM data and average ALOS/PRISM residual topography tonumbers −52.5 m and high order to compare its results with showed the field calibrated DEM. The 0equal wavelet was also used withequal the SRTM datamand showed average residual the topography equal to −52.5 m and high standard deviation to 35.1 (Figure 9b). Meanwhile two wavelet numbers were also used to 35.1average m (Figureresidual 9b). Meanwhile the twoequal wavelet used with thestandard SRTM deviation data andequal showed topography tonumbers −1.5 mwere andalso high standard with the SRTM data and showed average residual topography equal to −1.5 m and high standard deviation equal to 25.03 m (Figure 9c). It is obviously clear that even after using large wavelet number deviation equal to 25.03 m (Figure 9c). It is obviously clear that even after using large wavelet number with thewith freely available SRTM data, thethePRISM with0 0wavelet wavelet number showed an improved the freely available SRTM data, PRISM data data with number showed an improved estimation for thefor average residual topography. estimation the average residual topography.
Figure 9. Statistic of the estimated residual topography: (a) using 0 wavelet numbers for the
Figure 9. Statistic of the estimated residual topography: (a) using 0 wavelet numbers for the ALOS/PRISM DEM, where the average residual topography becomes almost 0 m and the standard ALOS/PRISM DEM, where the average residual topography becomes almost 0 m and the standard deviation is significantly reduced and equal to 9.5 m; (b) using 0 wavelet for the SRTM DEM, where deviation is significantly andbecomes equal to−52.5 9.5 m; (b) using 0 wavelet the to SRTM DEM, the the average residualreduced topography m and standard deviationfor equal 35.1 m; and where (c) averageusing residual topography becomes 52.5 m and standard deviation to 35.1 m; and (c) using wavelet number equal to 2 for − the SRTM, where the average residual equal topography becomes −1.5 and highequal standard equal towhere 25.03 m. waveletm number to 2deviation for the SRTM, the average residual topography becomes −1.5 m and high standard deviation equal to 25.03 m.
Remote Sens. 2017, 9, 752
12 of 22
Remote Sens. 2017, 9, 752 Remote Sens. 2017, 9, 752
12 of 21 12 of 21
The using thethe Small Baseline Subset (SBAS) technique [11] The second secondestimation estimationofofthe thedisplacement displacement using Small Baseline Subset (SBAS) technique The secondtoestimation offinal the processed displacement using the time Small Baseline Subset (SBAS) technique was performed recover the displacement series from the atmospheric artifacts, [11] was performed to recover the final processed displacement time series from the atmospheric [11] was performed to recoverthreshold the final processed displacement time series from phase the atmospheric taking into account coherence to applied the inputtostack of thestack unwrapped (Figure 10). artifacts, taking intoa account a coherence applied threshold the input of the unwrapped phase artifacts, taking into account a coherence threshold applied to the inputthe stack of theprecision unwrapped phase Finally, all the obtained results were geocoded to adopt two constraints: velocity threshold (Figure 10). Finally, all the obtained results were geocoded to adopt two constraints: the velocity (Figure Finally, all the obtained To results weremeaningful geocoded tothresholds, adopt twoinconstraints: the velocity and the 10). height precision threshold. estimate terms of coverage and precision threshold and the height precision threshold. To estimate meaningful thresholds, in terms precision threshold and the height precision threshold. To estimate meaningful thresholds, in terms precision, theand statistic tool was used (Figure 11).used Consequently, velocity precision threshold value of coverage precision, the statistic tool was (Figure 11).the Consequently, the velocity precision of coverage and precision, the statistic tool was used (Figure 11).used Consequently, the velocity precision of seven and the height precision threshold value of three were (Figure 11). threshold value of seven and the height precision threshold value of three were used (Figure 11). threshold value of seven and the height precision threshold value of three were used (Figure 11).
Figure 10. 10. The The velocity velocity maps: maps: (a) (a) before; before; and and (b) (b) after after the the atmospheric atmospheric artifacts artifacts filtering filtering was was applied applied Figure Figure 10. The velocity maps: (a) before; and (b) after the atmospheric artifacts filtering was applied during the second estimation of the displacement. A strong displacement (brown) and the uplift during the second estimation of the displacement. A strong displacement (brown) and the uplift during the second estimation of the displacement. A strong displacement (brown) and the uplift (purple) can be noted here. These displacement maps were improved significantly compared to the (purple) can be noted here. These displacement maps were improved significantly compared to the (purple) can be noted here. These displacement maps were improved significantly compared to the obtained maps using the first estimation. obtained maps using the first estimation. obtained maps using the first estimation.
Figure 11. (a) Statistics histograms of velocity precision; and (b) the corresponding height precision. Figure 11. (a) Statistics histograms of velocity precision; and (b) the corresponding height precision. Figure 11. (a) Statistics histograms of velocity precision; and (b) the corresponding height precision.
The deformation component can be isolated from the non-deformation component by The deformation component can be isolated from the non-deformation component by addressing phase noise due to changing scattering properties over time. This is achieved by using the The deformation can be scattering isolated from the non-deformation addressing phase noisecomponent due to changing properties over time. Thiscomponent is achievedbybyaddressing using the phase noise behavior oftothe radar signals to select pixels with minimal decorrelation [57]. Pixels that retain phase dueof changing scattering properties overminimal time. This is achieved byPixels using that the retain phase phase behavior the radar signals to select pixels with decorrelation [57]. a high degree of correlation (high coherence) were used to show their subsidence. The first step of theofradar signals(high to select pixels with [57]. PixelsThe thatfirst retain abehavior high degree correlation coherence) wereminimal used to decorrelation show their subsidence. stepa output deformation results were calculated for all pixels, which show high and low coherence in high degree of correlation (high coherence) to show theirshow subsidence. The firstcoherence step output output deformation results were calculatedwere for used all pixels, which high and low in terms of signal phase behavior. Finally, the deformation of the pixels that have equal to or more than deformation results calculated forthe alldeformation pixels, which highthat andhave low coherence terms of terms of signal phasewere behavior. Finally, ofshow the pixels equal to orin more than (≥) 0.3 and 0.4 coherence values were calculated and plotted on the WorldView-2 optical satellite signal behavior. Finally, thewere deformation of and the pixels equal to or more thansatellite (≥) 0.3 (≥) 0.3 phase and 0.4 coherence values calculated plottedthat onhave the WorldView-2 optical images to accurately estimate the vertical and displacement rates and avoid theoptical man-made changes. and 0.4 coherence values were calculated plotted on the WorldView-2 satellite images images to accurately estimate the vertical displacement rates and avoid the man-made changes. to accurately estimate the vertical displacement rates and avoid the man-made changes. 3. Results 3. Results In recent years, a number of researchers have been interested in measuring land subsidence rates In recent years, a number of researchers have been interested in measuring land subsidence rates in the Nile Delta region by using radar interferometric techniques [15,19,31,38,39,43]. However, most in the Nile Delta region by using radar interferometric techniques [15,19,31,38,39,43]. However, most
Remote Sens. 2017, 9, 752
13 of 22
3. Results In recent years, a number of researchers have been interested in measuring land subsidence rates in the Nile Delta region by using radar interferometric techniques [15,19,31,38,39,43]. However, most of those studies were based on inaccurate topographic measurements introducing uncertainties in the resulting subsidence rates. Therefore, in this study we focus on modern land subsidence rates Remote Sens.as 2017, 9, 752 21 in Port-Said City measured using the SBAS DinSAR technique. DInSAR technique13isof becoming a very reliable quantitative geodetic for monitoring compared to other more simple of those studies were based ontool inaccurate topographic deformation, measurements introducing uncertainties in quantitative tools (leveling, GPS). SBAS a radarrates interferometric the resulting subsidencetotal rates. station Therefore,and in this studyFurthermore, we focus on modern landis subsidence in City measured using the SBAS DinSARof technique. DInSAR technique is becoming technique Port-Said that relies onasan appropriate combination differential interferograms createda very by SAR image reliable quantitative geodetic tool for monitoring deformation, compared to other more simple pairs characterized by a small orbital separation (baseline), which reduces the spatial decorrelation quantitative tools (leveling, total station and GPS). Furthermore, SBAS is a radar interferometric phenomena [11]. that relies on an appropriate combination of differential interferograms created by SAR technique In this study, thecharacterized land subsidence wasorbital calculated only(baseline), within the urban areas Port-Said City image pairs by a small separation which reduces theofspatial decorrelation phenomena where coherent pixels could be[11]. located to ensure that the obtained land subsidence results would In this study, the land subsidence was calculated only within the urban areas of Port-Said City be more accurate. Moreover, generating an accurate DEM was considered crucial to detect small where coherent pixels could be located to ensure that the obtained land subsidence results would be deformations moreaccurately. accurate. Moreover, generating an accurate DEM was considered crucial to detect small Figure 12 illustrates the comparison between the extracted DEM from ALOS/PRISM data with deformations accurately. 12 illustrates thein comparison DEM from withThe figure respect to theFigure calculated points the fieldbetween using the theextracted total station andALOS/PRISM the SRTMdata DEM. respect to the calculated points in the field using the total station and the SRTM DEM. The figure shows around 10 m height differences between the SRTM and PRISM DEM data. This is because the shows around 10 m height differences between the SRTM and PRISM DEM data. This is because the generatedgenerated DEM using has 2.5mmvertical vertical height accuracy, while DEMALOS/PRISM using ALOS/PRISM hasaround around 2.5 height accuracy, while the SRTMthe hasSRTM has around 16around m absolute vertical height accuracy around m relative vertical height [58]. accuracy [58]. 16 m absolute vertical height accuracyand and around 10 10 m relative vertical height accuracy
Figure 12.Figure Comparison of elevation values obtained from DEMs GCPs; 12. Comparison of elevation values obtained fromsatellite satellite derived derived DEMs at at 16 16 GCPs; (a) (a) SRTM SRTM vs. ALOS/PRISM; and (b) ALOS/PRISM vs. station total station measurements. vs. ALOS/PRISM; and (b) ALOS/PRISM vs. total measurements. The higher spatial resolution of the ALOS/PRISM DEM provides more surface variation details
The higher resolution ofshows the ALOS/PRISM DEM the provides more surface variation details than thespatial SRTM DEM. Figure 13 the differences between DEMs, i.e. the one derived from SRTM (Figure and 13 the shows one generated from ALOS/PRISM (Figure The i.e. estimated average than the SRTM DEM. 13a) Figure the differences between the 13b). DEMs, the one derived from residual topography and the standard deviation are clearly minimized using the field calibrated SRTM (Figure 13a) and the one generated from ALOS/PRISM (Figure 13b). The estimated average ALOS/PRISM data. Consequently, the corresponding estimated velocity was significantly improved residual topography the standard deviation are clearly minimized using the field calibrated by the adoptedand new method. ALOS/PRISM data. Consequently, the corresponding estimated velocity was significantly improved by the adopted new method.
Remote Sens. 2017, 9, 752 Remote Sens. 2017, 9, 752
14 of 22 14 of 21
Figure 13. Comparison of: (a) the SRTM derived DEM; and (b) the newly generated DEM from
Figure 13. Comparison of: (a) the SRTM derived DEM; and (b) the newly generated DEM from ALOS/PRISM of Port-Said City. ALOS/PRISM of Port-Said City. In this work, the 2009 SAR data pairs were not found appropriate for DInSAR applications due to their high temporal andwere changes in the urban areas. However, theapplications other DInSAR In this work, the 2009 decorrelation SAR data pairs not found appropriate for DInSAR due to pairs of 2007, 2008 and 2010 show well-defined fringes in filtered differential interferograms. their high temporal decorrelation and changes in the urban areas. However, the other DInSAR pairs of It can be clearly observed in Figure 14 that most of the subsidence rates are located in the 2007, 2008 and 2010 show well-defined fringes in filtered differential interferograms. northern part of Port-Said City, where dense buildings and skyscrapers are located, but some are in It be clearlypart observed in Figure 14subsidence that mostwas of checked the subsidence rates are located in the thecan southwestern of the study area. The in the field by observing many northern part Port-Said City, andposition skyscrapers are located, butstreet somelevel. are in the cracks in of the buildings andwhere their dense lower buildings ground level compared with the southwestern part of study area.(LOS) The deformation subsidence was in rate the field by observing many cracks Subsequently, thethe Line of Sight and checked subsidence for each of the fringes were finallylower the weighted average of subsidence continually the in thecalculated, buildings and and their ground level position comparedrate withwas the calculated street level.forSubsequently,
Line of Sight (LOS) deformation and subsidence rate for each of the fringes were calculated, and finally the weighted average of subsidence rate was calculated for continually subsiding areas, i.e., areas where overlapping fringes were seen in multiple interferograms. The subsidence rates were extracted
Remote RemoteSens. Sens.2017, 2017,9,9,752 752
15 15of of22 21
subsiding areas, i.e., areas where overlapping fringes were seen in multiple interferograms. The from the different interferograms, which years, and combined together to obtain subsidence rates were extracted from therepresent differentdifferent interferograms, which represent different years, the total subsidence rate affecting the study area. and combined together to obtain the total subsidence rate affecting the study area.
Figure 14. Vertical displacement in Port-Said City from: 2007/2008 (top); 2007/2009 (middle); and Figure 14. Vertical displacement in Port-Said City from: 2007/2008 (top); 2007/2009 (middle); 2007/2010 (bottom). The sequence shows that the subsidence rate along the different years is not and 2007/2010 (bottom). The sequence shows that the subsidence rate along the different years constant. is not constant.
Remote Sens. 2017, 9, 752
16 of 22
Remote Sens. 2017, 9, 752
16 of 21
Figure 14 shows that the vertical displacement mainly takes place in the northern part of the urban Figure 14 shows that the vertical displacement mainly takes place in the northern part of the area in Port Said City as well as in Port-Fuad. During the period from 2007 to 2008, the maximum urban area in Port Said City as well as in Port-Fuad. During the period from 2007 to 2008, the measured uplift rate was 6 mm/year with a maximum rate of 4 mm/year for 99% of all uplifted maximum measured uplift rate was 6 mm/year with a maximum rate of 4 mm/year for 99% of all areas. The maximum measured vertical subsidence rate was −11 mm/year with a maximum rate of uplifted areas. The maximum measured vertical subsidence rate was −11 mm/year with a maximum −9 mm/year for 99% of all subsidence areas. rate of −9 mm/year for 99% of all subsidence areas. From 2007 to 2009, the maximum measured uplift rate was 13 mm/year with a maximum rate From 2007 to 2009, the maximum measured uplift rate was 13 mm/year with a maximum rate of of 10 mm/year for 99% of all uplifted areas. The total measured vertical subsidence rate from 2007 10 mm/year for 99% of all uplifted areas. The total measured vertical subsidence rate from 2007 to to 2009 was −21.0 mm with a maximum rate of −19 mm for 99% of all subsidence areas (Figure 14). 2009 was −21.0 mm with a maximum rate of −19 mm for 99% of all subsidence areas (Figure 14). The The cumulative measurements of uplift rate from 2007 to 2010 were 18 mm with a maximum rate of cumulative measurements of uplift rate from 2007 to 2010 were 18 mm with a maximum rate of 16 16 mm for 99% of all uplifted areas. The total measured vertical subsidence rate from 2007 to 2010 was mm for 99% of all uplifted areas. The total measured vertical subsidence rate from 2007 to 2010 was −28.0 mm with a maximum rate of −25 mm for 99% of all subsidence areas (Figure 14). These measured −28.0 mm with a maximum rate of −25 mm for 99% of all subsidence areas (Figure 14). These rates of subsidence show the cumulative trend of the subsidence during the investigated period as measured rates of subsidence show the cumulative trend of the subsidence during the investigated well as the subsidence rate is not constant over the different years. period as well as the subsidence rate is not constant over the different years. Figures 15 and 16 show the estimated deformations at the high coherence pixels with values Figures 15 and 16 show the estimated deformations at the high coherence pixels with values ≥0.3 ≥0.3 and ≥0.4 and plotted on the WorldView-2 image. The obtained results were checked in the field and ≥0.4 and plotted on the WorldView-2 image. The obtained results were checked in the field by by locating, photographing and recording the coordinates of some deformed buildings in Port-Said locating, photographing and recording the coordinates of some deformed buildings in Port-Said City. City. Many buildings show their ground level at lower elevation than the street level and have cracks, Many buildings show their ground level at lower elevation than the street level and have cracks, which suggest that they have suffered from the land subsidence. Buildings affected by subsidence which suggest that they have suffered from the land subsidence. Buildings affected by subsidence and checked in the fields were plotted on the final land subsidence maps that were derived by using and checked in the fields were plotted on the final land subsidence maps that were derived by using SBAS DInSAR technique. The location of the affected buildings show high consistence with the SBAS SBAS DInSAR technique. The location of the affected buildings show high consistence with the SBAS DInSAR estimated results (Figure 17). DInSAR estimated results (Figure 17).
Figure 15. 15. The The average average vertical vertical ground ground motion motion velocities velocities from from 2007 2007 to to 2010 2010 of of pixels pixels with with coherence coherence Figure threshold ≥0.3. threshold ≥0.3.
Remote Sens. 2017, 9, 752
17 of 22
Remote Sens. 2017, 9, 752 Remote Sens. 2017, 9, 752
17 of 21 17 of 21
Figure 16. The average vertical ground motion velocities from 2007 to 2010 of pixels with coherence Figure Figure 16. 16. The The average average vertical vertical ground ground motion motion velocities velocities from from 2007 2007 to to 2010 2010 of of pixels pixels with with coherence coherence threshold threshold ≥0.4. ≥0.4. threshold ≥0.4.
Figure 17. Land-Subsidence map showing the locations of the affected buildings. Figure 17. 17. Land-Subsidence Land-Subsidence map map showing showing the the locations locations of of the the affected affected buildings. buildings. Figure
4. Discussion 4. Discussion Land subsidence in Port-Said is a growing concern because it will induce marked environmental Land subsidence in Port-Said a growing concern willininduce marked environmental changes particularly with respect toiscoastline retreat and because sea-levelitrise the Mediterranean Sea. Portchanges particularly with respect to coastline retreat and sea-level rise in the Mediterranean Sea. over PortSaid, one of the most important ports in Egypt, has witnessed significant urban development Said, one of the most important ports in Egypt, has witnessed significant urban development over the past century. Natural gas extraction in the northern part of the Delta and within the urban the past of century. Natural gas extraction in the in northern of the and natural within the urban footprint Port-Said has dramatically increased the last part decade. GasDelta pumping, sediment footprint of Port-Said has dramatically increased in the last decade. Gas pumping, natural sediment
Remote Sens. 2017, 9, 752
18 of 22
4. Discussion Land subsidence in Port-Said is a growing concern because it will induce marked environmental changes particularly with respect to coastline retreat and sea-level rise in the Mediterranean Sea. Port-Said, one of the most important ports in Egypt, has witnessed significant urban development over the past century. Natural gas extraction in the northern part of the Delta and within the urban footprint of Port-Said has dramatically increased in the last decade. Gas pumping, natural sediment compaction and seismic activities as well as the surface infrastructure (buildings density and height) are factors that might cause or accelerate the observed land subsidence. Furthermore, records from before the construction of Aswan High Dam show that the average sediment load arriving to the Mediterranean coast was 134 Million tons [59,60]. By the time the construction of the Aswan High Dam was finished in 1964, only 2% of the sediment load in the Nile River makes it through the dam, leaving 98% of the sediment entrapped behind the dam in Lake Nasser [28]. Thus, the construction of the Dam and barrages not only control the water flow, but also the sediment load delivered to the Nile Delta. In addition, future dams such as the construction of Ethiopia’s Grand Renaissance Dam (GERD) are expected to diminish Nile flow and sediment supply to Egypt’s delta region even further [26]. In this study the estimated land subsidence rate for Port-Said City was found to be consistent with previous research that have used a variety of techniques [19,23,26,28–30,32,39]. The results of this work show that the northern part of Port-Said (coastal area) is suffering the highest subsidence rates compared to other parts of the city. This might be due to the existence of numerous towers and high-rise buildings and road traffic as well as intensive urban expansions and offshore natural gas pumping not far from Port-Said’s coast. In addition, this part of the city is underlain by relatively thick compactable fine-grains sediments compared to the southern part. Port-Said City is located at the northeastern part of the Nile Delta and surrounded by two lagoons indicating in geological terms a clearly depositional environment. The proximity of Port-Said City to El-Manzala and El-Malaha lagoons implies the existence of shallow groundwater table conditions. The increased pressure applied to the ground by high-rise buildings may alter groundwater flow patterns and plays a very important role during the compaction of the upper sediments. Altered groundwater flow is restricted within compacted sediment areas where the land subsidence occurs. Regions without extensive development have not yet experienced groundwater flow alteration, thus resulting in observed land swelling. Thus, the uplifted areas identified in this work have been most probably caused by exceeding aquifer poroelasticity under the compaction forces of the urban buildings. Sediment compaction and swelling are the most common subsidence and uplifting mechanisms, respectively, and were both identified in this study. It follows that the compaction of the relatively young Holocene sediments is expected to be the dominant factor affecting subsidence rates. The identified pattern of the land subsidence rates has a strong spatial correlation with the distribution thickness of the Holocene sediments (Figure 1). These Holocene sediments reach a thickness of up to 47 m in the Port-Said area [41]. Stanley [41] stated that large scale tilting of the delta toward the northeast resulted in the deposition of thicker accumulations of Holocene sediments in the northern part of Port-Said City than any other parts of the Nile Delta. Moreover, active tectonic and seismicity events have also been suggested as a mechanism driving increased subsidence rates in Port-Said [26]. The combined effects of groundwater depletion, natural gas pumping and urban expansion may cause pronounced subsidence effects in large populated coastal cities such as Port-Said, especially if insufficient sediment supplies counteract the effect and hidden normal faults enhance the land surface drop. One such hidden fault is the Pelusiac Fault system (Figure 1 bottom) discussed in Section 2.1 (Study Area and Geological Setting). All aforementioned conditions support the importance of land subsidence estimations in Port-Said City to provide decision-makers with critical information for ensuring sustainable development and land-use.
Remote Sens. 2017, 9, 752
19 of 22
5. Conclusions Port-Said City is one of the most important coastal cities in Egypt. Located at northeastern side of the Nile Delta, it was chosen as a representative coastal city to estimate the modern land subsidence rate. Until now, no precise geodetic measurements have been conducted within Port-Said City to capture the present-day subsidence using the differential interferometry SAR method. In order to accurately estimate small subsidence rates, a very accurate DEM has to be used, thus a stereo pair of ALOS/PRISM data was used to generate a DEM with 2.5 m spatial resolution and ±2.5 m high vertical accuracy. A total of 347 well distributed Ground Control Points (GCPs) were collected in the field using leveling instrument and differential GPS in order to calibrate the height values of the generated DEM. Furthermore, the PRISM DEM was compared to the widely used SRTM DEM and the results showed a 10 m height differences with the PRISM DEM, which is matching the field GCP measurements. Such accurate DEM was used as a reference elevation model to minimize the effects of the residual topography and to improve the generated interferograms and consequently achieve more accurate DInSAR results. The total vertical subsidence rate during the investigated period from 2007 to 2010 was estimated to be −28 mm. The obtained results show that the northern part and coastal areas of Port-Said City exhibit the highest land subsidence rates compared to the southern part. This research found that subsidence estimations in Port-Said City as based on DInSAR data analysis after minimizing the effect of the residual topography, resulted in significantly improved rate estimations. Furthermore, such improved subsidence estimations correlated very well with known distribution of subsurface geology and structures as well as surface infrastructure (buildings density and height) providing valuable information on sediment compaction and swelling patterns to decision makers for sustainable development and land-use planning in Port-Said Governorate. Acknowledgments: The authors would like to thank the Japan Aerospace Exploration Agency (JAXA) for providing the ALOS data as part of the ALOS user agreement (ALOS-2 RA-1389). In addition, the authors would like to thank Sayed Madny from NARSS, Yasser Sultan from Port-Said University and Brian F. Thomas from University of Pittsburgh for their valuable comments. Further thanks are given to Ahmed El-Hatab and Ahmed El-Sharkawy from the Civil Engineering Department of Port-Said University as well as Rana El-Kady for their help and support in collecting the ground control points. Finally, the authors are very grateful for the very helpful suggestions made by the three reviewers. Author Contributions: Ahmed Gaber conceived and designed the experiments; Ahmed Gaber and Noura Darwish processed the data and performed the proposed methods; Ahmed Gaber and Magaly Koch interpreted the results; Ahmed Gaber wrote and Magaly Koch edited the manuscript; Ahmed Gaber carried out the editor and reviewers comments. Conflicts of Interest: The authors declare no conflict of interest.
References 1. 2. 3. 4. 5. 6. 7.
Bamler, R.; Hartl, P. Synthetic aperture radar interferometry. Inverse Probl. 1998, 14, R1–R54. [CrossRef] Hanssen, R.F. Radar Interferometry: Data Interpretation and Error Analysis; Springer Science & Business Media: Berlin, Germany, 2001; p. 307. Aly, M. Radar Interferometry for Monitoring Land Subsidence and Coastal Change in the Nile Delta, Egypt; Texas A&M University: College Station, TX, USA, 2006. Graham, L.C. Synthetic Interferometer Radar for Topographic Mapping. Proc. IEEE 1974, 62, 763–768. [CrossRef] Li, F.; Goldstein, R. Studies of multi-baseline spaceborne interferometric synthetic aperture radars. IEEE Trans. Geosci. Remote Sens. 1987, 28, 88–97. [CrossRef] Gabriel, A.K.; Goldstein, R.M.; Zebker, H.A. Mapping small elevation changes over large areas: Differential radar interferometry. J. Geophys. Res. Solid Earth 1989, 94, 9183–9191. [CrossRef] Massonnet, D.; Rossi, M.; Carmona, C.; Adragna, F.; Peltzer, G.; Feigl, K.; Rabaute, T. The displacement field of the Landers earthquake mapped by radar interferometry. Nature 1993, 364, 138–142. [CrossRef]
Remote Sens. 2017, 9, 752
8. 9. 10.
11.
12. 13. 14.
15. 16.
17.
18. 19. 20. 21. 22. 23. 24. 25. 26. 27. 28. 29. 30.
20 of 22
Henderson, F.M.; Lewis, A.J. Principles and Applications of Imaging Radar. Manual of Remote Sensing; John Wiley and Sons: Hoboken, NJ, USA, 1998; Volume 2. Massonnet, D.; Feigl, K.L. Radar interferometry and its application to changes in the Earth’s surface. Rev. Geophys. 1998, 36, 441–500. [CrossRef] Peltzer, G.; Hudnut, K.W.; Feigl, K.L. Analysis of coseismic surface displacement gradients using radar interferometry: New insights into the Landers earthquake. J. Geophys. Res. Solid Earth 1994, 99, 21971–21981. [CrossRef] Berardino, P.; Fornaro, G.; Lanari, R.; Sansosti, E. A new algorithm for surface deformation monitoring based on small baseline differential SAR interferograms. IEEE Trans. Geosci. Remote Sens. 2002, 40, 2375–2383. [CrossRef] Massonnet, D.; Feigl, K.; Rossi, M.; Adragna, F. Radar interferometric mapping of deformation in the year after the Landers earthquake. Nature 1996, 369, 227–230. [CrossRef] Smith, L.C. Emerging applications of interferometric synthetic aperture radar (InSAR) in geomorphology and hydrology. Ann. Assoc. Am. Geogr. 2002, 92, 385–398. [CrossRef] Chang, H.-C.; Ge, L.; Rizos, C. DInSAR for mine subsidence monitoring using multi-source satellite SAR images. In Proceedings of the International Geoscience and Remote Sensing Symposium, Seoul, Korea, 29 July 2005; p. 1742. Poscolieri, M.; Parcharidis, I.; Foumelis, M.; Rafanelli, C. Ground deformation monitoring in the greater Cairo metropolitan region (Egypt) by SAR interferometry. J. Environ. Semeiot. 2011, 4, 17–45. [CrossRef] Ng, A.H.-M.; Ge, L.; Li, X.; Abidin, H.Z.; Andreas, H.; Zhang, K. Mapping land subsidence in Jakarta, Indonesia using persistent scatterer interferometry (PSI) technique with ALOS PALSAR. Int. J. Appl. Earth Obs. Geoinf. 2012, 18, 232–242. [CrossRef] Yhokha, A.; Chang, C.-P.; Goswami, P.K.; Yen, J.-Y.; Lee, S.-I. Surface deformation in the Himalaya and adjoining piedmont zone of the Ganga Plain, Uttarakhand, India: Determined by different radar interferometric techniques. J. Asian Earth Sci. 2015, 106, 119–129. [CrossRef] Stanley, J.D.; Warne, A.G. Nile Delta in its destruction phase. J. Coast. Res. 1998, 1, 795–825. Becker, R.H.; Sultan, M. Land subsidence in the Nile Delta: Inferences from radar interferometry. Holocene 2009, 19, 949–954. [CrossRef] El-Nahry, A.H.; Doluschitz, R. Climate change and its impacts on the coastal zone of the Nile Delta, Egypt. Environ. Earth Sci. 2010, 59, 1497–1506. [CrossRef] El-Asmar, H.M.; Hereher, M.E.; El-Kafrawy, S.B. Threats facing lagoons along the north coast of the Nile Delta, Egypt. Int. J. Remote Sens. Appl. 2012, 2, 24–29. Hereher, M.E. Vulnerability of the Nile Delta to sea level rise: An assessment using remote sensing. Geomat. Nat. Hazard. Risk 2010, 1, 315–321. [CrossRef] Stanley, J.D.; Corwin, K.A. Measuring strata thicknesses in cores to assess recent sediment compaction and subsidence of Egypt’s Nile delta coastal margin. J. Coast. Res. 2012, 29, 657–670. [CrossRef] Shaltout, M.; Tonbol, K.; Omstedt, A. Sea-level change and projected future flooding along the Egyptian Mediterranean coast. Oceanologia 2015, 57, 293–307. [CrossRef] Nicholls, R.; Hoozemans, F. The Mediterranean: Vulnerability to coastal implications of climate change. Ocean Coast. Manag. 1996, 31, 105–132. [CrossRef] Stanley, J.D.; Clemente, P.L. Increased Land Subsidence and Sea-Level Rise are Submerging Egypt’s Nile Delta Coastal Margin. GSA Today 2017, 27, 4–11. [CrossRef] El-Raey, M. Vulnerability assessment of the coastal zone of the Nile delta of Egypt, to the impacts of sea level rise. Ocean Coast. Manag. 1997, 37, 29–40. [CrossRef] Stanley, J.D.; Warne, A.G. Nile Delta: Recent geological evolution and human impact. Science 1993, 260, 628–634. [CrossRef] [PubMed] Stanley, J.D.; Toscano, M.A. Ancient archaeological sites buried and submerged along Egypt’s Nile delta coast: Gauges of Holocene delta margin subsidence. J. Coast. Res. 2009, 25, 158–170. [CrossRef] Marriner, N.; Flaux, C.; Morhange, C.; Kaniewski, D. Nile Delta’s sinking past: Quantifiable links with Holocene compaction and climate-driven changes in sediment supply? Geology 2012, 40, 1083–1086. [CrossRef]
Remote Sens. 2017, 9, 752
31.
32.
33. 34. 35. 36. 37. 38. 39. 40. 41. 42.
43. 44. 45. 46. 47. 48. 49. 50. 51. 52. 53. 54. 55.
21 of 22
Flaux, C.; El-Assal, M.; Marriner, N.; Morhange, C.; Rouchy, J.-M.; Soulié-Märsche, I.; Torab, M. Environmental changes in the Maryut lagoon (northwestern Nile delta) during the last ∼2000 years. J. Archaeol. Sci. 2012, 39, 3493–3504. [CrossRef] Hoda, M.; Bahaa, S.; Magdy, H.; Gomaa, D. High-Precision GPS Monitoring of the Land Subsidence in the Nile Delta: Status and Preliminary Results. In Proceedings of the Regional Conference on Surveying & Development, Sharm El-Sheikh, Egypt, 2–6 October 2015; pp. 1–11. Frihy, O.E. Nile Delta shoreline changes: Aerial photographic study of a 28-year period. J. Coast. Res. 1988, 4, 597–606. Aly, M.; Zebker, H.; Giardino, J.; Klein, A. Permanent Scatterer investigation of land subsidence in Greater Cairo, Egypt. Geophys. J. Int. 2009, 178, 1238–1245. [CrossRef] Hooper, A.; Zebker, H.; Segall, P.; Kampes, B. A new method for measuring deformation on volcanoes and other natural terrains using InSAR persistent scatterers. Geophys. Res. Lett. 2004, 31. [CrossRef] Aly, M.; Klein, A.G.; Zebker, H.A.; Giardino, J.R. Land subsidence in the Nile Delta of Egypt observed by persistent scatterer interferometry. Remote Sens. Lett. 2012, 3, 621–630. [CrossRef] Klein, I.; Gessner, U.; Kuenzer, C. Regional land cover mapping and change detection in Central Asia using MODIS time-series. Appl. Geogr. 2012, 35, 219–234. [CrossRef] Bouali, E.H.Y. Utilizing Persistent Scatterer Interferometry to Investigate the Nature and Factors Controlling Nile Delta Subsidence. Master’s Thesis, University of Western Michigan, Kalamazoo, MI, USA, 2013; p. 425. Fugate, J.M. Measurements of Land Subsidence Rates on the North-Western Portion of the Nile Delta Using Radar Interferometry Techniques. Master’s Thesis, University of Toledo, Toledo, OH, USA, 2014; p. 76. Zaid, S.; Momoun, M.; Al-Mobark, N. Vulnerability assessment of the impact of sea level rise and land subsidence on north Nile Delta region. World Appl. Sci. J. 2014, 32, 325–342. Stanley, J.D. Nile delta: Extreme case of sediment entrapment on a delta plain and consequent coastal land loss. Mar. Geol. 1996, 129, 189–195. [CrossRef] Mosconi, A.; Rebora, A.; Venturino, G.; Bocc, P.; Khalil, M.H. Egypt—Nile Delta and North Sinai Cenozoic tectonic evolutionary model. In Proceedings of the 13th Egyptian General Petroleum Corporation Exploration and Production Conference, Cairo, Egypt, 21–24 October 1996; Volume 1. Gaber, A.; Darwish, N.; Sultan, Y.; Arafat, S.; Koch, M. Monitoring Building Stability in Port-Said City, Egypt Using Differential SAR Interferometry. Int. J. Environ. Sustain. 2014, 3, 14–22. [CrossRef] Port-Said Governorate Website. 2017. Available online: http://www.portsaid.gov.eg/mapsnew/sokan.aspx (accessed on 19 July 2017). Aly Ismail, A.; Abdel Kader Boukhary, M.; Ibrahim AbdelNaby, A. Subsurface stratigraphy and micropaleontology of the Neogene rocks, Nile Delta, Egypt. Geol. Croat. 2010, 63, 1–26. [CrossRef] Said, R. Introduction. In The Geological Evolution of the River Nile; Springer: Cham, Switzerland, 1981; pp. 1–11. Stanley, J.D.; Warne, A.G.; Schnepp, G. Geoarchaeological interpretation of the Canopic, largest of the relict Nile Delta distributaries, Egypt. J. Coast. Res. 2004, 20, 920–930. [CrossRef] Burgmann, R.; Rosen, P.A.; Fielding, E.J. Synthetic aperture radar interferometry to measure Earth’s surface topography and its deformation. Annu. Rev. Earth Planet. Sci. 2000, 28, 169–209. [CrossRef] ENVI. DEM Extraction Module; Harris Geospatial Solutions: Broomfield, CO, USA, 2017; Available online: https://www.harrisgeospatial.com/docs/IntroductionToDEMExtraction.html (accessed on 19 July 2017). Bignone, F.; Umakawa, H. Assessment of ALOS PRISM digital elevation model extraction over Japan, The International Archives of the Photogrammetry. Remote Sens. Spat. Inf. Sci. 2008, 37, 1135–1138. Mora, O.; Mallorqui, J.J.; Broquetas, A. Linear and nonlinear terrain deformation maps from a reduced set of interferometric SAR images. IEEE Trans. Geosci. Remote Sens. 2003, 41, 2243–2253. [CrossRef] Rodriguez, E.; Martin, J. Theory and design of interferometric synthetic aperture radars. IEE Proc. F Radar Signal Process. 1992, 139, 147–159. [CrossRef] Gatelli, F.; Guamieri, A.M.; Parizzi, F.; Pasquali, P.; Prati, C.; Rocca, F. The wavenumber shift in SAR interferometry. IEEE Trans. Geosci. Remote Sens. 1994, 32, 855–865. [CrossRef] SBAS Tutorial; Version 2; Sarmap SA: Purasca, Switzerland, 2013; p. 92. Zebker, H.A.; Goldstein, R.M. Topographic mapping from interferometric synthetic aperture radar observations. J. Geophys. Res. Solid Earth 1986, 91, 4993–4999. [CrossRef]
Remote Sens. 2017, 9, 752
56.
57. 58. 59. 60.
22 of 22
Rao, X.; Tang, Y. Small baseline subsets approach of DInSAR for investigating land surface deformation along the high-speed railway in SPIE Asia Pacific Remote Sensing. Int. Soc. Opt. Photonics 2014, 92601–92608. [CrossRef] Bekaert, D.; Walters, R.; Wright, T.; Hooper, A.; Parker, D. Statistical comparison of InSAR tropospheric correction techniques. Remote Sens. Environ. 2015, 170, 40–47. [CrossRef] JPL. SRTM Mission Statistics. 2017. Available online: https://www2.jpl.nasa.gov/srtm/statistics.html (accessed on 19 July 2017). Sharaf El Din, S. Effect of the Aswan High Dam on the Nile flood and on the estuarine and coastal circulation pattern along the Mediterranean Egyptian coast. Limnol. Oceanogr. 1977, 22, 194–207. [CrossRef] Abu-Zeid, M.; El-Shibini, F. Egypt’s high Aswan dam. Int. J. Water Resour. Dev. 1997, 13, 209–218. [CrossRef] © 2017 by the authors. Licensee MDPI, Basel, Switzerland. This article is an open access article distributed under the terms and conditions of the Creative Commons Attribution (CC BY) license (http://creativecommons.org/licenses/by/4.0/).