Abstract: A new technique is developed for phase adjustment in ISAR imaging. ... phase is found by iteratively solving an equation, which is derived by ...
Minimum-entropy phase adjustment for ISAR J. Wang, X. Liu and Z. Zhou Abstract: A new technique is developed for phase adjustment in ISAR imaging. The adjustment phase is found by iteratively solving an equation, which is derived by minimising the entropy of the image. This technique can be used to estimate adjustment phases of any form. Moreover, the optimisation method used in this technique is computationally more efficient than trial-and-error methods.
1
Introduction
Inverse synthetic aperture radar (ISAR) utilises the Fourier transform to resolve the scatterers in azimuth Before taking the Fourier transform, translation compensation is used to remove the effect of the translation between the radar and the target in range. Translation compensation consists of range alignment, which aligns the signals from the same scatterer in range, and phase adjustment, which removes the translational Doppler phase. Typical methods for phase adjustment include the dominant-scatterer method [1], the scattering-centroid method [2], the phase – gradient method [3, 4], the time – frequency method [5], the maximum-contrast method [6] and the minimum-entropy method [7, 8]. These methods apply even if no prior knowledge is available about the translation. The minimum-entropy method is a promising technique for phase adjustment [7, 8]. It uses the principle that when the image is focused, the entropy of the image is a minimum. Originally, this technique is implemented using a parametric method [7]. A parametric model is used for the adjustment phase, and the parameters of this model are estimated. However, depending on the translation between the radar and the target in range, the adjustment phase may take any form. The parametric method does not work well if the adjustment phase does not fit the assumed model. In order to remove this limitation, a nonparametric method is presented to implement the minimum-entropy phase adjustment [8]. This method does not assume any parametric model of the adjustment phase and thus applies universally. However, in this method, the optimisation problem is solved using a trial-and-error method, which is computationally inefficient. We develop a new technique for phase adjustment in ISAR imaging. The adjustment phase is found by iteratively solving an equation, which is derived by minimising the entropy of the image. This technique can be used to estimate adjustment phases of any form. Moreover, the optimisation method used in this technique is computationally more efficient than trial-and-error methods.
q IEE, 2004 IEE Proceedings online no. 20040692 doi: 10.1049/ip-rsn:20040692 Paper first received 11th December 2003 and in revised form 14th April 2004. Originally published online 21st July 2004 The authors are with Shanghai Jiaotong University, Haoran Building, 1954 Hua Shan Rd, Shanghai 200030, People’s Republic of China IEE Proc.-Radar Sonar Navig., Vol. 151, No. 4, August 2004
Some results of this work and related work have been given in [9 –11]. 2
Fundamentals of ISAR
ISAR uses the relative motion between the radar and the target to obtain the image of the target [12] In ISAR imaging, the radar can be ground-based, airborne or spaceborne. The platform can be stationary or moving. The beam tracks moving targets of interest. The targets range from man-made objects like ships, airplanes and satellites to natural objects like moons and planets. This paper treats ISAR. The ideas and methods discussed here, however, may also apply to some modes of synthetic aperture radar (SAR). Figure 1 gives a simplified geometry of ISAR. The co-ordinate system is chosen such that the origin is fixed at a point on the target and the y-axis is directed from the radar to this point. This co-ordinate system is also chosen as the frame of reference. Thus, no matter how the radar and the target move, only the rotation of the target around the origin and the translation of the radar along the yaxis are observed. We assume that the target is rigid and each scatterer has a constant scattering coefficient. It should be clarified that the target discussed here is actually the projection of the physical target on the imaging plane. We only consider the range – Doppler algorithm, which applies to small rotational angles [13]. For large rotational angles, typical algorithms include the subaperture algorithm, the subpatch algorithm, the polar-format algorithm and the back-projection algorithm [13].
2.1 Rotation-induced imaging First consider the rotation of the target around the origin only. The translation between the radar and the target in range is ignored in this analysis. The scatterers with different ranges are resolved using different time delays. A wideband technique such as the matched-filter technique, the stretch technique or the stepped-frequency technique can be used to improve range resolution [2, 12]. When the rotational angle of the target is small, it is assumed that the signals from the same scatterer are centred at the same range bin in different echoes (see Fig. 2; t and t are called slow time and fast time, respectively, and for clarity only the amplitude of the signal is shown). In each range bin (Fig. 2), the scatterers with different azimuths are resolved using different Doppler frequencies. The most widely used method is the Fourier transform. Other methods include modern spectral estimation [14] and time – frequency representation [15]. 203
Fig. 3
Range alignment
Typical methods include the peak method [1], the maximum-correlation method [1], the frequency-domain method [1], the Hough-transform method [16], the minimum-entropy method [8] and the global method [17]. Fig. 1
Geometry of ISAR
2.4 Phase adjustment The other effect of the translation is that a time-varying translational Doppler phase is contained in the phase of the signal. Usually, the Doppler frequency corresponding to a scatterer is not a constant any more due to the translational Doppler phase. This means that the image will be blurred if the Fourier transform is directly used for azimuth imaging. Thus, before taking the Fourier transform, the translational Doppler phase should be removed, converted to a constant or linearised so that the Doppler frequency corresponding to a scatterer can be converted into a constant. This is called phase adjustment. Typical methods for phase adjustment include the dominant-scatterer method [1], the scattering-centroid method [2], the phase – gradient method [3, 4], the time – frequency method [5], the maximum-contrast method [6] and the minimumentropy method [7, 8]. These methods apply even if no prior knowledge is available about the translation. 3
Fig. 2
Minimum-entropy phase adjustment
Range-resolved signal
2.2 Translation compensation Only the rotation of the target around the origin is considered in the above analysis. Now we add the translation between the radar and the target in range. Range imaging is the same. Azimuth imaging, however, is complicated. The effect of the translation must be removed before taking the Fourier transform. This is called translation compensation. Translation compensation consists of range alignment, which aligns the signals from the same scatterer in range, and phase adjustment, which removes the translational Doppler phase. We only discuss this two-step scheme of translation compensation. However, it should be mentioned that range alignment and phase adjustment can also be carried out together in the domain of slow time and the frequency with respect to fast time [12]. The minimumentropy translation compensation, which applies even if no prior knowledge is available about the translation, is essentially based on this scheme [12].
Phase adjustment and azimuth imaging can be formulated as � � M �1 X 2p ð1Þ f ðm; nÞ exp½ jjðmÞ� exp �j km gðk; nÞ ¼ M m¼0 where m, n and k are the indices of echoes, range bins and Doppler frequency, respectively, f(m, n) is the signal resolved and aligned in range, jðmÞ is the adjustment phase and g(k, n) is the complex image. In (1), phase adjustment is first carried out by multiplying f(m, n) by exp½ jjðmÞ� and azimuth imaging is then carried out by taking the Fourier transform of f ðm; nÞ exp½ jjðmÞ� with respect to m. The key to phase adjustment is the estimation of jðmÞ: In the minimum-entropy phase adjustment, jðmÞ is designed to minimize the entropy of jgðk; nÞj2 :
3.1 Principle The entropy of jgðk; nÞj2 is defined as e½jgðk; nÞj2 � ¼
M �1 X N �1 X k¼0
2.3 Range alignment One effect of the translation is that the signals from the same scatterer are centred at different range bins in different echoes. Thus, the echoes need to be shifted such that the signals from the same scatterer are aligned in range. This is called range alignment (see Fig. 3; for clarity, only the amplitude of the signal is shown). If no prior knowledge is available about the translation, range alignment is usually based on the similarity of the envelopes of the echoes. 204
jgðk; nÞj2 S ln S jgðk; nÞj2 n¼0
ð2Þ
where S¼
M �1 X N �1 X
jgðk; nÞj2
ð3Þ
k¼0 n¼0
Entropy can be used to measure the smoothness of a distribution function The smoother a distribution function is, the larger it entropy. Owing to this property, in ISAR imaging, entropy can be used to measure the focus quality of IEE Proc.-Radar Sonar Navig., Vol. 151, No. 4, August 2004
an image [7 – 11]. Better focus results in a sharper image and thus smaller entropy. Thus, in phase adjustment, the adjustment phase can be designed to minimise the entropy of the image. Equation (2) can be written as e½jgðk; nÞj2 � ¼ ln S �
aðmÞ ¼
N �1 X
f ðm; nÞ
n¼0
�1 X N �1 X 1M jgðk; nÞj2 ln jgðk; nÞj2 ð4Þ S k¼0 n¼0
M �1 X k¼0
1 M
� � 2p ½1 þ ln jgðk; nÞj2 �gðk; nÞ exp j km M ð13Þ
Substituting (12) into (6), one obtains Since S is a constant in ISAR imaging, entropy can be redefined as e0 ½jgðk; nÞj2 � ¼ �
M �1 X N �1 X
jgðk; nÞj2 ln jgðk; nÞj2
ð5Þ
k¼0 n¼0
Thus, the minimum-entropy phase adjustment can be formulated as finding the adjustment phase that minimises (5).
3.2 Equation of adjustment phase The jðmÞ that minimises e0 ½jgðk; nÞj2 � satisfies @e0 ½jgðk; nÞj2 � ¼0 @jðmÞ
ð6Þ
The derivative of e0 ½jgðk; nÞj2 � with respect to jðmÞ is obtained from (5), i e. M �1 X N �1 � X � @jgðk; nÞj2 @e0 ½jgðk; nÞj2 � ¼� 1 þ ln jgðk; nÞj2 @jðmÞ @jðmÞ k¼0 n¼0
ð7Þ Since jgðk; nÞj2 ¼ gðk; nÞg ðk; nÞ � � @jgðk; nÞj2 @gðk; nÞ ¼ 2Re g ðk; nÞ @jðmÞ @jðmÞ
¼ �2Re
M�1 N�1 � XX k¼0 n¼0
�
)
ð9Þ Substituting m0 for m in (1), one obtains gðk; nÞ ¼
ð15Þ
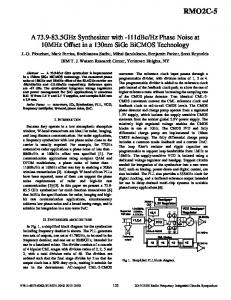
3.3 Algorithm Equation (15) is an implicit expression of jðmÞ because calculating a(m) requires jðmÞ (see (13) and (1)). This equation can be solved using the fix-point iteration algorithm in Fig. 4. jðmÞ is initialised as zero or the phase obtained by a simple phase-adjustment method like the dominantscatterer method [1]. Our tests show that this can usually guarantee the convergence of jðmÞ to the desired optimal value. Our tests involve about twenty sets of field data and simulated data. For each data set, jðmÞ is initialised as zero and the phase obtained by the dominant-scatterer method, respectively. jðmÞ converges to the desired optimal value in each of these tests. The convergence is faster when jðmÞ is initialised as the phase obtained by the dominant-scatterer method. The iteration is carried out until the following condition is satisfied: m¼0
@gðk; nÞ 1 þ ln jgðk; nÞj g ðk; nÞ @jðmÞ 2
jðmÞ ¼ ffaðmÞ
M�1
ð8Þ
ð14Þ
where l is an arbitrary integer and ffaðmÞ denotes the phase of a(m). The simplest form of (14), which works very well in our test, is
maxfj exp½ jji ðmÞ� � exp½ jji�1 ðmÞ�jg � m
Substituting (8) into (7), one obtains @e0 ½jgðk; nÞj2 � @jðmÞ (
jðmÞ ¼ lp þ ffaðmÞ
ð16Þ
where ji ðmÞ and ji�1 ðmÞ are the values of jðmÞ after the current iteration and the previous iteration, respectively, and m is the threshold of accuracy. Equation (16) is also written as
� �
ji ðmÞ � ji�1 ðmÞ
m M�1
� ð17Þ max sin
m¼0 2 2 If a jðmÞ minimises e0 ½jgðk; nÞj2 �; then this jðmÞ plus a linear phase can also minimise e0 ½jgðk; nÞj2 �: The reason is that this linear phase only results in a circular shift of the image in azimuth, but does not change e0 ½jgðk; nÞj2 �: Thus, there is an infinite number of jðmÞ that can minimise
� � 2p f ðm0 ; nÞ exp½ jjðm0 Þ� exp �j km0 ð10Þ M m0 ¼0 M �1 X
The derivative of g(k, n) with respect to jðmÞ is obtained from (10), i.e. � � @gðk; nÞ 2p ¼ jf ðm; nÞ exp½ jjðmÞ� exp �j km ð11Þ @jðmÞ M In order to obtain (11), it should be noted that m is only a sample of m0 here. Substituting (11) into (9), one obtains @e0 ½jgðk; nÞj2 � ¼ 2M Imfexp½ jjðmÞ�a ðmÞg @jðmÞ where IEE Proc.-Radar Sonar Navig., Vol. 151, No. 4, August 2004
ð12Þ Fig. 4 Estimation of jðmÞ 205
e0 ½jgðk; nÞj2 �; and what is obtained in this algorithm may be any of them. Since these different jðmÞ may result in different circular shifts of the image in azimuth, the azimuth position of the image is uncertain. In order to avoid this effect, the image is circularly shifted in azimuth to locate the strongest scatterer in the middle of the image. In our algorithm, jðmÞ is estimated from all the range bins. In order to improve the efficiency of the algorithm, jðmÞ can also be estimated from a part of the range bins. However, using too few range bins may degrade the focus quality of the image because the estimated adjustment phase is optimal only for the range bins in use but not for all the range bins.
E½jgðk; nÞj2 � is the mean of jgðk; nÞj2 with respect to k and n, i.e. E½jgðk; nÞj2 � ¼
�1 X N �1 X 1 M jgðk; nÞj2 MN k¼0 n¼0
s½jgðk; nÞj2 � is the standard deviation of jgðk; nÞj2 with respect to k and n, i.e. s½jgðk; nÞj2 � vffiffiffiffiffiffiffiffiffiffiffiffiffiffiffiffiffiffiffiffiffiffiffiffiffiffiffiffiffiffiffiffiffiffiffiffiffiffiffiffiffiffiffiffiffiffiffiffiffiffiffiffiffiffiffiffiffiffiffiffiffiffiffiffiffiffiffiffiffiffiffiffiffiffiffiffiffiffiffiffiffiffiffiffiffiffiffiffiffiffiffiffiffiffiffiffiffiffi " #2ffi u �1 X N �1 M �1 X N �1 u 1 M X X 1 jgðk; nÞj2 � jgðk0 ; n0 Þj2 ¼t MN k¼0 n¼0 MN k0 ¼0 n0 ¼0 ð20Þ
3.4 Comparison Originally, the minimum-entropy phase adjustment is implemented using a parametric method [7]. A parametric model is used for the adjustment phase, and the parameters of this model are estimated. However, depending on the translation between the radar and the target in range, the adjustment phase may take any form. The parametric method does not work well if the adjustment phase does not fit the assumed model. In order to remove this limitation, a nonparametric method is presented to implement the minimum-entropy phase adjustment [8]. First, jð0Þ is kept unchanged, decreased by D or increased by D based on which way minimises the entropy of the image, where D is the initial step size. Then, jð1Þ; jð2Þ; . . . ; jðM � 1Þ are treated in the same way to complete one round of adjustment. More rounds of adjustment are carried out until the entropy of the image is minimised. Next, the above process is repeated for step sizes D=2; D=4 and so on. This method does not assume any parametric model of the adjustment phase and thus applies universally. This trial-and-error method, however, is computationally inefficient. Each time when a sample of jðmÞ is adjusted, two imaging processes are required. Each round of adjustment thus requires 2M imaging processes. If there are L rounds of adjustments in all, the total number of imaging processes will be 2ML. The computation of an imaging process is given in (1). Our method is also nonparametric. Like the nonparametric method in [8], it does not assume any parametric model of the adjustment phase and thus applies universally. In addition, our optimisation method is computationally more efficient than the trial-and-error method in [8]. In our optimisation method, the computation in each round of adjustment, which is mainly the computation in (1) and (13), is approximately equivalent to that of two imaging processes. If there are L0 rounds of adjustments in all, the total number of imaging processes will be 2L0 : Generally, 2L0 is much smaller than 2ML, the total number of imaging processes required by the trial-and-error method in [8]. 4
Maximum-contrast phase adjustment
When the minimum-entropy method is discussed, the maximum-contrast method [6], a similar method, needs to be mentioned. This method uses the principle that the contrast of the image is a maximum when the image is focused.
4.1 Principle
206
s½jgðk; nÞj2 � E½jgðk; nÞj2 �
which is also written as s½jgðk; nÞj2 � vffiffiffiffiffiffiffiffiffiffiffiffiffiffiffiffiffiffiffiffiffiffiffiffiffiffiffiffiffiffiffiffiffiffiffiffiffiffiffiffiffiffiffiffiffiffiffiffiffiffiffiffiffiffiffiffiffiffiffiffiffiffiffiffiffiffiffiffiffiffiffiffiffiffiffiffiffiffiffiffiffiffiffiffiffiffiffiffiffiffiffiffiffiffiffiffi " #2 u �1 X N �1 �1 X N �1 u 1 M X X 1 M 4 2 t jgðk; nÞj � jgðk; nÞj ¼ MN k¼0 n¼0 MN k¼0 n¼0 ð21Þ Contrast can be used to measure the sharpness of a distribution function. The sharper a distribution function is, the larger its contrast. Due to this property, in ISAR imaging, contrast can be used to measure the focus quality of an image [6]. Better focus results in a sharper image and thus larger contrast. Thus, in phase adjustment, the adjustment phase can be designed to maximise the contrast of the image. Substituting (19) and (21) into (18), one obtains vffiffiffiffiffiffiffiffiffiffiffiffiffiffiffiffiffiffiffiffiffiffiffiffiffiffiffiffiffiffiffiffiffiffiffiffiffiffiffiffiffiffiffiffiffiffiffiffiffiffi u �1 X N �1 X uMN M jgðk; nÞj4 � 1 ð22Þ c½jgðk; nÞj2 � ¼ t 2 S k¼0 n¼0 Since S is a constant in ISAR imaging, contrast can be redefined as c0 ½jgðk; nÞj2 � ¼
M�1 N�1 XX
jgðk; nÞj4
ð18Þ
ð23Þ
k¼0 n¼0
Thus, the maximum-contrast phase adjustment can be formulated as finding the adjustment phase that maximises (23).
4.2 Algorithm The maximum-contrast phase adjustment can be implemented by a parametric method [6]. That is, a parametric model is used for the adjustment phase, and the parameters of this model are estimated. The parametric method fails if the adjustment phase does not fit the assumed model. Inspired by our minimum-entropy method (Section 3), we develop a new technique to carry out the maximum-contrast phase adjustment. The adjustment phase is found by iteratively solving an equation, which is derived by maximising the contrast of the image. This technique can be used to estimate adjustment phases of any form. The jðmÞ that maximises c0 ½jgðk; nÞj2 � satisfies @c0 ½jgðk; nÞj2 � ¼0 @jðmÞ
The contrast of jgðk; nÞj2 is defined as c½jgðk; nÞj2 � ¼
ð19Þ
ð24Þ
Using the method in Section 3.2, we can derive the equation of the adjustment phase, i.e. IEE Proc.-Radar Sonar Navig., Vol. 151, No. 4, August 2004
jðmÞ ¼ ffbðmÞ
ð25Þ
where � � �1 X 1M 2p 2 f ðm; nÞ jgðk; nÞj gðk; nÞ exp j km bðmÞ ¼ M k¼0 M n¼0 N �1 X
ð26Þ Then, an algorithm, which is similar to that in Section 3.3, can be developed for the maximum-contrast phase adjustment.
4.3 Comparison The maximum-contrast method converges faster than the minimum-entropy method. Under the same threshold of accuracy, the maximum-contrast method requires a smaller number of iterations than the minimum-entropy method. However, we notice that when the target has a dominant scatterer, the maximum-contrast method cares about the dominant scatterer too much. In the image obtained by the maximum-contrast method, most scatterers may not be as well focused as the dominant scatterer. The minimumentropy method, however, avoids this problem. It can attain a good compromise among all the scatterers and result in a globally good image. 5
and the threshold of accuracy is chosen as 0.01. Under these conditions, the numbers of iterations are 108, 90, 64 and 94 for the four data segments, respectively. When the adjustment phase is initialised as the phase obtained by the dominant-scatterer method [1], the numbers of iterations are reduced to 37, 26, 20 and 11 for the four data segments, respectively. Figure 6 shows the images obtained by the dominantscatterer method [1]. Due to the existence of a dominant scatterer, the dominant-scatterer method works well for these data. Nevertheless, as we see, its focus quality is inferior to that of the minimum-entropy method. Figure 7 shows the images obtained by the maximumcontrast method presented in Section 4. The adjustment phase is initialised as zero and the threshold of accuracy is chosen as 0.01. Under these conditions, the numbers of
Results
The field data of a Boeing-727 aircraft [18], provided by Prof. B. D. Steinberg of the University of Pennsylvania, are used to evaluate our method. The aircraft was 2.7 km away from the radar and flew at a speed of 147 m=s: The radar transmitted short pulses at a wavelength of 3.123 cm and a width of 7 ns, and the echoes were sampled at an interval of 5 ns. The pulse repetition frequency was 400 Hz. 512 echoes with 120 range bins each were recorded. The 512 echoes are divided into four equal segments, and each segment is processed individually. In all the imaging processes, range alignment is carried out by the global method [17]. Figure 5 shows the images obtained by the minimumentropy method. The adjustment phase is initialised as zero
Fig. 5 Images obtained by minimum-entropy method IEE Proc.-Radar Sonar Navig., Vol. 151, No. 4, August 2004
Fig. 6 Images obtained by dominant-scatterer method
Fig. 7 Images obtained by maximum-contrast method 207
Fig. 8 Images obtained by minimum-entropy method from simulated data
Fig. 10
iterations are 9, 17, 7 and 7 for the four data segments, respectively. This shows that the maximum-contrast method converges faster than the minimum-entropy method. However, as we see, the focus quality of the maximumcontrast method is inferior to that of the minimum-entropy method. When the numbers of iterations are further increased, no matter how big the numbers of iterations are, the images essentially keep unchanged and the focus quality is still inferior to that of the minimum-entropy method. In the above analysis, we use simple visual inspection to evaluate the performance of the minimum-entropy method, the dominant-scatterer method and the maximum-contrast method. It is applicable to these data. Further investigation needs to be carried out on the quantitative evaluation of these methods.
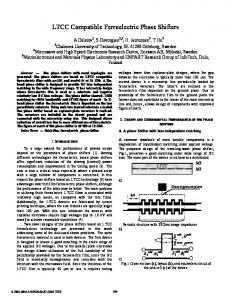
A sinusoidal translational Doppler phase is added to the phase of the original signal by simulation. Figure 8 shows the images obtained by the minimum-entropy method from these simulated data. We can see that the images are still focused. In fact, this algorithm is applied to about twenty sets of field data and simulated data and always works well. It does not assume any parametric model of the adjustment phase and applies universally. Figure 9 shows the images obtained by the minimumentropy method when m in (16), the threshold of accuracy, is chosen as 0.0123. The corresponding error of the adjustment phase, according to (17), is p=256: Figure 10 shows the images obtained by the minimum-entropy method in [8]. Here, the smallest step size of the adjustment phase is chosen as p=256: Under the same accuracy, for the four data segments, our method takes 1=98; 1=81; 1=120 and 1=64 as much time as the method in [8], respectively. Evidently, our method is computationally more efficient than the method in [8]. 6
Images obtained by minimum-entropy method in [8]
Conclusions
The minimum-entropy method is effective and efficient for phase adjustment in ISAR imaging. The adjustment phase is found by iteratively solving an equation, which is derived by minimising the entropy of the image. This technique can be used to estimate adjustment phases of any form. Moreover, the optimisation method used in this technique is computationally more efficient than trial-and-error methods. 7
Acknowledgments
The authors appreciate the valuable suggestions from Dr. Kasilingam of the University of Massachusetts, Dartmouth, USA. 8
Fig. 9 Images obtained by minimum-entropy method when m ¼ 0:0123 208
References
1 Chen, C.C., and Andrews, H.C.: ‘Target-motion-induced radar imaging’, IEEE Trans. Aerosp. Electron. Syst., 1980, 16, (1), pp. 2–14 2 Prickett, M.J., and Chen, C.C.: ‘Principle of inverse synthetic aperture radar (ISAR) imaging’. IEEE EASCON Record, Arlington, VA, USA, 1980, pp. 340–345 IEE Proc.-Radar Sonar Navig., Vol. 151, No. 4, August 2004
3 Eichel, P.H., Ghiglia, D.C., and Jakowatz, C.V.: ‘Speckle processing method for synthetic aperture radar phase correction’, Opt. Lett., 1989, 14, (1), pp. 1 –5 4 Wahl, D.E., Eichel, P.H., Ghiglia, D.C., and Jakowatz, C.V.: ‘Phase gradient autofocus-a robust tool for high resolution SAR phase correction’, IEEE Trans. Aerosp. Electron. Syst., 1994, 30, (3), pp. 827 –835 5 Barbarossa, S., and Farina, A.: ‘A novel procedure for detecting and focusing moving objects with SAR based on the Wigner-Ville distribution’. Proc. IEEE Int. Radar Conf., Arlington, VA, USA, 1990, pp. 44–50 6 Berizzi, F., and Corsini, G.: ‘Autofocusing of inverse synthetic radar images using contrast optimization’, IEEE Trans. Aerosp. Electron. Syst., 1996, 32, (3), pp. 1185–1191 7 Bocker, R.P., Henderson, T.B., Jones, S.A., and Frieden, B.R.: ‘A new inverse synthetic aperture radar algorithm for translational motion compensation’, Proc. SPIE – Int. Soc. Opt. Eng., 1991, 1569, pp. 298 –310 8 Li, X., Liu, G., and Ni, J.: ‘Autofocusing of ISAR images based on entropy minimization’, IEEE Trans. Aerosp. Electron. Syst., 1999, 35, (4), pp. 1240– 1251 9 Wang, J.: ‘Techniques for compensating effects of unknown motion in SAR/ISAR imaging’. Dissertation, University of Massachusetts, Dartmouth, MA, USA, 2001
IEE Proc.-Radar Sonar Navig., Vol. 151, No. 4, August 2004
10 Kasilingam, D., Wang, J., Lee, J., and Jensen, R.: ‘Focusing of synthetic aperture radar images of moving targets using minimum entropy adaptive filters’. Proc. IEEE Int. Geoscience and Remote Sensing Symp., Honolulu, HI, USA, 2000, vol. 1, pp. 74–76 11 Wang, J., Kasilingam, D., Liu, X., and Zhou, Z.: ‘ISAR minimum-entropy phase adjustment’. Proc. IEEE Radar Conf., Philadelphia, PA, USA, 2004, pp. 197– 200 12 Wehner, D.R.: ‘High resolution radar’ (Artech House, 1994, 2nd edn.) 13 Ausherman, D.A., Kozma, A., Walker, J.L., Jones, H.M., and Poggio, E.C.: ‘Development in radar imaging’, IEEE Trans. Aerosp. Electron. Syst., 1984, 20, (4), pp. 363–400 14 Pastina, D., Farina, A., Gunning, J., and Lombardo, P.: ‘Twodimensional super-resolution spectral analysis applied to SAR images’, IEE Proc., Radar Sonar Navig., 1998, 145, (5), pp. 281–290 15 Chen, V.C.: ‘Joint time-frequency transform for radar range-Doppler imaging’, IEEE Trans. Aerosp. Electron. Syst., 1998, 34, (2), pp. 486–499 16 Sauer, T., and Schroth, A.: ‘Robust range alignment algorithm via Hough transforms in an ISAR imaging system’, IEEE Trans. Aerosp. Electron. Syst., 1995, 31, (3), pp. 1173–1177 17 Wang, J., and Kasilingam, D.: ‘Global range alignment for ISAR’, IEEE Trans. Aerosp. Electron. Syst., 2003, 39, (1), pp. 351–357 18 Steinberg, B.D., and Subbaram, H.M.: ‘Microwave imaging techniques’ (John Wiley & Sons, 1991)
209