Nov 6, 2009 - not made or distributed for profit or commercial advantage and that ...... only on Oliveira's and Cogent,
Mining Communities in Networks: A Solution for Consistency and Its Evaluation Haewoon Kwak
Yoonchan Choi∗
Young-Ho Eom
Computer Science Dept. KAIST, Korea
Samsung Advanced Institute of Technology, Korea
Department of Physics KAIST, Korea
[email protected]
[email protected] [email protected] Hawoong Jeong Sue Moon
Department of Physics KAIST, Korea
[email protected]
Computer Science Dept. KAIST, Korea
[email protected]
ABSTRACT
Categories and Subject Descriptors
Online social networks pose significant challenges to computer scientists, physicists, and sociologists alike, for their massive size, fast evolution, and uncharted potential for social computing. One particular problem that has interested us is community identification. Many algorithms based on various metrics have been proposed for identifying communities in networks [18, 24], but a few algorithms scale to very large networks. Three recent community identification algorithms, namely CNM [16], Wakita [59], and Louvain [10], stand out for their scalability to a few millions of nodes. All of them use modularity as the metric of optimization. However, all three algorithms produce inconsistent communities every time the input ordering of nodes to the algorithms changes. We propose two quantitative metrics to represent the level of consistency across multiple runs of an algorithm: pairwise membership probability and consistency. Based on these two metrics, we propose a solution that improves the consistency without compromising the modularity. We demonstrate that our solution to use pairwise membership probabilities as link weights generates consistent communities within six or fewer cycles for most networks. However, our iterative, pairwise membership reinforcing approach does not deliver convergence for Flickr, Orkut, and Cyworld networks as well for the rest of the networks. Our approach is empirically driven and is yet to be shown to produce consistent output analytically. We leave further investigation into the topological structure and its impact on the consistency as future work. In order to evaluate the quality of clustering, we have looked at 3 of the 48 communities identified in the AS graph. Surprisingly, they all have either hierarchical, geographical, or topological interpretations to their groupings. Our preliminary evaluation of the quality of communities is promising. We plan to conduct more thorough evaluation of the communities and study network structures and their evolutions using our approach.
F.2.m [Theory of Computation]: Analysis of algorithms and problem complexity, Miscellaneous
∗
This work was conducted while Choi was at KAIST.
Permission to make digital or hard copies of all or part of this work for personal or classroom use is granted without fee provided that copies are not made or distributed for profit or commercial advantage and that copies bear this notice and the full citation on the first page. To copy otherwise, to republish, to post on servers or to redistribute to lists, requires prior specific permission and/or a fee. IMC’09, November 4–6, 2009, Chicago, Illinois, USA. Copyright 2009 ACM 978-1-60558-770-7/09/11 ...$5.00.
General Terms Algorithms, Measurement
Keywords Community, Modularity, CNM, Wakita, Louvain, Social networks, Consistent community identification, AS graph
1.
INTRODUCTION
Online social networks pose significant challenges to computer scientists, physicists, and sociologists alike, for their massive size, fast evolution, and uncharted potential for social computing. Partially crawled or site-wide captured, they provide an unprecedented opportunity for researchers to study the network structures both topologically and semantically. One particular problem that has interested us is community identification. Opinion groups on an online e-commerce site or on a newsgroup draw a boundary of demarcation in terms of information flow and community identification algorithms can be applied to mine such groups in today’s massive online social networks. Community identification in a very large network has posed a serious challenge to researchers. Community identification algorithms for networks larger than a few thousands of nodes resort to heuristics and approximation, as optimal grouping becomes intractable. This in turn introduces inconsistency in grouping results when the input order of nodes changes. As pointed out in [59], the “existence of correspondence between communities” or the problem of consistency in identified communities is the next hurdle in the study of community evolution. In this work we investigate the inconsistency among identified communities by existing three community identification algorithms: Clauset-Newman-Moore (CNM) [16], Wakita [59], and Louvain [10]. These three algorithms use modularity as the metric of optimization in a greedy manner. Using a diverse set of network topologies, we show that all three algorithms produce inconsistent communities every time the node ordering changes. The first contribution of this work is to quantify the level of consistency across multiple runs of an algorithm. Two metrics we introduce are pairwise membership probability and consistency. The former quantifies the likelihood
of two nodes resulting in the same community, and the latter represents the global level of consistency of a network, derived from pairwise membership probabilities. We compare 12 networks in terms of the above two metrics and show that no one algorithm outperforms the other two in all networks. However, most pairwise membership probabilities are close to either 0 or 1 (that is, never in the same community or always in the same community, respectively). Based on above observation, we propose a solution that improves the consistency without compromising the modularity. The key idea is to set the pairwise membership probability as the link weight and find communities in the weighted network iteratively. We show that both the modularity and the consistency converge for most networks. Resulting communities exhibit consistent grouping. However, our iterative, pairwise membership reinforcing approach does not deliver convergence for Flickr, Orkut, and Cyworld networks as well for the rest of the networks. Our approach is empirically driven and is yet to be shown to produce consistent output analytically. We leave further investigation into the topological structure and its impact on the consistency as future work. We pick the AS graph and validate that identified communities bear relevance to what we would consider a community in the Internet AS topology. The evaluation is preliminary but reveals interesting insights into the AS graph. Only with topological information, our approach has identified ASes in the same geographical region and further classified those with starkly different topological structures and connectivities. Also recursive application of our approach to a giant community has exposed varying degrees of strong ties between tier-1 ISPs and their customers. We believe our approach is a valuable new tool in the study of network structures and their evolutions. The remainder of this paper is structured as follows. In Section 2 we compile related work. In Section 3 we describe various data sets used in this work. In Section 4 we describe three community identification algorithms: CNM, Wakita, and Louvain. Then, we compare results obtained from the three community identification algorithms and reveal the consistency problem of communities in Section 5. We propose our solution and demonstrate how it reaches consistency of 1 in most networks in Section 6. In Section 7 we present in-depth inspection of identified communities. In Section 8 we conclude.
2.
RELATED WORK
Understanding community structure in a complex network has been an active area of research in sociology, physics, biology, and computer science. In this section we review past and ongoing research on this topic. General background Many complex networks have structural sub-organizations, called communities or modules, that are subsets of nodes characterized by having more internal connections than external connections between them [25, 46, 47]. These communities have been found to correspond to building blocks or functional units of complex networks. For instance, groups in a social network might correspond to social communities or social groups. Groups of webpages on the World Wide Web are sets of webpages dealing with a similar topic [22]. It is known that communities or modules correspond to functional units or pathways in biological networks [29] and to geological units in air transportation networks [27]. Communities are also important in understanding dynamics on a complex network. They affect synchronization [8], epidemic spreading [38], emergence of cooperation [40] in complex networks.
Communities have different structural statistics from the network as a whole [28, 46]. To get deeper insight on network structure, we should consider not only global network properties, such as degree distribution, but also local properties, such as community structure. Thus understanding community structure is one of key issues in complex network research. Groups in social networks To sociologists social networks form “background” or “basis” of social behaviors and activities. Social scientists have studied interplay between structures and function of social networks and found that community structure in social network affects information transfer, cooperation, and communication patterns. They are also interested in the meaning of communities as well as finding communities. McMillan et al. proposed the concept of “sense of community”, a “feeling that members [of a group] have of belonging, a feeling that members matter to one another and to the group, and a shared faith the members’ needs will be met through their commitment to be together” [41]. This approach is useful in finding the closest communities a user identifies with, but requires additional information, such as physical location of residences [13] or topic of blog posts [44, 52]. As online social networks grow rapidly, recent research focus on groups in online social networks. Group formation [9], link prediction [37], information diffusion [32], and group recommendation [56] are studied in this area. Recent research has led to empirical investigation of group evolution in social networks [9, 51]. Instead of mining community structure, they start with well-defined communities and analyze temporal patterns in their group evolution. Their approach minimizes error in tracking history of groups, for groups are explicitly declared, not inferred or mined. Community structure identification Across many fields of computer science, various algorithms for discovering communities and modules in networks have been proposed: graph partitioning based on betweenness and similar measures by removing inter-community links [25, 53], cliques-based approaches [19, 50], information theory [54], link-pattern based approaches [39], random walks on networks [55], similarity among partitions [30], and so on. The quality of partitioned communities is often evaluated by modularity, 𝑄, and maximizing modularity in a greedy manner is one of the prevalent algorithms for community identification [15]. It is defined as: ∑ 𝑄= (𝑒𝑖𝑖 − 𝑎2𝑖 ) (1) 𝑖
where 𝑒𝑖𝑖 is the ratio of the number of links between nodes belonging to community 𝑖 over all links and 𝑎𝑖 is the ratio of all links that cross the boundary of community 𝑖 over all links. The value of modularity ranges from -1 to 1. The value 𝑄 = 0 implies that the number of links within a community is no better than random. The value 𝑄 = 1 is the maximum, but in practice it never reaches 1. Non-zero modularity values represent deviation from randomness, and in practice it is found that a value above 0.3 is a good indicator of significant community structure in a network. Conductance is a similar measure, but with only a local interpretation [15]. It measures the quality of the cut between a set of nodes and the rest of the network [11]. Leskovec et al. investigate the relation between the conductance and the size of partitions [35] and report that communities larger than a few hundreds are likely to decrease in quality represented by network community profile plot. Unfortunately, exact modularity optimization is computationally intractable in large networks. For this reason, most modularity op-
Network
# of nodes
# of links
Karate C.Elegans Protein BBS AS Graph Facebook WWW Wikipedia Flickr Orkut YouTube Cyworld
34 297 1,846 7,410 32,930 63,730 325,729 1,870,709 2,302,924 3,072,440 3,223,588 11,537,961
78 2,148 2,203 103,462 124,133 817,090 1,090,108 36,532,531 22,838,276 117,185,083 9,376,594 177,566,730
# of nodes in GCC 34 297 1,458 7,339 32,925 63,691 325,729 1,870,521 2,173,369 3,072,440 3,216,082 11,506,431
(100%) (100%) (78.9%) (100%) (100%) (99.5%) (100%) (99.9%) (94.3%) (100%) (99.8%) (99.7%)
# of links in GCC 78 2,148 1,948 103,413 124,131 816,886 1,090,108 36,532,421 22,729,227 117,185,083 9,371,096 177,548,838
(100%) (100%) (88.4%) (100%) (100%) (99.9%) (100%) (99.9%) (99.5%) (100%) (99.9%) (99.9%)
Avg. Degree 4.6 14.5 2.7 28.2 7.5 25.7 6.7 39.1 20.9 76.3 5.8 30.9
Link Density
Avg. C.C
0.14 0.049 0.0018 0.0038 0.00023 0.0004 0.000021 0.000021 0.00001 0.000025 0.000002 0.000003
0.57 0.29 0.071 0.41 0.38 0.22 0.23 0.23 0.18 0.17 0.09 0.16
Table 1: Basic statistics of 12 networks. GCC is the giant connected component, and Average C.C is the average clustering coefficient. timization algorithms are approximations. Examples are greedy algorithms [16], simulated annealing [26], and spectral methods [46].
mammals. For this work, we discard the weight and direction of the links and treat the network as undirected and without weight.
Limitation of modularity Nevertheless, modularity maximization methods (MMMs) are usually effective and successful in identifying and uncovering community structure in networked systems, but these methods have limitations. First, modularity has a resolution limit. It means that MMMs fail to identify communities smaller than a certain scale. Recently, Fortunato and Barthélemy [23] show that this scale depends on the network size and degree of interconnectedness of the communities. Second, MMMs cannot identify overlapping and nested community structure. MMMs find only non-overlapping communities, but many real communities overlap. To resolve overlapping communities in networks, Palla et al. [50] suggest clique percolation methods (CPMs) and report that communities of different sizes follow separate evolutionary paths. Although these limitations exist, modularity-based methods are the only known approaches to work on very large networks. Our goal is to address the problem of consistent community identification so that we could use modularity-based methods in the study of network dynamics.
Protein Interaction Network In the protein interaction network, each identifier represents protein in the protein interaction network of yeast [31].
3.
DATA SETS
We use a diverse set of networks for evaluation in this work. These networks vary greatly in characteristics and in size from the smallest of 34 nodes to the largest of 11 million. They include offline and online social networks, an online bulletin board system, a biological neural network, a protein interaction network, the Internet Autonomous System (AS) graph, the Wikipedia link graph, and World-Wide Web graphs. Below we give a brief description of each data set in increasing order in the number of nodes. Karate Club The data set of Zachary’s Karate club is the social network of friendships between 34 members of a Karate club at a US university, compiled by Wayne Zachary [62]. Because of a dispute in the Karate club, one of the coaches left the original Karate club and formed a new club with about half of the members. This is a rare data set that has recorded the community evolution and has been widely used in social sciences and other fields. C.Elegans The Caenorhabditis Elegans (C.Elegans) is the most primitive organism that shares many biological characteristics of
Bulletin Board System This data is from an online bulletin board system (BBS), called Loco, that runs at KAIST in Korea [20]. The original network has 7435 nodes, but we eliminate 25 whose degrees are zero. AS Graph We use the Internet AS-level topology created by Oliveira et al. [49]. They publish daily snapshots of AS-level topology, and we use the release from April 1st, 2009. The strength of this data is that many backup links not observable from BGP routing tables are included. This is the data used in the study of AS topology evolution in [48]. Their data consists of 3-tuples: two AS numbers, and the relation between them. They use two types of AS relations: peer-peer and customer-provider. We treat all relations as undirected edges. Facebook We use the Facebook user-to-user link dataset released by Viswanath et al. [58]. They collect data from Facebook New Orleans networks. We treat all links as undirected. World-Wide Web In the data set of World Wide Web (WWW), each identifier represents a web page within nd.edu domain [5]. Although we call it WWW, the set is not yet known to be representative of the real world wide web. A link corresponds to a hyper-text link from a web page to another. We treat the graph as undirected for our work. Wikipedia Wikipedia [61] is an online encyclopedia that any user can add or edit. Mislove extracted the edit history of 826 days (ending on April 6th, 2007) of the English Wikipedia and made the data set publicly available [42]. For our work, we do not use the timestamps, but only the pointers from a page to another. This graph is similar to the WWW graph, but different in the sense that all those pointers are within the Wikipedia domain. Flickr Flickr is a popular online photo-sharing service. Mislove et al. crawled user-to-user links of Flickr [43]. We omit the timestamps and only use the links from a user to another. We treat the graph as undirected.
Orkut Orkut user-to-user link dataset is also released by Mislove et al. [43]. The average degree of Orkut network is much higher than other networks. For our work we treat the links as undirected. YouTube YouTube is the largest online video-sharing service. This dataset is also from [43]. We treat the graph as undirected for our work. Cyworld Cyworld [17] is the most popular online social networking service in South Korea [4]. A link in the Cyworld data set represents an online friendship between two users. The data set is from September 2005. Due to its size, the link density is the lowest among the 12 networks. Table 1 shows the basic statistics of the data sets. Average degree is the average of all individual node degrees [60]. The average node degree varies from 2.67 of the protein interaction network to 28.2 of the BBS, an order of magnitude different. Link density is the ratio of links that actually exist against all possible links [60]. The link density has a wider range from 0.000003 of the WWW graph to 0.14 of the Karate club, 5 orders of magnitude difference. Clustering coefficient of a node is the ratio of existing links between a node’s neighbors over all possible links between the neighbors. It quantifies how closely a node’s neighbors are connected. Average clustering coefficient is the average of all clustering coefficients of nodes in the entire network. The average clustering coefficient is the lowest in the protein interaction network, whereas values for other networks fall in the range of 0.16 to 0.57. Not all nodes may be reachable from other nodes in a network. For this work, we only consider the giant connected component (GCC) of each network. Later we show how these differences have an impact on the modularity and consistency.
4.
THE THREE ALGORITHMS
In this section we provide brief descriptions and distinguishing features of the three community identification algorithms: CNM, Wakita, and Louvain. All three algorithms have publicly available source codes and we use them1 . CNM Algorithm Newman and Girvan defined the modularity in [47] and proposed a simple algorithm with the complexity of 𝑂(𝑛3 ) for a sparse network of 𝑛 nodes. Newman proposed an improved algorithm based on agglomerative hierarchical clustering and brought down the complexity to 𝑂(𝑛2 ) in [45]. Still the complexity was too high for large networks. In [16] Clauset, Newman, and Moore proposed a more efficient community identification algorithm (we call CNM) that performs the same bottom-up greedy optimization to maximize the modularity of communities as in [45], but uses balanced binary trees and max heaps. The time complexity of CNM algorithm drops to 𝑂(𝑚 ⋅ 𝑑 ⋅ log 𝑛), that is, in logscale of the network size, where 𝑑 is the depth of balanced binary trees and 𝑚 is the number of edges. In Figure 1 we present the pseudocode for the CNM algorithm. The CNM algorithm begins with each node as a separate community in a network (line 4). Then the algorithm finds the pair of communities with the global maximum Δ𝑄 (line 7), calculated by 1 http://www.cs.unm.edu/∼aaron/research/fastmodularity.htm http://www.is.titech.ac.jp/∼wakita/en/software/communityanalysis-software/ http://findcommunities.googlepages.com/ We modify the code of Louvain to support the network whose total weight is greater than 232 .
Figure 1: Pseudocode for the CNM algorithm
𝑒𝑖𝑗 + 𝑒𝑗𝑖 − 2𝑎𝑖 𝑎𝑗 = 2 (𝑒𝑖𝑗 − 𝑎𝑖 𝑎𝑗 ), and merges the pair into one community (lines 11-12) until maximum Δ𝑄 is not positive any more (lines 8-10). During the merging process, the algorithm updates Δ𝑄 values that correspond to any neighboring community of the newly merged community (lines 13-16). If there are ties for the maximum Δ𝑄 in line 7, any pair of communities can be selected. In most cases the input order of nodes to the algorithm determines the outcome. The problem of consistency in final outcome arises here and only worsens, as the network size grows and more ties appear. Wakita Algorithm While the CNM improves upon the simple greedy algorithm with sophisticated data structures, it is reported to have unbalanced growth in certain communities. That is, the pair merged first tends to snowball into a large community, until the community can no longer grow in terms of modularity. Then another pair of single nodes is formed and then snowballs to another large community. A few very large communities emerge and then remaining nodes eventually merge into smaller communities. Wakita and Tsurumi use a consolidation ratio that takes into account the community size and induces balanced growth among communities [59]. This reduces the complexity greatly and their algorithm is projected to scale up to networks of 10 million nodes. We omit the pseudocode for the Wakita algorithm, for it is identical to CNM except for line 7. In Wakita, line 7 is replaced by: extract 𝑚𝑎𝑥Δ𝑄𝑐𝑥 ,𝑐𝑦 ⋅ 𝑚𝑖𝑛(∣𝑐𝑥 ∣/∣𝑐𝑦 ∣, ∣𝑐𝑦 ∣/∣𝑐𝑥 ∣)
(2)
It evaluates not only ΔQ but also a consolidation ratio, and prefers communities of similar sizes to be merged. Thus, as in CNM, there are ties for the maximum Δ𝑄 in (2), and any pair of communities can be selected. The problem of consistency persists. Louvain Algorithm Blondel et al. take the idea of consolidation one step further and merge at every iteration all nodes and communities with those that maximize Δ𝑄 [10]. Their so called Louvain method improves both the modularity and computational complexity greatly and is the only known algorithm to be applicable to networks of more than 10 million nodes. Figure 2 shows the pseudocode for the Louvain algorithm. It consists of two phases. In the first phase, it starts with single-node communities (line 6) like the above two algorithms. Then it eval-
(a) Q=0.27318
(b) Q=0.38067
(c) Q=0.41979
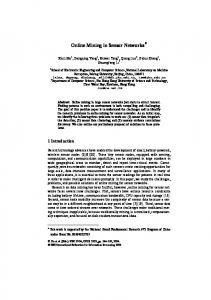
Figure 3: [Best viewed in color] Visualization of inconsistent community identification in Karate network. Nodes of the same color are contained in the same community, and node ordering is depicted as the number in the node
5.
QUANTIFYING CONSISTENCY
In this section we introduce two metrics to quantify the level of consistency and compare the three algorithms against those two metrics. As described in Section 4, three algorithms arbitrarily select one of ties in max ΔQ. In a typical implementation of an algorithm a max heap is used to find the value of maxΔQ in 𝑂(1). The input order of nodes affects the construction of the heap and thus determines the outcome of the selection. Therefore, we induce consistency or the problem of inconsistency using multiple randomly ordered data sets.
5.1
Figure 2: A pseudo code for the Louvain algorithm
uates ΔQ by moving one node from its original community to its adjacent communities. The node is moved to the adjacent community that maximizes ΔQ. If the maximum ΔQ is negative, the node stays in its original community. This process is repeated for all nodes and continues until no further improvement or no membership change (line 10 to 18). In the second phase, the algorithm rebuilds the network with communities as nodes and sum of weights between nodes as link weights, and returns to the first phase. In Figure 2 ties in maximum Δ𝑄 arise in line 15. In this section we have presented pseudocode for CNM, Wakita, and Louvain algorithms and illustrated the sources of inconsistency in their designs.
Performance of the 3 Algorithms
We have seen improvement in time complexity from CNM to Wakita, and then to Louvain. In this section we analyze the runtime of the 3 algorithms over the 12 networks. Runtime of some of our networks have been reported in [10, 59, 34], but not of those with tens of millions of nodes. We ran all evaluation on an Intel Xeon 2.5 GHz computer with L2 cache of 6 MB and main memory of 16 GB, running Ubunto Linux v2.6.24. For networks with fewer than 5, 000 nodes, all three algorithms return results almost immediately. Once the network size grows over 5, 000 nodes, then CNM starts to slow down. When the number of nodes increases to 325, 000, it slows down significantly. Beyond 325, 000 it took longer than 2 days and we halted the execution. We expected Wakita to scale up to ten million nodes, as expressed in [59], but it did not finish in 3 days. For a network of more than 10 million nodes and 100 million links, Louvain is the only algorithm that produces output in our evaluation. Yet still, it takes tens of minutes to compute Orkut and Cyworld. We confirm previously reported performance of the algorithms and use only the Louvain algorithm with the five largest networks in this work.
5.2
Variance in Modularity
All three algorithms use the modularity as a metric of optimization. However, they all produce different values of modularity for the same network and even for the same network when the input order of nodes changes. We use the Karate network as an example to illustrate the inconsistency even in a small well-studied network. Figure 3 shows identified communities in Karate network by the Louvain algorithm under three different orderings of nodes. Al-
(a) Karate club
(b) C.Elegans
(c) Protein Interaction
(d) BBS
(e) AS graph
(f) Facebook
(g) World Wide Web
(h) Wikipedia
(i) Flickr
(j) Orkut
(k) YouTube
(l) Cyworld
Figure 4: Comparison of modularity
though the Karate network has a small number of 34 nodes, identified communities in Figure 3(a), (b), and (c) are quite different. In Figure 3(a) there are 8 communities and the largest of them has only 9 nodes. Figure 3(b) splits the best known sociology study result of two-group partitioning [62] further into 3. Alves has reported the existence of the blue community (of the 5 nodes in the top right corner) in Figure 3(b) [7]. His algorithm is based on the effective transition matrix of random walks through the topology and his finding is from a fixed ordered data set; he reports no other grouping results. Figure 3(c) splits the 3 communities in Figure 3(b) further into 4, resulting in a larger modularity. This example demonstrates that even for a small network, the input order plays a critical role
and results can be very different without much consistency between them. Here we evaluate which algorithm produces better modularity and how variable the modularity is when the input order is perturbed. In order to quantify variance in modularity, we perturb the input ordering and generate 𝑁 sets of the same data but with different input order. In Figure 4 we plot the cumulative distribution functions (CDFs) of modularity obtained from CNM, Wakita, and Louvain algorithms with 𝑁 = 100 randomly ordered data sets. In Figure 4(a) of the Karate club, CNM produces only one value of 0.381 no matter what the input order is, whereas the values obtained by Wakita and Louvain range from 0.406 to 0.419 and
(a) Karate club
(b) C.Elegans
(c) Protein Interaction
(d) BBS
(e) AS graph
(f) Facebook
(g) World Wide Web
(h) Wikipedia
(i) Flickr
(j) Orkut
(k) YouTube
(l) Cyworld
Figure 5: CDF of pairwise membership probability
from 0.273 to 0.420, respectively. In Figure 4(b) of C.Elegans, CNM produces 0.369 of 55 data sets and 0.372 of 45 data sets, and Wakita and Louvain produce values from 0.288 to 0.331 and from 0.319 to 0.403, respectively. In Figure 4(c) of the protein interaction network, the range of values by CNM is narrower than that by Louvain, but two overlap. The values of Wakita lag lower below 0.81. In the remaining Figures 4(d) to (g) Wakita produces lower modularity than CNM and Louvain, and Louvain always performs best. From Figure 4(h) to (l) Louvain produces modularity values in ranges of vary widths from 0.014 to 0.027. In all, Louvain produces highest modularity in all but for the smallest Karate club. CNM shows the smallest variance in 11 networks, while CNM obtains the largest variance in AS graph. Wakita is lowest in modularity and has the largest variance. Based on the observations from Figure 4 we expect Louvain to have the best consistency in terms of community membership across different input data sets. Next we move on to verify our expectation.
5.3
Consistency in Community Membership
The number of ways to partition a graph grows far faster than exponential to the number of nodes, and it is not surprising to see modularity vary as the input order is perturbed. From a macroscopic view this is fine as long as the modularity varies not too much. However, if we are interested in network analysis from a nodal perspective, that is, identifying a community a node belongs to, it does not make sense for the node to belong to a completely different community every time the input order is perturbed. For example, we have two snapshots of a growing network taken a year apart. How has the community of a node grown in a year? If the community identification algorithm is so sensitive to the order of the input and produces completely different communities from a node’s perspective, we cannot answer the question raised in the example. Thus before we identify the community a node belongs to, we should ask: how consistent is the community membership across different input orders?
Figure 6: Consistency (no data available by CNM and Wakita for Wikipedia and Cyworld)
Over 𝑁 runs of an algorithm, each over a randomly ordered input set, we quantify the likelihood of a pair of nodes resulting in the same community as: ∑𝑁 𝑛 𝑛=1 𝛿 (𝑐𝑖 , 𝑐𝑗 ) (3) 𝑝𝑖𝑗 = 𝑁 where { 1, if 𝑐𝑖 = 𝑐𝑗 in the 𝑛th dataset 𝑛 𝛿 (𝑐𝑖 , 𝑐𝑗 ) = 0, otherwise and 𝑣𝑖 and 𝑣𝑗 are nodes and 𝑐𝑖 and 𝑐𝑗 represent communities that 𝑣𝑖 and 𝑣𝑗 belong to, respectively. We call this metric pairwise membership probability. The pairwise membership probability 𝑝𝑖𝑗 represents the empirical probability that two nodes belong to the same community across multiple runs of the same algorithm. We can compute 𝑝𝑖𝑗 for all possible pairs of nodes. However, for any specific 𝑖, 𝑝𝑖𝑗 is likely to be 0 for most of 𝑗 due to the sparsity of links in the network, and this tendency grows with the network size. Therefore, we consider 𝑝𝑖𝑗 only for those adjacent nodes; that is, only between neighbors. In Figure 5 we plot CDFs of the pairwise membership probability. The pairwise membership probability of 1 means that the two neighboring nodes always belong to the same community and the pairwise membership probability of 0 means that the two never belong to the same community no matter what the input order is. The larger the number of pairs whose empirical pairwise membership probability is close to either 0 or 1 is (or the more parallel the CDF plot is to the 𝑥-axis), the more consistent the identified communities are. In Figures 5(a), (c) and (g), of the Karate club, all three algorithms produce pairwise membership probabilities of mostly 0’s and 1’s. For the remaining nine networks, Louvain produces the most consistent outcome and, for (g) to (h), the only outcome. In order to quantify network-wide community membership consistency, we define a metric of consistency 𝒞 for the entire network as: ∑ (𝑝𝑖𝑗 − 0.5)2 (𝑣𝑖 ,𝑣𝑗 )∈𝐸 1 × (4) 𝒞= ∣𝐸∣ (0.5)2 The consistency 𝒞 weighs the pairwise membership probabilities away from 0.5. The second term in (4) normalizes 𝒞 from 0 to 1. In case of communities detected by CNM algorithm in the Karate club, 12.8% of the pairwise membership probabilities are 0 and the rest of the pairs have 1, which means that nodes of a community always belong to the same community over 𝑁 runs: 𝒞 = 1. In
(a) BBS
(b) C.Elegans Figure 7: Inter-quartile plot of modularity (no = Louvain without extra means for tie breaking; k = degree; c = clustering coefficient; knn = degree correlation; cen = betweenness centrality; _d = in decreasing order)
Figure 6 we show the consistency from three algorithms. In case of Karate club, C.Elegans, and protein interaction network, the CNM has the highest consistency, whereas the consistency of Louvain is the lowest. In case of BBS and AS graph, the Wakita algorithm has the highest consistency among the three, whereas the consistency of the CNM algorithm is the lowest. In the case of WWW, the consistencies of CNM, Wakita, and Louvain algorithms are 0.956, 0.921, and 0.955, respectively, all over 0.9. There is no one algorithm that
Figure 8: Convergence of consistency
outperforms the other two in all networks and no consistent correlation between the consistency and the topological characteristics of a network, such as average degree, link density, and average clustering coefficient.
6. 6.1
CONSISTENT COMMUNITY IDENTIFICATION Reinforcing pairwise membership
The key observation from the previous section is none of the three algorithms produce a better solution than the others in all networks. However, a closer look at Figure 5 reveals that in all networks far more than 50% of pairs have pairwise membership probabilities either smaller than 0.2 or greater than 0.8. That is, most pairings are “doomed”. Based on this observation, we devise a consistency reinforcing mechanism as follows. After a cycle of 𝑁 runs, we calculate the pairwise membership probabilities and then assign them as link weights. From the second cycle on, we use the weighted network and continue until 𝒞 reaches 0.999 or higher. In a weighted network, an edge of a higher weight is placed within a community, while an edge of a lower weight bridges communities. Since we assign the pairwise membership probability to the weight of the corresponding link, an edge of high pairwise membership probability in prior cycle is more likely to be placed within a community in the next cycle. Therefore, links with higher weights are reinforced through multiple cycles and eventually consistent communities emerge. Our approach has the effect of removing those links with pairwise membership probabilities of 0 in the next cycle and spreading unit link weight between 0 and 1, thus reducing ties significantly in calculating Δ𝑄. When there are ties, can we give preference to nodes based on other metrics, such as degrees or betweenness centrality? To assess the benefit of other metrics, if any, we order nodes by the degree, clustering coefficient, degree correlation, and betweenness centrality and compute modularity. Figure 7 plots the inter-quartile of the modularity over 100 runs of the BBS network and C.Elegans. The box presents the inter-quartile range, and the red line in the box is median. The cross mark is an outlier beyond ±2.7𝜎. We omit the results from other networks, for we do not find a clear dependency on one metric across all twelve networks. Even if we employ all the metrics in tie breaking, we cannot eliminate ties completely. In other words, no single topological characteristic consistently stands out to work better than others in all networks.
Figure 10: Comparison of community size distribution in 4 trials of AS graph
Figure 11: Community size vs. Jaccard coefficient between two trials of AS graph
We have looked at edge betweenness as well, and found no correlation between edge betweenness and pairwise membership probability. Our approach of reinforcing consistency in multiple cycles is applicable to any of the three algorithms. We include only the results from the Louvain algorithm in this paper, for it is the fastest and only one that scales up to billions of links. Figure 8 demonstrates the convergence of consistency after six cycles. In the first 6 networks consistency reaches 1 in 5 cycles, and
(a) Karate club
(b) C.Elegans
(c) Protein Interaction
(d) BBS
(e) AS graph
(f) Facebook
(g) World Wide Web
(h) Wikipedia
(i) Flickr
(j) Orkut
(k) YouTube
(l) Cyworld
Figure 9: Convergence of modularity (‘Un’ indicates modularity of unweighted network)
even in WWW and Wikipedia networks, it reaches over 0.999818 and 0.999905, respectively, whereas, for Orkut and Cyworld, 𝐶 does not converge to 1. We discuss plausible reasons in Section 6.3. In Figure 9 we show how the modularity converges over five cycles. The figure has the inter-quartile box-plots of modularity of the original unweighted network and next five cycles. In all cases but for Flickr, Orkut, and Cyworld, the modularity converges almost to a single point after six cycles. Furthermore, it either falls within the inter-quartile range of the original unweighted network, and, if not, it is always above the inter-quartile range. That is, the modularity after six cycles is higher. Figure 9 demonstrates that our approach has no negative impact on modularity, and even improves it in certain networks.
6.2
Agreement between trials
So far we have seen our solution of using pairwise membership probabilities as link weights improve consistency greatly. In this
section we evaluate if communities from different trials come out identical for the converged case. We turn our focus to individual communities in two independent trials. A trial is 𝑀 cycles of 𝑁 runs. The results in Figure 9 are from 𝑀 = 6 cycles of 𝑁 = 100 runs and demonstrate consistently converging modularity. Just to confirm the converging trend, we have run another trial over all networks and observed less than 0.001 difference in the final modularities of two trials. We move on to the analysis of community size distributions. We choose the AS graph for our evaluation and omit the others for lack of space. Figure 10 plots the community size distribution from 4 trials. All 4 plots almost completely overlap and are very close to each other. Only for small-sized communities (< 100) some discrepancies between trials are observed. In order to see if the communities are identical across trials, we calculate the maximum Jaccard coefficient (the ratio of intersection to union of two communities) of a community against all communities of another trial.
(a) Facebook
(b) Orkut Figure 12: [Best viewed in color] Change of pairwise membership probability
The Jaccard coefficient of 1 means that exactly the same communities are produced in both trials. We compare the Jaccard coefficients for all pairs of trials and find only between Trials 1 and 2 and between Trials 1 and 3 there are 5 Jaccard coefficients below 0.95 and all other pairs of trials report Jaccard coefficients < 0.95. We plot the Jaccard coefficients between Trials 1 and 2 in Figure 11. Out of 48 communities, 3 communities have the Jaccard coefficient higher than 0.99, and 45 communities have 1. Surprisingly, even a community of 10, 608 nodes has the Jaccard coefficient of 1.
6.3
Discussion on non-converging cases
According to Figures 8 and 9, our iterative, pairwise membership reinforcing approach does not deliver convergence for Flickr, Orkut, and Cyworld networks as well for the rest of the networks. To understand why our approach stops to perform for these large networks, we first visualize the change in pairwise membership probabilities through cycles. In Figure 10 we plot the pairwise membership probability of one cycle on the 𝑥-axis and that of the next cycle on the 𝑦-axis. We color the 100 by 100 grids according to the number of links with the corresponding pairwise membership probabilities in two consecutive cycles. In Figure 10 points near the lower left corner represent those links of which end nodes do not belong to the same community across two cycles. Those in the upper right corner represent the links that remain in the same community through two consecutive cycles. Thus the more points are in the lower left and upper right corners, the more converging the communities are. In the case of Facebook we see many points in the center of the figure in the first two cycles. As the iteration continues, except for a very small number of points almost all data points converge either to (0, 0) or (1, 1). However, Orkut’s case is different. In the first 2 cycles, the pairwise membership probabilities are spread more widely than in Facebook (leftmost figure in Figure 10(b)). Even after 5 cycles the communities do not converge (middle figure in Figure 10(b)). We do not stop at the 5th cycle, but continue with 5 more cycles. Still,
the rightmost figure in Figure 10(b) is starkly different from that in Figure 10(a). Flickr behaves similarly to Orkut. Even though Cyworld shows slightly, if marginally, better convergence of consistency in Figure 8, we report that when visualized Cyworld’s consistency is actually worse than that of Orkut. What are the common characteristics of Flickr, Orkut and Cyworld that mark them apart from other networks? Orkut and Cyworld are the two largest networks in terms of the number of links, but Flickr is smaller than Wikipedia. The sheer size along is not a factor. We consider two possible explanations. One is the number of iterations per cycle. Our choice of 𝑁 = 100 is to make sure that we break ties in choosing 𝑚𝑎𝑥Δ𝑄, for the pairwise membership probability is used as the link weight in the next cycle. However, the number of all possible community configurations grows faster than exponentially and 𝑁 = 100 might be not large enough to break all possible ties. Increasing 𝑁 raises a practical concern, as even the Louvain algorithm takes half an hour for one iteration over Orkut or Cyworld. If we increase 𝑁 ten times, then we need months of computing resource instead of days. The other explanation is the resolution limit in community detection [23]. Modularity is defined as a sum of terms and has an intrinsic trade-off between the number of communities and its maximum value. In [23] Fortunato and Barthélemy report that communities below a certain size may not be resolved and are grouped into a larger loose community. The resolution limit is the threshold community size, and is a function of the total number of links, not nodes. The resolution limit points at the possibility of a subset of nodes vacillating between small communities and one large all-encompassing community. Leskovec et al. use conductance to split a network into two and demonstrates that partitions beyond a certain size may not be the ”best” [35]. Although the two papers use different quantitative definitions of communities, they both address the difficulties in interpreting the notion of cluster coherence and its implication on community separability. Although their work addresses communities with different measures, they both address
(a) The largest community in the L community
(b) The community including Korea telecom AS (ASN=4766)
(c) Star community whose hub is Profit-Center LLC (ASN=12383)
Figure 13: [Best viewed in color] Visualization of AS communities
the difficulties in interpreting the notion of cluster coherence and its implication on community separability. Neither of the above two explanations is tenable at this point. Our approach is empirically driven and is yet to be shown to produce consistent output analytically. We leave further investigation into the topological structure and its impact on the consistency as future work.
7.
FIRST LOOK AT CONSISTENT COMMUNITIES
The ultimate goal of community identification is to study the structural characteristics and group dynamics. However, the interpretation of communities varies greatly from one field of science to another. A community in a social network maps to people, while a group in a molecular network charts a certain function performed by the group of cells. In this section we present preliminary interpretation of identified communities in Internet AS graph. As each network requires domain knowledge for interpretation, we choose the AS graph for evaluation of communities and leave the rest for future work. This section is a sanity check to validate that identified communities bear relevance to what we would consider a community in a specific domain. We first map the AS number to the AS name using [2] and then to the AS type as Oliveira et al. propose in [49]. They define four AS types: (1) tier-1 if AS has no provider; (2) large ISP if the size of the AS customer tree ≥ 50; (3) small ISP if 5 ≤ AS customer tree < 50; and (4) stub if AS customer tree < 5. Previous work on Internet topology has focused on node characteristics, such as degree, and link characteristics, such as connectivity and liveness [6, 12, 14, 21, 36, 48]. Krishnamurthy et al. have looked at intermediate-level clustering of routers and hosts [33]. Our investigation of consistent communities differs in that we focus on communities of ASes rather than topological characterization or topology growth models. Trial 1 in Section 6.2 produces 48 communities from the AS graph. Out of 48 communities, we choose to investigate the following 3 communities in detail: the largest community, a geographically concentrated community, and a star-shaped community2 . 2 We make the complete list of identified communities available online via http://an.kaist.ac.kr/traces/IMC2009-kwak.html
Let us first look at the largest community (we label it 𝐿). It contains 10, 630 or 32.3% of all ASes. There are 5 tier-1 ASes, 34 large ISPs, 248 small ISPs, 10, 230 stub ASes, and 114 of unknown type. The 5 tier-1 ASes are MCI, Level3, AT&T WorldNet, Sprint, and Qwest. The largest community also includes 9 of top 10 ASes listed in AS ranking page of CAIDA [1]. CAIDA’s top 10 and Oliveira’s tier-1 ASes share MCI, Level3, AT&T WorldNet, Sprint, Qwest, and GBLX; NTT America and Savvis appear only on Oliveira’s and Cogent, AT&T Internet Services, tw telecom holdings, and XO Communications only on CAIDA’s. To investigate the structure of the 𝐿 community in detail, we reapply our approach to the 𝐿 community. We obtain 33 communities whose sizes vary from 9 to 1, 537. We plot the largest one in Figure 13(a). The color of a node changes from red to blue as the degree decreases. The size of a node is proportional to the degree in log-scale. The three big red circles are MCI Communications Services (ASN=701), AT&T WorldNet Services (ASN = 7018), and Sprint (ASN = 1239). Interestingly, they all belong to the same community, the largest with 1, 537 nodes. The remaining 2 tier-1 ASes fall into different communities, and so do the remaining 6 from the CAIDA’s top 10 list. The layers of strongly connected tier-1 ASes at the core and other tier-1 ASes remind us of the Internet Jellyfish model [57]. Communities of our approach bears semblance to the shells and legs of the jellyfish model. We leave in-depth mapping of our communities to the jellyfish model for future work. Next, we draw a community of geographically concentrated ASes in Figure 13(b). For easy interpretation of geographical information of ASes, we choose the community with top Korean ISPs. This community has 658 ASes, including 5 large ISPs, 11 small ISPs, 640 stub ASes, and 2 ASes of unknown type. The red circles are Korea Telecom (ASN = 4766), Dacom (ASN = 3786), and Hanaro (ASN = 9318). They are the top three ISPs in Korea. Using RIPE Database Search [3], we verify whether the other ASes are in Korea. Surprisingly, 97.4% of ASes in this community are in Korea. This community shows that it is possible to find geographically concentrated ASes from the AS topology by our community identification algorithm. Third, we plot a star-shaped community in Figure 13(c). All leaf ASes connect only to the hub AS and no other. They are singlehomed stub ASes. The relation between the hub and leaf ASes is
provider-customer, and the hub is a small ISP in Ukraine. One notable observation is that in this community of a star topology there is no peer-peer relation. As in the case of the Korean AS community, all the ASes in this community are in Ukraine. The hub AS has one more link to NetAssist AS (ASN = 29632) outside the community. Most major ISPs in Ukraine, such as DATAGROUP (ASN = 21219, degree = 281), TOPNet (ASN = 21011), Ukraine Academic and Research Network (ASN = 3255), UKRTelnet Ukraine (ASN = 6849), actually belong to another community of size 1, 194. Though our analysis of consistent communities in this section is preliminary, it has revealed interesting insights into the AS graph. Only with topological information, our approach has identified ASes in the same geographical region and further classified those with starkly different topological structures and connectivities. Also recursive application of our approach to a giant community has exposed varying degrees of strong ties between tier-1 ISPs and their customers. Our approach offers a new tool in the study of network structures and their evolutions.
8.
CONCLUSION
In this work we have investigated the problem of consisntency among identified communities by existing community identification algorithms: CNM [16], Wakita [59], and Louvain [10]. Using a diverse set of network topologies, we have shown that all three algorithms produce inconsistent communities every time the input node ordering changes. We introduce two metrics of consistency for this work: pairwise membership probability and consistency. The former quantifies the likelihood of two nodes resulting in the same community, and the latter represents the global level of consistency of a network, derived from pairwise membership probabilities. We have compared twelve networks in terms of the above two metrics and shown that no one algorithm outperforms the other two in all networks. However, most pairwise membership probabilities are close to either 0 or 1 (that is, never in the same community or always in the same community, respectively). Based on this observation, we have proposed a solution that improves the consistency without compromising the modularity. The key idea is to set the pairwise membership probability as the link weight and find communities in the weighted network iteratively. We demonstrate that our solution to use pairwise membership probabilities as link weights generates consistent communities within six or fewer cycles for most networks. The final modularity falls within the inter-quartile range of a cycle of the original unweighted network or sometimes even slightly better. Resulting communities exhibit consistent grouping through multiple trials and their size distributions almost identical. We have also examined identified communities in the AS graph. ASes in some communities are geographically close, even though the topological structure bears no information about geographic locations. Also recursive application of our approach to a giant community that contains 10, 630 or 32.3% of all ASes has exposed varying degrees of strong ties between tier-1 ISPs and their customers. Our solution does not lead to converging modularity and consistent communities in a small number of networks. So far we have not found topological characteristics that mark these networks apart from other networks, complicating our effort to improve the current solution. We plan to investigate network-specific topological idiosyncracies for their impact on modularity and eventually community identification. Consistency in identified communities is a step towards improving the quality of the identified communities. Our work is the first
to address the issue of consistency. Our approach offers a new tool in the study of network structures and their evolutions.
Acknowledgements This work was supported by NAP of Korea Research Council of Fundamental Science & Technology.
9.
REFERENCES
[1] AS Ranking, Caida. http://as-rank.caida.org/. [2] CIDR report. http://www.cidr-report.org/as2.0/. [3] RIPE Data Search. http://www.db.ripe.net/whois. [4] Y.-Y. Ahn et al. Analysis of topological characteristics of huge online social networking services. In WWW ’07, pages 835–844, New York, NY, USA, 2007. ACM. [5] R. Albert et al. Internet: Diameter of the world-wide web. Nature, 401(6749):130–131, 1999. [6] D. Alderson et al. Understanding Internet topology: principles, models, and validation. IEEE/ACM Trans. Netw., 13(6):1205–1218, 2005. [7] N. A. Alves. Unveiling community structures in weighted networks. Phys. Rev. E., 76(3):036101, 2007. [8] A. Arenas et al. Synchronization reveals topological scales in complex networks. Phys. Rev. Lett., 96(11):114102, 2006. [9] L. Backstrom et al. Group formation in large social networks: membership, growth, and evolution. In KDD ’06, pages 44–54, New York, NY, USA, 2006. ACM. [10] V. D. Blondel et al. Fast unfolding of communities in large networks. Journal of Statistical Mechanics: Theory and Experiment, 2008(10):P10008 (12pp), 2008. [11] U. Brandes and T. Erlebach. Network Analysis : Methodological Foundations. Springer, March 2005. [12] H. Chang et al. Towards capturing representative AS-level Internet topologies. Computer Networks, 44(6):737 – 755, 2004. [13] D. M. Chavis and A. Wandersman. Sense of community in the urban environment: a catalyst for participation and community development. American Journal of Community Psychology, 18:55–81, 2002. [14] Q. Chen et al. The origin of power-laws in Internet topologies revisited. In IEEE INFOCOM, volume 2, pages 608–617. IEEE, 2002. [15] A. Clauset. Finding local community structure in networks. Phys. Rev. E, 72(2):026132, Aug 2005. [16] A. Clauset, M. E. J. Newman, and C. Moore. Finding community structure in very large networks. Phys. Rev. E., 70:066111, 2004. [17] Cyworld. http://www.cyworld.com. [18] L. Danon et al. Comparing community structure identification. Journal of Statistical Mechanics: Theory and Experiment, 2005(09):P09008+, September 2005. [19] I. Derenyi et al. Clique percolation in random networks. Phys. Rev. Lett., 94(16), 2005. [20] Y.-H. Eom et al. Evolution of weighted scale-free networks in empirical data. Phys. Rev. E., 77(5):056105, 2008. [21] M. Faloutsos et al. On power-law relationships of the Internet topology. In SIGCOMM ’99, pages 251–262, New York, NY, USA, 1999. ACM. [22] G. W. Flake et al. Self-organization and identification of web communities. IEEE Computer, 35:66–71, 2002.
[23] S. Fortunato and M. Barthélemy. Resolution limit in community detection. Proc. Natl. Acad. Sci. U.S.A., 104(1):36–41, 2007. [24] S. Fortunato and C. Castellano. Community structure in graphs, http://arxiv.org/abs/0712.2716, Dec 2007. [25] M. Girvan and M. E. Newman. Community structure in social and biological networks. Proc. Natl. Acad. Sci. U.S.A., 99(12):7821–7826, June 2002. [26] R. Guimerà et al. Modularity from fluctuations in random graphs and complex networks. Phys. Rev. E, 70(2):025101, Aug 2004. [27] R. Guimera et al. The worldwide air transportation network: Anomalous centrality, community structure, and cities’ global roles. Proc. Natl. Acad. Sci. U.S.A., 102(22):7794–7799, 2005. [28] R. Guimera et al. Classes of complex networks defined by role-to-role connectivity profiles. Nature Physics, 3(1):63–69, January 2007. [29] R. Guimera and L. A. N. Luis. Functional cartography of complex metabolic networks. Nature, 433(7028):895–900, February 2005. [30] M. Gustafsson et al. Comparison and validation of community structures in complex networks. Physica A: Statistical Mechanics and its Applications, 367:559–576, July 2006. [31] H. Jeong et al. Lethality and centrality in protein networks. Nature, 411(6833):41–42, May 2001. [32] D. Kempe et al. Maximizing the spread of influence through a social network. In KDD ’03, pages 137–146, New York, NY, USA, 2003. ACM. [33] B. Krishnamurthy and J. Wang. Topology modeling via cluster graphs. In IMW ’01: Proceedings of the 1st ACM SIGCOMM Workshop on Internet Measurement, pages 19–23, New York, NY, USA, 2001. ACM. [34] Y. I. Leon-Suematsu and K. Yuta. A framework for fast community extraction of large-scale networks. In WWW ’08, pages 1215–1216, New York, NY, USA, 2008. ACM. [35] J. Leskovec et al. Statistical properties of community structure in large social and information networks. In WWW ’08, pages 695–704, New York, NY, USA, 2008. ACM. [36] L. Li et al. A first-principles approach to understanding the Internet’s router-level topology. SIGCOMM Comput. Commun. Rev., 34(4):3–14, 2004. [37] D. Liben-Nowell and J. Kleinberg. The link prediction problem for social networks. In CIKM ’03, pages 556–559, New York, NY, USA, 2003. ACM. [38] Z. Liu and B. Hu. Epidemic spreading in community networks. Europhys. Lett., 72(2), 2005. [39] B. Long et al. Community learning by graph approximation. In ICDM ’07, pages 232–241, Washington, DC, USA, 2007. IEEE Computer Society. [40] S. Lozano et al. Mesoscopic structure conditions the emergence of cooperation on social networks. PLoS ONE, 3(4):e1892, 04 2008. [41] D. W. Mcmillan and D. M. Chavis. Sense of community: A definition and theory. Journal of Community Psychology, 14(1):6–23, 1986.
[42] A. Mislove. http://socialnetworks.mpi-sws.org. [43] A. Mislove et al. Growth of the flickr social network. In Proceedings of the 1st ACM SIGCOMM Workshop on Social Networks (WOSN’08), August 2008. [44] B. A. Nardi et al. Why we blog. Commun. ACM, 47(12):41–46, 2004. [45] M. E. J. Newman. Fast algorithm for detecting community structure in networks. Phys. Rev. E., 69:066133, 2004. [46] M. E. J. Newman. Modularity and community structure in networks. Proc. Natl. Acad. Sci. U.S.A., 103:8577, 2006. [47] M. E. J. Newman and M. Girvan. Finding and evaluating community structure in networks. Phys. Rev. E, 69(2):026113, Feb 2004. [48] R. Oliveira et al. Observing the evolution of Internet AS topology. In SIGCOMM ’07, pages 313–324, New York, NY, USA, 2007. ACM. [49] R. Oliveira et al. Quantifying the completeness of the observed Internet AS-level structure. Technical Report TR 080026, UCLA CS Department, September 2008. [50] G. Palla et al. Uncovering the overlapping community structure of complex networks in nature and society. Nature, 435(7043):814–818, 2005. [51] G. Palla et al. Quantifying social group evolution. Nature, 446:664–667, April 2007. [52] N. Pathak et al. Social topic models for community extraction. In The 2nd SNA-KDD Workshop’08, August 2008. [53] F. Radicchi et al. Defining and identifying communities in networks. Proc. Natl. Acad. Sci. U.S.A., 101(9):2658–2663, 2004. [54] M. Rosvall and C. T. Bergstrom. An information-theoretic framework for resolving community structure in complex networks. Proc. Natl. Acad. Sci. U.S.A., 104(18):7327–7331, 2007. [55] M. Rosvall and C. T. Bergstrom. Maps of random walks on complex networks reveal community structure. Proc. Natl. Acad. Sci. U.S.A., 105(4):1118–1123, 2008. [56] B. Saha and L. Getoor. Group proximity measure for recommending groups in online social networks. In The 2nd SNA-KDD Workshop’08. ACM, August 2008. [57] S. Tauro et al. A simple conceptual model for the Internet topology. In GLOBECOM ’01, volume 3, pages 1667–1671 vol.3, 2001. [58] B. Viswanath et al. On the evolution of user interaction in facebook. In Proceedings of the 2nd ACM SIGCOMM Workshop on Social Networks (WOSN’09), August 2009. [59] K. Wakita and T. Tsurumi. Finding community structure in mega-scale social networks. CoRR, abs/cs/0702048, 2007. [60] S. Wasserman et al. Social Network Analysis : Methods and Applications. Cambridge University Press, November 1994. [61] Wikipedia. http://www.wikipedia.org. [62] W. W. Zachary. An information flow model for conflict and fission in small groups. Journal of Anthropological Research, 33:452–473, 1977.