Tracking Communities in Dynamic Social Networks Kevin S. Xu1 , Mark Kliger2 , and Alfred O. Hero III1 1
2
EECS Department, University of Michigan, 1301 Beal Avenue Ann Arbor, MI 48109-2122 USA {xukevin,hero}@umich.edu Medasense Biometrics Ltd., PO Box 633, Ofakim, 87516 Israel
[email protected]
Abstract. The study of communities in social networks has attracted considerable interest from many disciplines. Most studies have focused on static networks, and in doing so, have neglected the temporal dynamics of the networks and communities. This paper considers the problem of tracking communities over time in dynamic social networks. We propose a method for community tracking using an adaptive evolutionary clustering framework. We apply the method to reveal the temporal evolution of communities in two real data sets. In addition, we obtain a statistic that can be used for identifying change points in the network. Keywords: dynamic, social network, community, tracking, clustering.
1
Introduction
Traditionally, social network data have been collected through means such as surveys or human observation. Such data provide a view of a social network as a static entity over time. However, most social networks are dynamic structures that evolve over time. There has been recent interest in analyzing the temporal dynamics of social networks, enabled by the collection of dynamic social network data by electronic means such as cell phones, email, blogs, etc. [2, 6, 10]. A fundamental problem in the analysis of social networks is the detection of communities [7]. A community is often defined as a group of network members with stronger ties to members within the group than to members outside of the group. Previous studies on the community structure of social networks have typically focused on static networks. In doing so, the temporal dynamics of the networks and communities have been neglected. The natural extension of community detection to dynamic networks is community tracking, which makes it possible to observe how communities grow, shrink, merge, or split with time. In this paper, we propose a method for tracking communities in dynamic social networks. The proposed method makes use of an evolutionary clustering framework that detects communities at each time step using an adaptively weighted combination of current and historical data. The result is a set of communities at each time step, which are then matched with communities at other
2
Kevin S. Xu, Mark Kliger, and Alfred O. Hero III
time steps so that communities can be tracked over time. We apply the proposed method to reveal the temporal evolution of communities in two real data sets. The detected communities are more accurate and easier to interpret than those detected by traditional approaches. We also obtain a statistic that appears to be a good identifier of change points in the network.
2
Methodology
The objective of this study is to track the evolution of communities over time in dynamic social networks. We represent a social network by an undirected weighted graph, where the nodes of the graph represent the members of the network, and the edge weights represent the strengths of social ties between members. The edge weights could be obtained by observations of direct interaction between nodes, such as physical proximity, or inferred by similarities between behavior patterns of nodes. We represent a dynamic social network by a sequence[ of ]time snapshots, where the snapshot at time step t is represented t by W t = wij , the matrix of edge weights at time t. W t is commonly referred to as the adjacency matrix of the network snapshot. The problem of detecting communities in static networks has been studied by researchers from a wide range of disciplines. Many community detection methods originated from methods of graph partitioning and data clustering. Popular community detection methods include modularity maximization [7] and spectral clustering [12,14]. In this paper, we address the extension of community detection to dynamic networks, which we call community tracking. We propose to perform community tracking using an adaptive evolutionary clustering framework, which we now introduce. 2.1
Adaptive evolutionary clustering
Evolutionary clustering is an emerging research area dealing with clustering dynamic data. First we note that is possible to cluster dynamic data simply by performing ordinary clustering at each time step using the most recent data. However this approach is extremely sensitive to noise and produces clustering results that are inconsistent with results from adjacent time steps. Evolutionary clustering combines data from multiple time steps to compute the clustering result at a single time step, which allows clustering results to vary smoothly over time. Xu et al. [13] recently proposed an evolutionary clustering framework that adaptively estimates the optimal weighted combination of current and past data to minimize a mean-squared error (MSE) criterion. We describe the framework in the following. Define a smoothed adjacency matrix at time t by ( ) ¯ t = αt W ¯ t−1 + 1 − αt W t W (1) ¯ 0 = W 0 . αt can be interpreted as a forgetting factor that for t ≥ 1 and by W controls the amount of weight given to past data. We treat each network snapshot W t as a realization from a nonstationary random process and define the
Tracking Communities in Dynamic Social Networks
3
[ t] expected adjacency matrix Ψ t = ψij = E [W t ]. If we had access to the expected t adjacency matrix Ψ , we would expect to see improved clustering results by clustering on Ψ t rather than the noisy realization W t . However, Ψ t is unknown in real applications so the goal is to estimate it as accurately as possible. If we take the estimate to be the convex combination defined in (1), it was shown in [13] t that the[optimal choice ] of α that minimizes the MSE in terms of the Frobenius t t 2 ¯ − Ψ ∥ is given by norm E ∥W F n ∑ n ∑
( t )∗ = α
n ∑ n { ∑ (
( t) var wij
i=1 j=1 t−1 w ¯ij
−
) t 2 ψij
+ var
(
t wij
)}
,
(2)
i=1 j=1
where n denotes in the network. In a real application, ( t ) the number of nodes ∗ t ψij and var wij are unknown so (αt ) cannot be computed. However, it can be approximated by replacing the unknown means and variances with sample means and variances. The communities at time t can then be extracted by performing ¯ t. ordinary community detection on the smoothed adjacency matrix W Any algorithm for ordinary community detection can be used with the adaptive evolutionary clustering framework. In this paper, we use Yu and Shi’s normalized cut spectral clustering algorithm [14]. It finds a near global-optimal separation of the nodes into k communities, where k is specified by the user. The algorithm involves computing the eigenvectors corresponding to the k largest ¯ t , then discretizing the eigenvectors so eigenvalues of a normalized version of W that each node is assigned to a single community. We refer readers to [13] for additional details on the adaptive evolutionary spectral clustering algorithm. 2.2
Tracking communities over time
There are several additional issues that also need to be addressed in order to track communities over time. The communities detected at adjacent time steps need to be matched so that we can observe how any particular community evolves over time. This can be achieved by finding an optimal permutation of the communities at time t to maximize agreement with those at time t − 1. If the number of communities at time t is small, it is possible to exhaustively search through all such permutations. This is, however, impractical for many applications. We employ the following heuristic: match the two communities at time t and t − 1 with the largest number of nodes in agreement, remove these communities from consideration, match the two communities with the second largest number of nodes in agreement, remove them from consideration, and so on until all communities have been exhausted. Another issue is the selection of the number of communities k at each time. Since the evolutionary clustering framework involves simply taking convex combinations of adjacency matrices, any heuristic for choosing the number of communities in ordinary spectral clustering can also be used in evolutionary spectral
4
Kevin S. Xu, Mark Kliger, and Alfred O. Hero III
¯ t instead of W t . In this paper we use the eigenclustering by applying it to W gap heuristic [12] of selecting the number of communities k such that the gap between the kth and (k + 1)th largest eigenvalues of the normalized adjacency matrix is large. Finally, there is the issue of nodes entering or leaving the network over time. We deal with these nodes in the following manner. Nodes that leave the network ¯ t−1 in (1). Nodes that between times t − 1 and t can simply be removed from W ¯ t−1 . enter the network at time t have no corresponding rows and columns in W Hence, these new nodes can be naturally handled by adding rows and columns ¯ t after performing the smoothing operation in (1). In this way, the new to W nodes have no influence on the update of the forgetting factor αt yet contribute ¯ t. to the community structure through W
3 3.1
Experiments Reality Mining
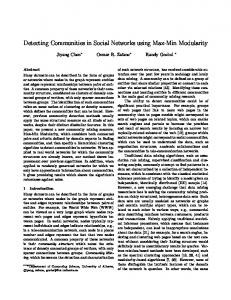
Data Description The MIT Reality Mining data set [2] was collected as part of an experiment on inferring social networks by monitoring cell phone usage rather than by traditional means such as surveys. The data was collected by recording cell phone activity of 94 students and staff at MIT for over a year. Each phone recorded the Media Access Control (MAC) addresses of nearby Bluetooth devices at five-minute intervals. Using this device proximity data, we construct a sequence of adjacency matrices where the edge weight between two participants corresponds to the number of intervals where they were in close physical proximity within a time step. We divide the data into time steps of one week, resulting in 46 time steps between August 2004 and June 2005. In this data set, we have partial ground truth to compare against. From the MIT academic calendar [5], we know the dates of important events such as the beginning and end of school terms. In addition, we know that 26 of the participants were incoming students at the university’s business school, while the rest were colleagues working in the same building. Thus we would expect the detected communities to match the participant affiliations, at least during the school terms when students are taking classes. Observations We make several interesting observations about the community structure of this data set and its evolution over time. The importance of temporal smoothing for tracking communities can be seen in Fig. 1. On the left is the heat map of community membership over time when the proposed method is used. On the right is the same heat map when ordinary community detection at each time is used, which is equivalent to setting αt = 0 in (1). Notice that two clear communities appear in the heat map to the left, where the proposed method is used. The participants above the black line correspond to the colleagues working in the same building, while those below the black line correspond to the incoming business school students. On the heat map to the right, corresponding to ordinary
Tracking Communities in Dynamic Social Networks
20 Participant
Participant
20
5
40 60
40 60 80
80 10
20 30 Time step
10
40
20 30 Time step
40
Fig. 1. Heat maps of community structure over time for the proposed method (left) and ordinary community detection (right) in the Reality Mining experiment. 1 Spring break begins
Fall term ends
Fall term begins
Estimated α
t
0.8 0.6 0.4 0.2 0
0
5
10
15
Winter term ends
Winter term begins
Thanksgiving 20
25
30
35
40
45
Time step
Fig. 2. Estimated forgetting factor αt by time step in the Reality Mining experiment.
community detection, the community memberships fluctuate highly over time. Thus we can see that tracking communities by the proposed method results in more stable and accurately identified communities. The estimated forgetting factor αt at each time step is plotted in Fig. 2. Six important dates are labeled on the plot. Notice that the estimated forgetting factor drops several times, suggesting that the structure of the proximity network changes, around these dates. This is a reasonable result because the proximity network should be different when students are not in school compared to when they are in school. Thus αt also appears to be a good identifier of change points in the network. 3.2
Project Honey Pot
Data Description Project Honey Pot [8] is an ongoing project targeted at identifying spammers. It consists of a distributed network of decoy web pages with trap email addresses, which are collected by automated email address harvesters. Both the decoy web pages and the email addresses are monitored, providing us with information about the harvester and email server used for each spam email received at a trap address. A previous study on the Project Honey Pot data [9] found that harvesting is typically done in a centralized manner. Thus harvesters are likely to be associated with spammers, and in this study we assume that the harvesters monitored by Project Honey Pot are indeed representative of spammers. This allows us to associate each spam email with a spammer so that we can track communities of spammers.
6
Kevin S. Xu, Mark Kliger, and Alfred O. Hero III 2
1000 1500
20
4
Spammer
Spammer
Spammer
500
6 8
100
12
2
4
6 8 Time step
10
12
60 80
10
2000
40
2
4
6 8 Time step
10
12
2
4
6 8 Time step
10
12
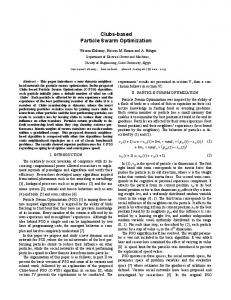
Fig. 3. Temporal evolution of the giant community (left), a persistent community (middle), and a “staircase” community (right) in the Project Honey Pot experiment.
Unlike in the previous experiment, we cannot observe direct interactions between spammers. The interactions must be inferred through indirect observations. We take the edge weight between two spammers i and j to be the total number of emails sent by i and j through shared email servers, normalized by the product of the number of email addresses collected by i and by j. Since servers act as resources for spammers to distribute emails, the edge weight is a measure of the amount of resources shared between two spammers. We divide the data set into time steps of one month and consider the period from January 2006 to December 2006. The number of trap email addresses monitored by Project Honey Pot grows over time, so there is a large influx of new spammers being monitored at each time step. Some spammers also leave the network over time.
Observations In this data set, we do not have ground truth for validation so the experiment is of an exploratory nature. At each time step, there are over 100 active communities, so rather than attempting to visualize all of the communities, as in Fig. 1, we instead try to visualize the evolution of individual communities over time. We discover several interesting evolution patterns, shown in Fig. 3. On the left, there is a giant community that continually grows over time as more and more spammers enter the network. The appearance of this giant community is quite common in large networks, where a core-periphery structure is typically observed [4]. In the middle, we illustrate a community that is persistent over time. Notice that no spammers change community until time step 12, when they all get absorbed into the giant community. Perhaps the most interesting type of community we observe is pictured on the right. We call this a “staircase” community due to the shape of the heat map. Notice that at each time step, many new spammers join the community while some of the existing spammers become inactive or leave the community. This suggests that either the members of the community are continually changing or that members assume multiple identities and are using different identities at different times. Since spamming is an illegal activity in many countries, the latter explanation is perhaps more likely because it makes spammers more difficult to track due to the multiple identities. Using the proposed method, it appears that we can indeed track these types of spammers despite their attempts to hide their identities.
Tracking Communities in Dynamic Social Networks
4
7
Related work
There have been several other recent works on the problem of tracking communities in dynamic social networks. [11] proposed to identify communities by graph coloring; however, their framework assumes that the observed network at each time step is a disjoint union of cliques, whereas we target the more general case where the observed network can be an arbitrary graph. [3] proposed a method for tracking the evolution of communities that applies to the general case of arbitrary graphs. The method involves first performing ordinary community detection on time snapshots of the network by maximizing modularity. A graph of communities detected at each time step is then created, and meta-communities of communities are detected in this graph to match communities over time. The main drawback of this approach is that no temporal smoothing is incorporated, so the detected communities are likely to be unstable. Other algorithms for evolutionary clustering have also been proposed. Relevant algorithms for community tracking include [6] and [1], which extend modularity maximization and spectral clustering, respectively, to dynamic data. [10] proposed an evolutionary spectral clustering algorithm for dynamic multi-mode networks, which have different classes of nodes and interactions. Such an algorithm is particularly interesting for data where both direct and indirect interations can be observed. However, one shortcoming in these algorithms is that they require the user to determine to choose the values for parameters that control how smoothly the communities evolve over time. There are generally no guidelines on how these parameters can be chosen in an optimal manner.
5
Conclusion
In this paper, we introduced a method for tracking communities in dynamic social networks by adaptive evolutionary clustering. The method incorporated temporal smoothing to stabilize the variation of communities over time. We applied the method to two real data sets and found good agreement between our results and ground truth, when it was available. We also obtained a statistic that can be used for identifying change points. Finally, we were able to track communities where the members were continually changing or perhaps assuming multiple identities, which suggests that the proposed method may be a valuable tool for tracking communities in networks of illegal activity. The experiments highlighted several challenges that temporal tracking of communities presents in addition to the challenges present in static community detection. One major challenge is in the validation of communities, both with and without ground truth information. Another major challenge is the selection of the number of communities at each time step. A poor choice for the number of communities may create the appearance of communities merging or splitting when there is no actual change occurring. This remains an open problem even in the case of static networks. The availability of multiple network snapshots may actually simplify this problem since one would expect that the number of
8
Kevin S. Xu, Mark Kliger, and Alfred O. Hero III
communities, much like the community memberships, should evolve smoothly over time. Hence, the development of methods for selecting the number of communities in dynamic networks is an interesting area of future research. Acknowledgments. This work was partially supported by the National Science Foundation grant number CCF 0830490. Kevin Xu was supported in part by an award from the Natural Sciences and Engineering Research Council of Canada. The authors would like to thank Unspam Technologies Inc. for providing us with the Project Honey Pot data.
References 1. Chi, Y., Song, X., Zhou, D., Hino, K., Tseng, B.L.: Evolutionary spectral clustering by incorporating temporal smoothness. In: Proc. 13th ACM SIGKDD International Conference on Knowledge Discovery and Data Mining (2007) 2. Eagle, N., Pentland, A., Lazer, D.: Inferring friendship network structure by using mobile phone data. Proceedings of the National Academy of Sciences 106(36), 15274–15278 (2009) 3. Falkowski, T., Bartelheimer, J., Spiliopoulou, M.: Mining and visualizing the evolution of subgroups in social networks. In: Proc. IEEE/WIC/ACM International Conference on Web Intelligence (2006) 4. Leskovec, J., Lang, K.J., Dasgupta, A., Mahoney, M.W.: Statistical properties of community structure in large social and information networks. In: Proc. 17th International Conference on the World Wide Web (2008) 5. MIT academic calendar 2004-2005, http://web.mit.edu/registrar/www/ calendar0405.html 6. Mucha, P.J., Richardson, T., Macon, K., Porter, M.A., Onnela, J.P.: Community structure in time-dependent, multiscale, and multiplex networks. Science 328(5980), 876–878 (2010) 7. Newman, M.E.J.: Modularity and community structure in networks. Proceedings of the National Academy of Sciences 103(23), 8577–8582 (2006) 8. Project Honey Pot, http://www.projecthoneypot.org 9. Prince, M., Dahl, B., Holloway, L., Keller, A., Langheinrich, E.: Understanding how spammers steal your e-mail address: An analysis of the first six months of data from Project Honey Pot. In: Proc. 2nd Conference on Email and Anti-Spam (2005) 10. Tang, L., Liu, H., Zhang, J., Nazeri, Z.: Community evolution in dynamic multimode networks. In: Proc. 14th ACM SIGKDD International Conference on Knowledge Discovery and Data Mining (2008) 11. Tantipathananandh, C., Berger-Wolf, T., Kempe, D.: A framework for community identification in dynamic social networks. In: Proc. 13th ACM SIGKDD International Conference on Knowledge Discovery and Data Mining (2007) 12. von Luxburg, U.: A tutorial on spectral clustering. Statistics and Computing 17(4), 395–416 (2007) 13. Xu, K.S., Kliger, M., Hero III, A.O.: Evolutionary spectral clustering with adaptive forgetting factor. In: Proc. IEEE International Conference on Acoustics, Speech, and Signal Processing (2010) 14. Yu, S.X., Shi, J.: Multiclass spectral clustering. In: Proc. 9th IEEE International Conference on Computer Vision (2003)