Perception & Psychophysics 1995,57 (3),409-415
Misalignment effects in 3-D versions of Poggendorff displays CHANGHONGUU and JOHN M. KENNEDY University oj Toronto, Scarborough, Ontario, Canada Strong misalignment effects are found in three-dimensional (3-D)versions of Poggendorff displays viewed binocularly. The components of the standard 2-D Poggendorff figure-the parallels and the oblique segments-were presented in 3-Ddepth as a flat rectangular object with occluding edges and an oblique line situated behind the object. Three experiments investigated the misalignment effects under three different observation instructions: Subjects were told to look at the oblique (Experiment 1), at the rectangle (Experiment 2), or at the background (Experiment 3). Experiments 1 and 2 examined the effects on judgments of alignment of varying the distance in depth that separates the oblique from the rectangle. Experiment 3 examined the effects of varying the distance between the fixated background and the 3-DPoggendorff figure. Both standard and reversed misalignment effects were obtained. When the viewing condition produces crossed disparity for the oblique, perceived misalignment occurs in the usual Poggendorff direction, but it is reversed with uncrossed disparity. Moreover, the amount of misalignment is related to the amount of disparity, and it can be much stronger than is usual in the 2-D versions of the Poggendorff. The misalignment effects can be explained by binocular integration to produce a single cyclopean image. In the Poggendorff illusion (Figure 1), the oblique lines erroneously appear to be misaligned. What we show here is that misalignment effects also appear in solid (three-dimensional, or 3-D) binocular versions of Figure 1. We show how the effects depend on factors arising during binocular integration. There is a variety of contradictory reports on binocular versions of the Poggendorff in the literature, and we show how each of the varied reports can be obtained and explained by standard principles of stereopsis. While sometimes it has been considered to be due to depth perception, Poggendorff misalignment has only rarely been associated with binocular vision. Fisher and Lucas (1969), Lucas and Fisher (1969), and Schiffman (1990) report that pictures of real-life settings, such as an oblique tree behind an upright tree, create the same effect as the Poggendorff figure. However, the observations were undertaken only with flat pictures, and possible binocular versions, though noted by these authors, were not assessed. Pieron (1955) tried explicitly to observe the Poggendorff effect in a fully 3-D world. He observed that the effect failed there! He stated that if the two segments ofthe oblique line are made ofrope passing behind a column and serving to pull a bucket out of a well, the illusion disappears completely. Julesz (1971) examined several illusions in random-dot stereograms. In particular, he observed that when the Poggendorff rectangle is sep-
arated from the oblique bar and appears in front of the bar in random-dot stereograms, the illusion is "greatly reduced or even disappears (sometimes even reverses)" in the cyclopean image (Julesz, 1971, p. 231). Here, we show that Julesz's claim is correct and how to relate it to fixation. We also show that the misalignment effect can be strengthened. Gyoba (1978), following Julesz, not only tested the Poggendorff figure using a stereogram but also tested the figure in real 3-D displays. He reports the Poggendorffillusion is greatly reduced under binocular viewing conditions. However, as we will show, the size of misalignment effects can either increase or decrease in binocular vision. There are at least three different ways under which the Poggendorff figure can be observed with binocular vision: with instructions to look at (1) the oblique (our Experiment 1), (2) the rectangle (Experiment 2), and (3) the background, or "far" part, of the visual world behind both the rectangle and the oblique (Experiment 3). Note our use of the term look at. When subjects are observing a close object, they may be unable to maintain perfect convergence and focus (i.e., fixation). Nevertheless, they can be attempting to make observations of the object. The difference between fixation and close-up regard is important to our experiments, as will become evident.
We would like to thank P. Bennett for his comments on an early version of this paper. Correspondence should be addressed to C. H. Liu and 1. M. Kennedy, Department of Psychology, University of Toronto, Scarborough, Ontario, MIC IA4, Canada (e-mail:
[email protected]. utoronto.ca or
[email protected]).
In Experiment 1, subjects were asked to look at the oblique while making judgments about alignment. The rectangle was fixed near the observer, and the distance between the rectangle and the oblique was varied.
EXPERIMENT 1 Looking at a Close-Up Oblique
409
Copyright 1995 Psychonomic Society, Inc.
410
LID AND KENNEDY
0.61), 0.72 (SD = 0.53), 0.55 (SD = 0.56), 0.44 (SD = 0.61), 0.34 (SD = 0.49), and 0.17 (SD = 0.32), respectively. The results were fitted to the exponential equation misalignment = kO + kl
Figure 1. Poggendorffillusion. The oblique or transverse lines are actually collinear but the right transversal appears to be too high.
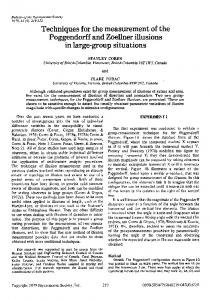
Method Subjects. Twenty-six undergraduate students participated in the experiment for course credit. The age mean was 20.1 years (SD = 2.3). Eleven subjects had normal vision, and 15 subjects had corrected-to-normal vision. Apparatus. A viewing box (Figure 2a) contained the 3-D version ofthe Poggendorfffigure. The size of the box was 27 X 25 X 102 cm. The aperture for viewing at the front was 14 X 5 em. The top of the box was open for illumination. The rectangle (23 X 5 em), made offoam board of0.3 em thickness, was placed in front of the observer, 10 em away from the aperture. Beyond the rectangle was a split screen (25 X 25 ern) on which a diagonal line (20 em long and 0.05 ern thick) was drawn in black ink. The line was at 45° to the horizontal. The screen was split in the middle (hidden behind the rectangle), and the right portion of the screen could be scrolled up or down. Adjustments to the diagonal were made by two knobs on the sides of the screen. One knob (at the top of the screen) turned a rod that pulled a film (on which the line was printed) upward. The lower knob pulled the film downward. A measure that could be used to indicate the amount of misalignment was printed on the center of the screen along its vertical direction. The screen could slide along the shoulders of the box to vary the separation between the rectangle and the screen. Procedure. The subjects were seated in front of the viewing box. The viewing position was fixed by a chin-and-forehead rest. The viewing distance between the eyes and the rectangle was 15 cm. This distance was fixed throughout Experiment 1. The subjects were told to look at the oblique. The distance between the rectangle and the oblique was varied by moving the oblique toward the rectangle or moving it away from the rectangle. Seven distances were tested, from 0 to 60 em in 10-cm steps. Each distance was tested three times per subject. Each set of seven distances formed a block of trials, and the order of the distances within each block was randomized differently in each of the three blocks. The subjects were first shown a demonstration, in which they were asked to move the right side ofthe oblique upward or downward until it looked aligned with the other oblique on the left side. The initial position of the adjustable oblique was also randomized. In each trial, the subjects told the experimenter to move the oblique upward or downward, and the experimenter acted accordingly until the oblique was reported to look aligned by the subject. Any misalignment was then recorded.
Results and Discussion Figure 3 shows the mean misalignments and standard deviations across subjects. The means and SDs in centimeters at each distance separating the rectangle and the oblique from 0 to 60 cm were 1.20 (SD = 0.29), 0.96 (SD =
X
exp (-k2
X
distance),
by adjusting parameters kO, kl, and k2 to minimize the X2 value. The result is shown in Figure 3. The misalignments were in the same direction as the 2-D Poggendorff figure in Figure 1. (We will call these positive misalignments; we will call the "reversed" effects, mentioned by Julesz, negative misalignments). A repeated measures analysis of variance (ANOYA) found a main effect for distance [F(6,150) = 39.35,MSe = 0.09,p < .0001]. An ANOYA ofcontrast variables revealed significant differences between the means at 0 and 10 em (p < .02), 10 and 20 em (p < .0003), 20 and 30 em (p < .001),30 and 40 ern (p < .04), and 50 and 60 em (p < .0008). The difference between the means at 40 em and 50 em was close to significance (p < .06). The 3-D misalignment effect was strongest when the rectangle and the oblique were in contact, and misalignment decreased as the distance between the rectangle and the oblique increased. At 60 ern, the mean misalignment was close to zero (0.17 em). The subjects reported difficulty in fixating comfortably on the oblique at close distances, but they reported no difficulty at far distances. Nevertheless, the subjects were able to adjust the oblique to look aligned. In related observations, we tested the condition in which the rectangle contacted the subject's forehead, and the distance between the rectangle and the oblique was 5 em. At this distance, very few observers could possibly fix-
r 01
b
a Figure 2. Apparatus used in the present study. Format a was used in Experiments 1 and 2. The inserts shown in b were used in Experiment 3 to replace the rectangle and the oblique used in Experiments 1 and 2.
3-D MISALIGNMENT EFFECTS
411
ate comfortably on the oblique, but all were able to adjust the oblique into apparent alignment. Fifteen undergraduate volunteers participated. Each subject was given two trials. The mean misalignment was 2.84 em, which was much higher than the maximum obtained from Experiment 1 (1.20 em at 15 em). Evidently, there was a marked change in misalignment from this result to 15 em. As a result, we expected the nonlinear trend found in Experiment 1 to continue when the rectangle and oblique approached the eyes.
Results and Discussion Figure 4 shows the means and standard deviations across subjects at each separation. The means and SDs in centimeters from 0 to 70 em were 0.56 (SD = 0.29), -0.74 (SD = 0.32), -1.58 (SD = 0.45), -1.63 (SD = 0.37), -2.02 (SD = 0.49), -2.01 (SD = 0.32), -2.20 (SD = 0.37), and -2.21 (SD = 0.36), respectively. The negative values at 10 em and above indicate that the direction of the misalignment was opposite to those in Experiment 1 and the Poggendorff illusion of Figure 1. Again, the exponential function used for Experiment 1 results was applied to find the best-fitting line. A repeated measures ANOVA found a main effect of distance [F(7,112) = 189.l2,MSe = 0.08,p< .0001]. The analysis of contrast variables showed significant differences between the means at 0 and 10 em (p < .0001),10 and 20 em (p < .0001), 30 and 40 em (p < .001), and 50 and 60 em (p < .001). The means at 20 and 30 em, 40 and 50 em, and 60 and 70 em were not significantly different. When the distance between the rectangle and the oblique was 0 em, the misalignment effect was consistent with the 2-D Poggendorff effect. When the distance was greater than 10 em, the misalignment effect was reversed: instead of the right side of the oblique appearing too high (as in Figure 1), it appeared too low. As can be seen from Figure 4, somewhere between 0 and 10 em, there was no misalignment effect. This finding is consistent with the Julesz (1971) and Gyoba (1978) findings. They also found that the 2-D version ofPoggendorff effect reduces when viewed with 3-D separation between the rectangle and the oblique component. However, with large separations the misalignment reverses strongly.
EXPERIMENT 2 Fixation on the Rectangle
EXPERIMENT 3 Fixation on the Background
In Experiment 2, subjects were asked to fixate on the rectangle when making judgments about alignment. The distance between the rectangle and the observer was fixed at 25 em (10 em greater than in Experiment 1) to ensure that the subjects were able to fixate on the rectangle. The maximum distance between the rectangle and the oblique was set to 70 em. Measuring a larger range than 70 em is difficult because the oblique line becomes blurred as the distance between the oblique and the fixated rectangle increases. Other aspects of Experiment 2 were the same as Experiment 1.
In Experiment 3, we kept the distance between the rectangle and the oblique constant at 0 em throughout the
1.5
E
.£.
1.0
C CD
E
'"
.2'
I
0.5
0.0
Lr-----r--.----.---,---.---,. o 10 20 40 50 60 30 Distance between rectangle and oblique(em)
Figure 3. Misaligument as a function ofthe distance between the rectangle and the oblique in Experiment 1. The curve is described by the equation: misaligument = -0.41 + 1.61 x exp (-0.02 x distance).
Method Subjects. Seventeen undergraduate students participated in the experiment for course credit. The mean age was 20.4 years (SD = 2.0). Seven had normal vision; 10 had corrected-to-normal vision. Apparatus. The apparatus in Experiment I was also used in Experiment 2. Procedure. Most aspects of the procedure were the same as those in Experiment I except: (I) eight separations between the rectangle and the oblique were tested, from 0 to 70 ern in 10-cm steps, (2) each separation was tested twice for each subject instead of three times, and (3) the subjects were instructed to fixate on the rectangle while making alignment judgments.
1.0 0.5
Ic
CD
E
0.0 -0.5
'"
.2'
jJ -1.0
~
-1.5 -2.0 -2.5 0
10
20
30
40
50
60
70
Distance between rectangle andoblique(em)
Figure 4. Misalignment as a function of the distance between the rectangle and the oblique in Experiment 2. The curve isdescribed by: misalignment = - 2.20 + 2.75 x exp (- 0.06 x distance).
412
LID AND KENNEDY
experiment. The subjects were asked to fixate on a small "x" marked on a panel that was placed behind the rectangle and the oblique. The distance between the "x" and the figure was varied from 0 to 70 em, and tests were made every 10 em. The distance between the rectangle and the observer's eyes was fixed at 25 cm.
Method Subjects. Eighteen undergraduate students participated in the experiment for course credit. The mean age was 19.4 (SD = 1.9).The subjects had either normal vision or corrected-to-normal vision. Apparatus. The viewing box of Experiments I and 2 was modified by changing the opaque screen to a transparent film (see Figure 2b). The rectangle remained opaque. The oblique lines were wires. The oblique wire on the left was attached to the rectangle. The wire on the right side of the rectangle was fixed to a transparent film, which could be pulled up or down by two rollers on the back of the rectangle. The wires and the transparent film allowed the observer to look through the film and fixate on the "x" in the background. Printed marks on the back of the rectangle were used to measure the subjects' alignment judgments. The size of the background panel was 25 X 20 em, with a small "x" of 0.5 X 0.5 em printed on the top right. The "x" was not printed in the middle of the panel because, when the distance between the figure and background was close, the rectangle would block the view of the "x." Two arms on the panel allowed the panel to be hung on the shoulders of the viewing apparatus at various distances. Procedure. The subjects were instructed to fixate on the "x" on the background panel while making judgments about alignment. The distances measured between the Poggendorff figure and the background were 0 to 70 em as in Experiment 2. Other aspects of the procedure were the same as those in Experiment 2.
Results and Discussion Figure 5 shows the means and standard deviations at each distance. The means and SDs in centimeters from 0 to 70 em were 1.08 (SD = 0.66), 2.09 (SD = 0.91), 2.75 (SD = 0.66), 3.16 (SD = 0.66), 3.51 (SD = 0.61), 3.73 (SD = 0.53), 3.98 (SD = 0.48), and 4.09 (SD = 0.49), respectively.
5.0
4.0
Ic Q)
E
3.0
.~
)
2
2.0
1.0
O.O.,._--,.----_-r-_-,_.....,._--,_ _,-_...,
o
10
20
30
40
50
60
70
Distance betweenfigureand background (em)
Figure 5. Misalignment as a function of the distance between the figure (the rectangle and the oblique) and the background in Experiment 3. The curve is described by: misalignment = 4.40 - 3.30 x exp (-0.03 X distance).
A repeated measures ANOVA found an overall main effect for distance [F(7, 119) = 172.00, MS e = 0.11, P < .0001]. An ANOVA of contrast variables found significant differences between means at 0 and 10 em (p < .0001), 10 and 20 em (p < .0001), 20 and 30 em (p < .0001), 40 and 50 em (p < .001),50 and 60 em (p < .0002), and 60 and 70 em (p < .04); the contrast between 30 and 40 em was not significant. In Experiment 3, when the background was in contact with the figure, the misalignment was at a minimum; the more the background separated from the figure, the larger the misalignment. GENERAL DISCUSSION Misalignment effects arose in all three observation conditions examined here. The direction of the misalignment was influenced by observation conditions. When the subjects were directed to look at the oblique (Experiment 1) or to fixate the background (Experiment 3), the right hand side of the oblique in binocular figures mimicking Figure 1 appeared too high. On the other hand, when the fixation was on the rectangle, the right hand side of the oblique appeared too low if the distance between the rectangle and the oblique was greater than 10 em (Experiment 2). Note that these effects can also be readily observed via simple devices such as a spectacles case (as a surrogate for the rectangle) and a pencil (as a surrogate for the oblique). The condition where the case is touching the face and the pencil is too close to maintain fixation produces a very striking apparent misalignment. Why do the 3-D misalignment effects occur? The effects can be explained as by-products of binocular disparity and integration. The binocular system fixates on an object by convergence. Objects not lying on the horopter, or surface, of convergence provide double images. Objects more distant than the horopter produce uncrossed disparities, while objects nearer than the horopter produce crossed disparities. Applying this to our experiments, we would expect a crossed double image of the rectangle when the fixation is more distant than the rectangle (Experiment 1) and an uncrossed double image ofthe oblique when the fixation is on the rectangle (Experiment 2). When the rectangle and the oblique are on the same surface but the fixation is on a more distant surface (Experiment 3), we would expect crossed double images of both the rectangle and the oblique at the same time. Binocular vision involves what has been called the cyclopean eye (Julesz, 1971), a percept formed by "integrating" the input from the two eyes, dealing with disparity between the two. "In general the double images of nonfixated objects are usually suppressed and go unnoticed" (Schiffman, 1990, p. 356). Integration is not a simple combination or juxtaposition ofthe input from the two different views. Integration results in some features of the visual input being particularly evident in the final percept. Retinal rivalry frequently results in local contralateral suppression. The cyclopean percept can be a patch-
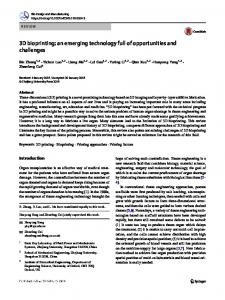
3-D MISALIGNMENT EFFECTS work: some parts are due to one eye and some parts are due to the other eye, as Fox (1991) notes. With this principle in mind, consider the 3-D Poggendorff displays. The binocular combinations of rectangles and obliques need to be considered in detail. Figure 6 shows typical situations in Experiment I, where both the rectangle and the oblique were close to the observer. Figure 6a is a double image of a rectangle. It has three panels, the center formed by the combination or overlap of the left image and the right image. However, what is generally perceived by the cyclopean eye is not the double image of a rectangle but a single rectangle. What happens is that the double image includes a region of "overlap." The central region of overlap is the left portion of the rectangle due to the right eye's input and the right portion of the rectangle in the left eye's input (Schiffman, 1990, p. 358, Figure 16.22; Sharp, 1928). The overlap region is, of course, narrower than either of the rectangles contributing to the overlap. In short, the percept involves an unduly narrow rectangle, the region of binocular combination or overlap (as Figure 6b shows). Now, if we attach an oblique to the stimulus rectangle, what the cyclopean eye notes is not a double image of a rectangle and an oblique (as shown in Figure 6c) but a narrow rectangle and the two obliques attached to it, suggesting a misaligned oblique (as shown in the center of Figure 6d). Indeed, it is only with deliberate effort that one observes the presence ofthe doubled tips or ends of the oblique (suggested by the fading lines A and B in Figure 6d). Generally, the extra tips shown by the fading lines A and B go "unnoticed" in the cyclopean
a
b
~
:8
/1 A: c
.
d
Figure 6. (a) Two views of a rectangle, partially combined. (b) A cyclopean image of the rectangle, where the region of combination is strongly evident. (c) Two different views of an oblique added to (a). Oblique tips A and B belong to images from different eyes. (d) A cyclopean image of(c), where the region ofcombination is strongly evident and two of the obliques are also particularly evident. The double images in these figures are "crossed" double images.
413
percept, as Schiffman puts it. Once one notices the extra tips and realizes that they are the true extensions of the obliques attached to the unduly narrow, or overlap, rectangle, the reason for the misalignment is evident. Notice the importance of the close-up observation conditions. If the subject had fixated on the oblique, how could the oblique provide a double image? If the subject had fixated on the oblique, it should be on the horopter, and there should only be a single image. It is key that there were short distances involved in Experiment I. The opaque rectangle was 15 cm from the observer's eyes, where it was difficult to maintain fixation. As the oblique receded to a position where fixation could be maintained comfortably on it, the misalignment disappeared. Note that the unduly narrow cyclopean rectangle is still unduly narrow when the oblique is at a far distance. Hence, it is not just the narrowness of the cyclopean rectangle that produces the misalignment. Furthermore, when deliberate effort raises the double images of the oblique into perception, the correct alignment can be observed. Therefore, the misalignment effect in Experiment 1 seems to have been due to cyclopean emphasis on a central region of binocular combination, where there was an apparently narrow rectangle and a mismatched oblique. Now, let us use similar principles governing the formation of a cyclopean percept to explain the results in Experiment 2, where fixation could be maintained on the rectangle. When the oblique is in contact with the rectangle, the display is simply a version of the standard 2-D Poggendorff illusion. As the oblique retreats from the observer, however, the parts of the oblique that are occluded change. Consider the case in Figure 7. To the left eye, some parts of the oblique's left side become visible. To the right eye, some parts of the oblique's right side become visible. A double image of the oblique is often present when the oblique is at a distance from the rectangle; however, in this particular case, the left tip of the oblique to the right eye and the right tip of the oblique to the left eye happen to be occluded by the rectangle (as shown by the dotted lines), which gives an impression of a misaligned oblique. Notice the result is a misalignment that is the reverse of the effect in the 2-D figure. Hence, misalignment can be less than the 2-D effect, when the binocular effect is quite slight and the 2-D effect is not entirely swept aside. Also, the misalignment can be zero, when the 2-D effect and the binocular effect are equal but opposite. The apparent misalignment can be the reverse of the 2-D Poggendorff, since the binocular effect can be quite large and dominate in the cyclopean figure. What happens in Experiment 2 if the oblique line is long enough that its tips are not occluded by the rectangle for either eye? Do we simply see double images of the oblique? The answer is no. Remember Figure 6 (Experiment 1) involves a double image of the oblique, but misalignment is present because of mismatches between left- and right-eye views of parts of the oblique. In Experiment 2, at the appropriate distance, there were precisely these kinds of mismatches, as shown in Figure 8.
414
LID AND KENNEDY
Figure 7. An example of an oblique in a double image. The dotted lines show the occluded tips of the two obliques. This gives an impression of a single misaligned oblique. The cyclopean image pairs the two obliques that are not occluded, even though they originate from different views. The double images here are "uncrossed."
In Figure 8, the test element (the oblique line) is apparent to both eyes, but is diplopic (i.e., the line gives double images). But the left side of the oblique is dominated by the left eye's view, whereas the right side of the oblique is dominated by the right eye's view in the cyclopean eye. As schematically illustrated in Figure 8, in the cyclopean image, the image due to the left eye is clearer than the image due to the right eye at the left side of the rectangle. Conversely, the image due to the right eye is clearer than the left image at the right sid~ of the rectangle. Because of this, even though the endings of the oblique are presented to both eyes in this situation, the impression of misalignment continues, much as in Figure 8. We can apply the same explanation given to Experiment I to Experiment 3: fixation on the background. Why does the illusion magnitude/distance relationship change when all parts of the figure are seen in crossed disparity? Conveniently, Figure 6 can be used to describe the effects in Experiment 3, where both the rectangle and the oblique involve double images, since fixation is on the background. In Experiment 3, the double images combine, as they do in Experiment 1. The central cyclopean rectangle appears unduly narrow, and the left and right sides ofthe oblique are mismatched, producing apparent misalignment. The size of the misalignment in the three experiments is influenced by the amount of disparity. The amount of disparity is determined by how far the object is separated from the horopter, and, hence, the amount of disparity, crossed or uncrossed. If the disparity is crossed, the direction ofthe illusion is the same as the Poggendorff, and if the disparity is uncrossed, the direction of the illusion reverses the Poggendorff. Also, since the misalignment depends on disparity differences, which can vary considerably, quite large misalignments are possible in 3-D versions of the Poggendorff. Gyoba (1978) investigated binocular versions of the Poggendorffwith depth separations of the rectangle and oblique from 0 to 10 em. His viewing distance was 60 em
(i.e., quite far, in relation to a comparatively small separation between the rectangle and the oblique). Subjects were instructed to gaze at the center of the rectangle. Gyoba found a slight decrease in the illusion as the separation increased. Gyoba's conditions were replicated in Experiment 2, and the same results were obtained. If Gyoba had increased the separation between rectangle and oblique, the illusion would have reversed, as the results of Experiment 2 revealed. Pieron's (1955) observations were informal, but ifhe had the appropriate separation distances between his oblique (a rope) and his "rectangle" (a column) and fixated on the "rectangle," he could have been situated at the point where the decrease of the illusion was just cancelling the illusion completely. If Julesz's (1971) Poggendorff figure is an appropriate guide, his observations were made with comparatively slight separation distances between the oblique and the rectangle, in the random-dot-stereogram-defined scene. In any case, Julesz did not relate the variations in his observations to variations in his fixations or to manipulations of the depth in the scene. But his observations that the Poggendorffeffect can be reduced (or disappear or reverse) is in keeping with the results of Experiment 2, particularly ifhe made his observations with different binocularly defined depth separations between the obliques and the rectangle. We would like to add an important caution. We would like to acknowledge that our explanation of 3-D misalignment effects does not apply to the 2-D Poggendorff effect. Our experiments were not addressed to the question of the origin of 2-D Poggendorffmisalignment. It is still a puzzle. However, our results should be taken as a clear indication to researchers interested in the 2-D Poggendorff that there are pitfalls involved in interpreting 3-D versions of the Poggendorffwithout taking into account the principles of binocular vision. Recently, Day and Halford (I994) examined a tilted 2-D Poggendorffmade of solid bars, resting on a flat surface, viewed binocularly and monocularly. Since they
Figure 8. Double images of an extended oblique in the cyclopean image. The oblique is sufficiently lengthy so that each view contains segments of the oblique on either side ofthe occluder. The left image ofthe right part of the oblique is shown as comparatively faint, and vice versa for the right image. Like Figure 7, the double images here are "uncrossed:'
3-D MISALIGNMENT EFFECTS
rested on a flat surface, the bars had a common plane with the Poggendorff "rectangle," although in depth from the observer one oblique was nearer to the observer than the other. Day and Halford found the binocular illusion was stronger than the monocular one, producing "a slight but persistent misalignment" (p. 153). Note that their testing condition was different from the present one. Their version of the "rectangle" and their obliques were all in the same plane at all times. Furthermore, subjects were not given instructions to fixate on the "rectangle" or on the obliques. Hence, the effects are not known to be due to differences in the status of the rectangle and the obliques in binocular vision. Indeed, Day and Halford explain their effects as due to subjects' making judgments ofthe positions ofthe bars relative to the main axis of the figure, producing a percept that is a "compromise" between judgments made on different bases. Also, Day and Halford anticipate that a similar explanation applies to the standard 2-D Poggendorff. In contrast, we stress that our report aims to show how the literature on 3-D binocular investigations of the Poggendorffthat vary the locations of the elements in depth needs to take into account relative viewing distances of the Poggendorff components and fixation locations.
415
REFERENCES DAY, R. H., & HALFORD, A. L. P. (1994). Apparent misalignment of oblique coplanar bars in depth. Perception & Psychophysics, 56, 148-154. FISHER, G. H., & LUCAS, A. (1969). Illusions in concrete situations: I. Introduction and demonstrations. Ergonomics, 12, 11-24. Fox, R. (1991). Binocular rivalry. In D. Regan (Ed.), Binocular vision (pp. 93-110). London: Macmillan. GYOBA, J. (1978). The Poggendorff illusion under stereopsis. Tohoku Psychological Folia, 37, 94-101. JULESZ, B. (1971). Foundations of cyclopean perception. Chicago: University of Chicago Press. LUCAS, A., & FISHER, G. H. (1969). Illusions in concrete situations: II. Experimental studies of the Poggendorff illusion. Ergonomics, 12, 395-402. . PiERON, H. (1955). La Perception: Symposium de L'Association de Psychologie Scientifique de Langue Francoise [Perception: Symposium of the French Language Association for Scientific Psychology]. Paris: Presses Universitaires de France. SCHIFFMAN, H. R. (1990). Sensation and perception: An integrated approach. New York: Wiley. SHARP, W. L. (1928). The floating-finger illusion. Psychological Review, 35,171-173.
(Manuscript received January 21, 1994; revision accepted for publication November 21, 1994.)