Misuse Load Cases and MBS Simulation Prof. Dr.-Ing- Ch. Oertel FH Brandenburg, Germany Version Wednesday, May 20, 2009
Introduction Full vehicle simulations cover a wide range of excitations, which may be generated by the driver, control devices or road disturbances. Looking at road disturbances, wavelength and magnitude can be used to characterize different conditions. Handling simulations for instance are often done on local undisturbed ground surfaces – measured race tracks based on GPSdata for instance. In consequence, very low excitation frequencies allow the use of tire models based on steady state conditions. In the case of ride, discrete obstacles or road profiles from local surface measurement are taken into account – small wavelength with also small magnitudes will be found. Ride is limited in the frequency area by approximately 50 [Hz], but the road profiles require tire models which are able to compute the contact area’s shape and pressure distribution – modeling of tire structure flexibility is needed. Among the load cases concerning vehicle suspension strength and durability, special road profiles with small wavelength and larger magnitudes as well as discrete obstacles can be found, among these, also misuse obstacles. Due to the impact like character of a tire running into a pothole, higher frequencies will be excited and the dynamics of the tire structure has to be taken into account. Some questions arise when related prototype tests shall be planed. One of them is the determination of the critical velocity. At low vehicle speed, the small amount of kinetic energy can not cause larger contact forces while at high velocity, the spring preload is not able to accelerate the wheel into the pothole during the obstacle crossing time. Therefore, between smaller and larger velocity, there must be a condition of maximum suspension load. When the range of velocities between 30 and 60 [km/h] is divided by 10 steps and two tire-rim combinations, two inflations and two obstacles should be looked at, the number of runs is 80. In consequence, the vehicle model and the tire model are limited in complexity with respect to the computational effort. Concerning vehicle modeling, usually a multibody dynamics system (mbs) is used. Tire Modeling The load path of a typical passenger car tire is based on the inflation pressure, which preloads the structure. The load is carried by belt and sidewall as tensile elements and not by spokes. In normal rolling conditions, contact occurs between tire and road surface. To handle misuse deformations, the contact between the inner surface of the tire and the rim has to be added to the model. A second load path is established, if inner contact between rim and tire or two tire surfaces occurs, as in the run flat and in the misuse case. Looking at structure dynamics involving contact and friction, finite element models are usually the first choice. Because of there large computational effort, the number of runs for instance to determine the above mentioned critical velocity is limited. Some simplifications may help to overcome the limitations, especially if the rim forces are of greater interest and not the stresses and strains inside the tire. A starting point in modeling a tire with FEM could be a structure representation using rebar elements for belt and carcass together with different linear or nonlinear rubber matrix material models. This leads to a FE model, which is close to the physical nature of the tire but contains a large number of nodes and elements. Classical reduction techniques like condensation are able to reduce the number of nodes and therefore the number of degrees of freedom. Another or additional way is to replace rebar elements by elements with anisotropy. The resulting model is still too expensive concerning computational effort in mbs full vehicle dynamics with respect to the required number of runs.
Going a step further, the load carrying structure is assembled in quad 4 elements, where the rebars are condensed analytically to the four nodes, avoiding any numerical integration. A typical mesh of the belt is shown in Figure 1. A curved contact layer at the outer tire surface is connected to the belt grid by an elastic foundation. The contact layer has a different node density, which normally will be of higher density than that of the belt. The contact or gap nodes are loaded by the footprint forces in the contact area if the gap to the road surface is closed, from which the contact area’s shape and the normal stress distribution is known. The contact nodes transfer the load to the belt and carcass. Some additional discrete elements are used to represent the bending stiffness of the rubber matrix. By rotation of the cross section, belt mesh, sidewall mesh and rim nodes are generated. Figure 1: belt mesh Rim nodes move together with the mbs part rim of the vehicle model. This simplified flexible structure dynamics model is able to follow the load path idea, based on inflation pressure and preloads in the structure elements. Together with contact algorithm and friction model, the tire model RMOD-K FB is build. The computational effort in this model is a linear function of the number of nodes because of the explicit time integration method. This ensures that the peak loads are not influenced by numerical damping. Tire Model Extensions The misuse load case requires additional model elements, which are able to generate contact forces between rim and inner tire surface. The basic idea before starting the development of the RMOD-K FB extensions was to add only a few new parameters and to keep the computational effort as small as possible. The rim is represented by a nonlinear stiffness in every rim node concerning the radial displacement. At the structure nodes of the belt grid, corresponding nonlinear stiffness elements exists. The combination of both represents the inner contact mechanism, shown in the principal drawing of Figure 2. The upper nonlinear stiffness represents the rim part of the inner contact while the lower ones are symbols of the tire inner surface. If the gap between rim and belt nodes closes, the unilateral stiffness elements begin to work. This can Figure 2: inner contact be expressed by the gap indicators. In consequence, only one additional nonlinear equation per rim node must be solved in every integration step and only if contact occurs in that node - indicated by at least one gap indicator greater than zero. Five new parameters describe the different materials. The rim related one is an elastic-plastic approach with constant slopes cE and cP. The border between elastic and plastic behavior is given by the force FE. Due to the elastic plastic behavior of the rim, an additional dissipation mechanism is included in the model. The rubber related stiffness relation is a simple nonlinear function with two parameters. If results from material tests are available, any other nonlinear function can be implemented. In combination of both, only five new values are added to the tire model data set. The model extension based on unilateral contact elements between rim and inner surface of the tire is completed by the initial gap information from the tire’s cross section. It enables the model to deal with obstacles like cleats or deep potholes, which are of the same dimension (height or depth) as the tire sidewall. Wheel load peaks at impact situations like misuse tests may reach more than 70 [kN] with a typical passenger car tire.
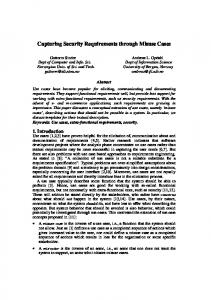
Figure 3: validation
Two possible ways of parameter determination are test of rim and tire local material properties or measurement of the global vertical stiffness of tire and rim. The first approach was to measure the vertical stiffness of the combination of tire and rim. The results where used for determination of the five new parameters. Comparison between measurement
and simulation in Figure 3 shows sufficient accuracy. But looking at suspension loads, not only the vertical force is of interest, but also the torque generated by the asymmetry of the rim. A new test rig was build, which is able to measure the rim stiffness at both sides separately as well as the combined stiffness of tire and rim. This leads to different rim stiffness functions on left and right rim side based on three measurements: rim left and right load deflection relation and tire and rim combination and results in eight parameters. In the example of Figure 4, up to 60 [mm] vertical displacement, the second or inner load path with contact between rim and tire is not active. In consequence, the torque remains zero and the vertical stiffness is a linear function of displacement. At larger displacements, the second load path becomes active and the torque goes up to 900 [Nm] and more as to be seen in Figure 4. Figure 4: torque from inner contact
Application Example Using the model extension, the critical velocity of a simple mbs vehicle model is investigated. Two versions of the vehicle model have been build, one using joints between suspension and body and the other using bushings. The suspension geometry at the front axle differs from that at the rear to show the influence of the suspension design. The vehicle runs trough a pothole obstacle and is at equilibrium with constant velocity before. The front axle results are shown in upper part of Figure 5. The vertical and the longitudinal forces correlate concerning the critical velocity, which is to be found between 30 and 40 [km/h], around 35.
Figure 5: full vehicle results - tire forces
Only at 30 [km/h] – the red lines – the wheel reaches the ground of the pothole. At any other velocities, the contact takes place at the positive inclined surface of the obstacle and at the
last edge, the maximum peak load is reached. The bushing version of the vehicle model generates less tire forces. This can be explained by the relative motion of the wheel with respect to the joint version, the wheel is able to avoid larger force levels by moving round the obstacle. The front axle runs into the hole based on a steady vehicle states while at the rear axle, effects from the pitch motion – influenced for instance by the wheelbase – build some interaction between impact situation and vehicle properties. The correlation between vertical and longitudinal forces vanishes at the rear axle (lower part of Figure 5) and the bushing version generates a similar force level compared with the joint version. The critical velocity at the rear axle is higher than at the front axle looing at the results in the vertical force direction. One reason is the different suspension geometry at the rear. Another reason for differences between front and rear tire forces results from pitch angle excitation when the front axle is crossing the obstacle. The impact situation – expressed by the time history of the rear wheel load – depends strongly on the pitch angle of the vehicle. During the impact of the front, the rear axle is loaded and the pitch angle motion leads to vertical wheel travel. In the situation when reaching the first edge of the obstacle, the rear wheel moves up for instance at lower velocity. If – at higher vehicle velocity – the wheel moves down when reaching the first edge, the impact loads will be higher. This explains the differences in the critical velocity between front and rear axle. Simulation results usually are compared with measurements. To do this, a test vehicle with a complete passenger car rear axle including differential gear box and equipped with several sensors and cameras is build for indoor tests. An mbs simulation model of the car is used for comparison. Two different obstacles have been build, a cleat and a pothole. Only the rear axle is crossing the obstacles because of the different wheel track at front and rear axle. The tests were run by IAT mbH in Berlin. It was possible to minimize the number of test searching the critical velocity with the simulation model instead the real vehicle: the measurement results identified the same range of maximum suspension loads as predicted from the simulation. From comparison between measurement and simulation, some limitation of the mbs model where found, for instance the assumption of a mass less spring or the formulation of bump stop forces. Summary The possibility of simulating full vehicle misuse behavior enables OEMs to obtain fundamental information regarding the misuse-relevant force level and damage chain in an early phase of the design process. Extensions of the tire model RMOD-K FB were made in order to run such simulations. A major goal of this extension was to add only a small additional computational effort and a small number of parameters, which are measured on a new test rig. Using the simulation approach to assess a vehicle’s overall misuse behavior will help to reduce the number of prototype tests, which involve the risk of additional, extremely cost-intensive and time-consuming modifications and validation loops at a very late stage of the development process. Contact
[email protected]
www.RMOD-K.com