Mobile Application Benchmarking Based on the Resource Usage Monitoring
Reza Rawassizadeh Department of Distributed and Multimedia Systems, University of Vienna
[email protected]
ABSTRACT There are many mobile applications currently available on the market, which have been developed specifically for smart phones. The operating systems of these smart phones are flexible in order to facilitate the application development for programmers regardless of the lower layers of the operating system. Mobile phones like other pervasive devices suffer from resource shortages. These resources vary from the power (battery) consumption to the network bandwidth consumption. In this research we identify and classify mobile resources and propose a monitoring approach to measure resource utilization. We provide a monitoring tool, which generates traces about the resource usage. Then we propose a benchmarking model which studies traces and enables users to extract qualitative information about the application from quantitative resource usage traces. Results of the study could assist quality operators to compare similar applications from their resource usage point of view, or profile a single application resource consumption. Keywords: Mobile Application, Benchmarking, Resource Utilization, Utility Function INTRODUCTION According to studies, done by Compass Intelligence, companies in United States will have spent $11.6 billion on mobile applications by 2012 [4]. This indicates a significant increase in the number of mobile applications from both quantity and quality point of view. Many duplicate applications with similar functionalities and features end up on the market. Mobile phones are subsets of pervasive devices and like other pervasive devices; they have finite energy sources [16]. Pervasive devices also suffer from client thickness [17]. This means that there will always be the challenge of willingness to increase the quality of an application while dealing with the shortage of available resources. Studies revealed that users prefer buying mobile phones with more features [21]. Adding more features increases the resource utilization and fosters more powerful devices. Using less resources and providing the desired functionalities increase the application efficiency. Developers and researchers try to handle resource shortages of the pervasive devices in different ways, such as studying the context and adapting the device to the current context [1], optimizing energy usages with a CPU scheduler [23] and so forth. This information allows us to realize that the resource usage of an application is an
1
important factor for mobile devices, which could affect the application’s quality. Resource utilization is one of the performance metrics. Among other performance metrics include application response time, throughput, reliability and availability [10]. For example let us consider a scenario where a user intends to purchase an audio player for his smart phone. There are many different choices on the market, “Music player X” is an audio player which plays user desired audio format like MP3 and gets some information about the current music track from the Internet. “Music player Y” is another audio player, which does not only play the desired audio format and gets the information from the Internet but also sends the audio track name to the micro-blog account (like twitter or friendfeed ) of the user. These features might be attractive for some users, but wireless network bandwidth is currently limited and expensive. A quality operator can study which application requires less network connection as a capability fact and decides upon choosing the appropriate application. Large scale industrial mobile device producers, who are interested in purchasing applications from third parties and embed them into their devices, can benefit from studying resource usage of the applications. In this scale, small amounts of disk space or memory allocation play an important role. This paper focuses on measuring resource usage of applications via a monitoring tool, and the benchmarking capability of the target application from the resource consumption point of view. Qualitative features like user interface design or application features are not within the scope of this paper. We provide a monitoring tool that tracks resource usages of the device when the target application is running. It generates a trace from the resource usage. This trace can be used to study capabilities of the application or can be used for studying QoS issues. Our monitoring approach does not require any information about the target application. It resides on the same mobile device and monitors resources during the execution of the target application. In order to be flexible and scalable, we designed an approach that has no dependencies to the target application. The remainder of this paper is organized as follows. Next section describes the resource classification; afterward we introduce the related works. Then we discuss controversies and restrictions. Afterward we introduce our benchmarking model and our utility function and resource monitoring methods will be described. Then prototype and evaluates experiments will be described and last section concludes the paper.
RESOURCE CLASSIFICATIONS As a first step, the resources of the mobile devices, which are worth measuring and affect the capability of the application must be identified. Each mobile application consumes CPU, memory, battery and may perform disk and network activities. We defined these as the base resources that will be measured. These resources can influence each other, for example CPU utilization affects battery consumption, but we intend to study them separately regardless of their interdependencies. Currently there is no standard model to prioritize mobile resources. According to [13] battery, which is responsible for the device power, is known as the most important resource for mobile phones. RELATED WORKS According to our knowledge, there is no benchmark suite yet available for mobile platforms for benchmarking applications based on their resource consumption. Most of
2
the available tools benchmark the CPU utilization of an application or scale hardware capabilities of mobile devices. Our intention is to benchmark application resource usage and not the hardware capabilities of the device. The related work, described below, is not necessarily used to benchmark resources, but they have common ideas to track resource usages, about benchmarking models, etc. hence we list them here. JBenchmark is a Java ME (Mobile Edition) based mobile application, which measures processor and clock frequency of Java enabled mobile phones [11]. It provides a test suite, which contains a set of Java ME applications that perform tests like 3D graphics, CPU intensive processes, etc. They are installed on a Java ME capable mobile phone and are meant to benchmark the CPU performance of these phones. Dulan and Tabirca provide a testbed to analyze coding techniques via fractal image generation, which requires significant mathematical processing and consumes enormous amount of CPU time [8]. This research proved that in-lining all calculations is more efficient than using an object oriented approach for mobile devices. We interpret this as another effort to monitor CPU activity. PennBench [7] is another benchmarking suite for Java enabled mobile devices. It benchmarks Java ME application memory usage characteristics based on the memory size constraints and heap footprints. Like JBenchmark, PennBench also uses a test suite which contains a set of Java ME applications. Jeroen Keijzers et al. [12] provide an approach for smart phone usability benchmarking based on the effectiveness, efficiency and satisfaction of using smart phones. The benchmarking is based on the user surveys. Powerscope [9] profiles the energy usage of mobile applications. It tries to map energy consumption to the program structure. Paternò et al. [15] propose an approach for remote usability evaluation on mobile applications based on logging audio channel, battery consumption, position of the user and etc. SysMark 2007 [3] is used to benchmark four types of applications (Elearning, video creation, office productivity and 3D modeling) on personal computers with a predefined set of actions. Then it compares the results of the applications with similar functionalities. In this research performance unit is the response time. SPEC [19] provides standard benchmarking approaches for CPU, Web servers, SIP, power usage and etc. Some of SPEC benchmarking approaches like SIP or transaction benchmarking focus on a specific application type.
CONTROVERSIES AND RESTRICTIONS Monitoring can be used to dynamically manage QoS [6]. We made a resource utilization monitoring prototype to track the resource usage of mobile applications. A quality operator or application evaluator can set weights for prioritizing the importance of the measured resources, and subsequently evaluates application resource utilization via a utility function. A utility function enables them to compare different applications with the same functionality via profiling the resource usages for each application. We provide a utility function, which helps quality operators to find out how different mobile applications with similar functionalities differ in their resource usages. This will be explained in detail in the next section. Evaluating end user quality facts like usability or response time is not in the scope of this research. Only application resource consumption as an important performance metric is measured here. Despite the fact that they are worth to be considered, this will not be supported by our monitoring approach because our tool resides separately from the application and will not have any interaction with the target application. Separation of the
3
monitoring tool from the target application behavior or architecture makes our approach flexible and scalable but it also puts a restriction on measuring end user quality factors of the target application. Most end user quality metrics require quality evaluators to delve deep into the usage or the architecture of the target application. We profile application resource usage via tracking the usage of resources of the target application or for the whole device. It could be argued that overall resource usage of the device should be considered during the target application monitoring, otherwise target application resource consumption is calculated with an overhead, which comes from two sources, one for the general device resource usage overhead, and one for the monitoring application overhead, which introduces a systematic measurement error ∆i for resource i. If the user intends to measure precisely the resource utilization of the target application A without this error, he/she can execute the monitoring tool without starting the target application, then record the consumption of resource i and compute an estimate for ∆i, then execute both monitoring tool and target application and derive the total consumption Ri(A) under the same condition. The true resource consumption Ritrue(A) of the application can then be estimated by
Ritrue(A)
=
Ri(A)
−
∆i
(1)
It is important to know that there is no guarantee that the returned numbers describe precisely the resource utilization in that condition. In each of our experiments, numbers have slightly changed, hence in any calculation a percentage of error must be considered. Running the experiments for a couple of times and taking averages is thus mandatory. A special problem is given by the fact that due to random fluctuations, for a resource that is not used at all by some applications, Ritrue(A) could actually be smaller than zero. We take care of this problem by using max {Ritrue(A),0} instead of Ritrue(A).
BENCHMARKING APPLICATIONS VIA A UTILITY FUNCTION In our work resource consumption is described by metric data and not categorical data. Furthermore, we ignore the relation between performance indicators, for example network activity is not related to the disk activity. To be able to calculate capabilities of applications based on the resource utilization, we need to analyze them together and make sure that both of these data have the same format. In order to fulfill this requirement, our benchmarking approach calculates the sum of the scores for each of the resources. When users intend to compare two applications, the conditions of the experiments should always be the same. The conditions are composed of different components like device state, experiment duration in time, number of inputs issued to the target application etc.
4
Utility Function According to Walsh et al. [22], utility functions allow indicating the degree of desirability of a
service; therefore we chose a utility function to represent the outcome of our benchmark. A utility function maps the resource usage of the application to a numerical degree of satisfaction. This utility function provides a multidimensional mapping from consumption measurements from n resources [18] to one single utility value. In this mapping, the importance of resource i is represented by a weighting factor Wi. We propose to set Wi to 0 in case the resource is not important. When the resource is considered low priority, Wi can be set to 1, and when it has high priority, it can be set to 2. A real example of using the utility function execution will be described in the Section 7 of this paper. Other factors like “execution time of an operation” could also be considered using this utility function, but our monitoring tool does not support them. In the following, 0 ≤ Ui(A) ≤ 1 defines the normalized utility of resource (UR)i under condition c, with systematic error removed due to (1). Then the utility Uc(A) of application A under condition c is defined by (2) The utility function thus results in a value between 0 and 1. The higher the value, the higher is the utility of the application.
Utility of a Resource One problem we face is to make the consumption of different resource types comparable with each other, in order to use them in one formula. Therefore, we seek a 0 ≤ Ui(A) ≤ 1, i.e., the normalized utility of resource i for application A, which should be a function of the respective consumption of resource i. We start by mapping the resource consumptions onto the interval [0,1]. The resources battery and CPU consumptions are represented via percentages. These can be mapped to the interval [0,1] in a natural way. The size of memory is always limited. For example Android emulator SDK 1.1 shows about 94572 KB total memory, without running the target application it uses about 61296 KB of memory. Normalizing the usage of memory is thus done by dividing the memory used by the application by the total amount of memory that could be used by the application, which is about 23296 KB. This value will use as total amount of available memory in our calculation as shown in Table 2. Note that this is the total amount of memory minus the amount of memory used by the operating system, running system tasks, and the monitoring tool. For instance we assume that during the benchmark run, resource i is sampled K times for application A, resulting in the values 0 ≤ Rij(A) ≤ 1, 1≤ j ≤ K, and the respective arithmetic mean i(A). Furthermore let ∆i be an estimate for the systematic error as described in (1), also being mapped to the interval [0,1]. The normalized utility Ui(A) of resource i for the battery is then defined by Ui(A)
=
1
–
max
{
5
i(A)
−
∆i
,0}
(3)
Resource usage of CPU and Memory can be measured disregard to the monitoring tool overhead. It means ∆ is zero for CPU and memory. On the other hand, the number of disk and network activities potentially could be very high and are only limited by the total network and internal bus bandwidth, and the bandwidth and access times of the disk. In practice, most applications will use only a small fraction of the possible maxima. In order to derive a mapping into the interval [0,1] we specify, that the highest utility, i.e., the value 1, should be achieved in case the resource is not used at all. Likewise, the higher the observed numbers are, the smaller the utility should be. For deriving a stable utility of application A and resource i (including disk and network), we thus propose to run the application several times, and observe the measurement values Rij(A) for each run j, with arithmetic mean i(A). Again, let ∆i denote the systematic error, this time in the original value range (not normalized). Then the utility for resource i is defined by Ui(A)
=
(max
{
− α i i(A)
−
∆i
,0}
+
1)
(4)
This definition depends on constants αi reflecting how fast the utility approaches zero for resource i, and is influenced by the possible value range of observations. For instance, it reflects whether the networking activity is reported in bytes, KB, MB etc. This way, the benchmarking results of the applications are normalized, combine scores from different normalized resources, but on the other hand, the utility of one application does not depend on the measurement results of another application. What should be kept fixed, though, when comparing applications with each other, is the device that is used for measuring. One possible problem is given by the fact that (3) is a linear function, while (4) decreases with geometric speed. However, we think that if a resource is used in such a high degree that it is almost fully utilized, the resulting utility should be near zero anyway, which is achieved by both functions. The influence of this highly utilized resource then in (2) disappears, and (2) more or less reflects the utility of the other resources only.
Weights Applications vary from their resource usages based on their functionality. For example a music player does not require a network connection or it has minimal network activity but it consumes a significant amount of battery usage. The reason is that listening to music generally runs significantly longer than for instance checking emails. On the other hand a social-networking application requires heavy network activities but consumes less battery than the music player. These applications are totally different from their resource usage perspective. Assigning priority or weight to the resources can define the level of importance in a numerical value, e.g., in the case of music player, battery gets high priority and network activity gets zero or low priority, while weights must be assigned by the user (quality operator) based on the application functionality, for example in a music player application battery has more weight than the network or in a social-networking client's battery is not important while network bandwidth usage is considered important.
6
Users must classify applications based on their type (music player, social-networking, games, etc.) and assign to a weight.
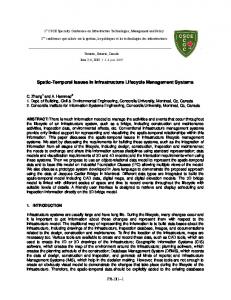
RESOURCE MONITORING METHODS Android1 has been chosen as the implementation platform. It is an open source mobile operating system, which is based on the Linux kernel. We have developed a resourcemonitoring tool, which tracks and logs the resource consumption of a given process. This monitoring tool will run in the background parallel to the target application via using Android services, It uses a GUI to let the user start and stop monitoring processes (shown in Figure 1). A user can also select which resource(s) to track. He can set sampling interval via the Settings button. The sampling interval can be set for the battery, the CPU and the memory. Network and disk activities are sampled only twice, once at the start, while the start button is pressed and another time when the stop button is pressed. Unlike the CPU and the memory, they are not measured per process. Battery usage is mainly the hidden resource and it is difficult to be measured.
Figure 1: Resource monitoring tool
Fortunately in Android it is possible to measure battery by creating a broadcast receiver and call it via an intent, which contains ACTION_BATTERY_CHANGED as the action. Other resources have been measured via reading /proc subfolders. Sampling is done based on the predefined intervals. The sampling interval depends on the resource type, e.g. sampling interval for battery will be done each 10 minutes but CPU utilization could be sampled each second. As it has been explained before, monitoring an
1
www.android.com
7
application itself consumes resources. This indicates that the sampling result is a mixture of monitoring application and the target application. To increase quality of the monitoring result, the user can monitor the target application with same condition more than once and calculate the arithmetic mean of the observations. The monitoring tool runs in the background as a set of services (Android services). Each service is responsible to log one resource. The result of the monitoring is a trace file and below is an example of it: [29
Mar
2009
16:17:30
GMT][GUI]
START
LOGGING
RESOURCES
[29
Mar
2009
16:17:30
GMT][NET][Receive:487,
Send:405]
[29
Mar
2009
16:17:30
GMT][DSK][Read
issued:9,
Write
Completed:1]
[29
Mar
2009
16:17:33
GMT][CPU][PID:217,
CPU:1%,
#Thread:6]
[29
Mar
2009
16:17:33
GMT][MEM][PID:217,VmSize:
115084KB,
VmRSS:22760KB]
[29
Mar
2009
16:17:37
GMT][CPU][PID:217,
CPU:2%,
#Thread:6]
[29
Mar
2009
16:17:37
GMT][MEM][PID:217,VmSize:
115124KB,
VmRSS:22852KB]
...
[29
Mar
2009
16:24:15
GMT][MEM][PID:217,VmSize:
118696KB,
VmRSS:24992KB]
[29
Mar
2009
16:24:18
GMT][Battery][The
phone's
battery
is
charging,
%50]
[29
Mar
2009
16:24:22
GMT][CPU][PID:217,
CPU:25%,
#Thread:9]
...
[29
Mar
2009
16:27:34
GMT][MEM][PID:217,VmSize:
117360KB,
VmRSS:25172KB]
[29
Mar
2009
16:27:36
GMT][NET][Receive:25088,
Send:21161]
[29
Mar
2009
16:27:36
GMT][DSK][Read
issued:10,
Write
Completed:86]
[29
Mar
2009
16:27:36
GMT][GUI]
LOGGING
RESOURCES
HAVE
BEEN
STOPED
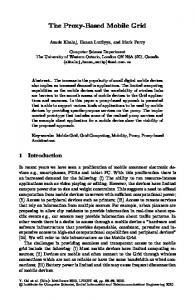
EVALUATION AND VERIFICATION To evaluate this model, we monitored resource utilization in the same condition for two Sudoku games2 via the proposed monitoring tool. Our test environment is an Apple Mac Book Pro with 2.4 GHz CPU which contains Android emulator SDK 1.1. We repeated the test four times. At the end we chose the largest dataset for the analysis. The arithmetic means of the measurements in each observation do not show significant differences. We pruned the dataset to remove near zero CPU and memory usages from before and after Monkey user simulation start. Monkey [14] is a user simulator feature of the Android platform, that generates pseudo-random streams of the user events like click, tap the screen, etc. To evaluate if we have enough samples, we found and removed outliers. Afterward we test the normality of data with Quantile-Quantile plot [5] from each dataset as shown in Figure 2. Shapiro-Wilk test [20] used to test the normality of data. These datasets passed the Shapiro-Wilk test for CPU and not for memory. The statistical error level for both the CPU and the memory of both applications had been calculated for 95% confidence interval and they were acceptable. As stop criteria we used an estimate for the standard error of the mean. The result shows that the magnitude of standard errors is much smaller than the mean. The arithmetic mean for CPU and total memory allocated for application (vmsize) has been used to calculate the utility function (Table 1).
2
We
downloaded
two
freeware
Sudoku
games
from
the
internet
8
Figure 2: Quatile-Quantile Plots for CPUs and VmSizes.
Recourse CPU Memory Disk Network Battery
Weight 2 1 0 0 0
Values for application A 62%
Values for application B 37%
vmSize=11919, vmRSS=25001
vmSize=10563, vmRSS=17657
-
-
Table 1: Values for utility of resource
The monitoring tool created an application trace from the CPU and memory usage. Both applications had been tested via the Monkey. We named these Sudoku games “Application A” and “Application B”. As it has been noted before, testing application in
9
the same condition (same test duration, same device state, etc.) is very important. In order to adhere to the same condition for each test, we used the new android emulator instance with an empty 1 Gigabyte SDCARD for each experiment and the same experiment duration. First the Monkey simulator had been started. The result will be used by the utility function to evaluate these two applications and compare them. Figure 3 shows the CPU usage for approximately the same number of samples (about 80) collected from the CPU traces of these applications. In this experiment CPU sampling has been done based on three seconds intervals. There are some zero or near zero CPU usages, at the beginning and at the end of the monitoring dataset. This is because the Monkey user simulator had been called after the monitoring process has been started and after the Monkey application has been stopped the monitoring application is still running.
Figure 3: CPU utilization trace.
To measure memory utilization, the monitoring tool logs “total memory size allocated for the target application” (vmsize) and the “resident set size” (vmrss) in a three second interval for each application. vmrss and vmsize for each application have shown in Figure 4. We use only vmsize for the utility function. Table 1 shows Utility of Resources, weights and their associated values. Table 2 shows the result of the calculation and the
10
utility function result for each application. Result of the utility function calculation like the result is shown in Figure 3 and Figure 4.
Figure 4: Average memory usage Application A Weight Utility of Resource
2 (CPU) 62% 1–(62÷100)
1(Memory) vmSize=11919 1-(11919÷23296)
Application B 2 (CPU) 37% 1–(37÷100)
1(Memory) vmSize=10563 1-(105631÷23296)
Utility Function 0.4161 0.6022 Result Table 2: Utility function (23296 is the available amount of memory for applications, as described before)
Results indicate that Application B consumes less CPU and memory than Application A. Application state could also affect utility function's error. In the Android platform components of the application have different states which these states represent application's life cycle [2]. For example if an application is visible to the user and it has focus (start state), then more CPU can be consumed, or when another Android activity is resumed (pause state), then less CPU is assigned. The same approach could be also done for the battery, the memory, the disk and the network. For example, if the application is
11
visible to the user, then battery consumption will increase, if the application is suspended and another application get the GUI focus (pause), then battery consumption will decrease.
CONCLUSION We identified and classified mobile resources, which has been used by the mobile application, and are worth monitoring. A software monitoring approach to measure these resources and profile application's resource utilization has been proposed. It is a light software monitoring approach, which consumes few resources. It supports flexibility and modularity by separating resource monitoring from the target application. Implementation of a monitoring tool had been done on the Android platform. We have chosen Android because it provides access to the lower layers of operating systems such as battery usage in easy way. To benchmark applications from their resource usage perspective, a utility function has been proposed. Its activity is based on the weight of the resource and the average resource usage consumption. Resources data are heterogeneous data and in order to be able to use them together, they have to be converted into a numerical data. This process will be done by utility of resource and weight. Weight represents the level of the importance of each resource and will be set by the application evaluator based on the application type. The utility of resource is a normalized arithmetic mean of resource usage during the simulation. In the last part we analyzed and compared two Sudoku application based on their CPU and memory consumption and via the proposed utility function. Result shows that Application A uses more resources than Application B.
REFERENCES [1] Mourad Alia, Viktor S. Wold Eide, Nearchos Paspallis, Frank Eliassen, Svein O. Hallsteinsen, and George A. Papadopoulos. A Utility-Based Adaptivity Model for Mobile Applications. International Conference on Advanced Information Networking and Applications Workshops, 2:556−563, 2007. [2] Component Lifecycles, Application Fundamentals, Android Developer Guide. http://dev.android.com/guide/topics/fundamentals.html.
(last
visited
June
15,
2009). [3] Sysmark2007 preview. http://www.bapco.com/techdocs/SYSmark2007Preview WhitePaper.pdf. (last
visited
June
1,
2009). [4] Kneko Burney. New Year's Bustle? Vertical Market Expectations for 2009 ICT Spending in the US-From Crisis to Slow, Long-term Recovery. Compass Intelligence, January 2009. [5] Sarah Boslaugh and Paul Watters. Statistics in a Nutshell: A Desktop Quick Reference, pages 118−119. O'Reilly Media, Inc., 2008.
12
[6] Daniel Chalmers and Morris Sloman. A Survey of Quality of Service in Mobile Computing Environments. IEEE Communications Surveys, 2(2), March 1999. [7] G. Chen, N. Vijaykrishnan, and M. J. Irwin. PennBench: A benchmark suite for embedded Java. In The IEEE 5th Annual Workshop on Workload Characterization, 2005. [8] Daniel C. Doolan and Sabin Tabirca. The Need for Speed: coding styles for Mobile Devices. In ELMAR, pages 193−196, 2007. [9] Jason Flinn and M. Satyanarayanan. Powerscope: A Tool for Profiling the Energy Usage of Mobile Applications. In WMCSA '99: Proceedings of the Second IEEE Workshop on Mobile Computer Systems and Applications, page 2. IEEE Computer Society, 1999. [10] R.K. Jain. The Art of Computer Systems Performance Analysis: Techniques for Experimental Design, Measurement, Simulation, and Modeling, page 36. John Wiley & Sons, 1991. [11] Jbenchmark, New Estimator Software Measures true mobile phone performance. http://www.jbenchmark.com/jbacepr.jsp. (last
visited
May
10,
2009). [12] Jeroen Keijzers, Elke den Ouden, and Yuan Lu. Usability benchmark study of commercially available smart phones: cell phone type platform, PDA type platform and PC type platform. In MobileHCI '08: Proceedings of the 10th international conference on Human computer interaction with mobile devices and services, pages 265−272, 2008. [13] Robin Kravets and P. Krishnan. Power Management Techniques for Mobile Communication. In Mobi-Com '98: Proceedings of the 4th annual ACM/IEEE international conference on Mobile computing and networking, pages 157−168, 1998. [14] UI/Application Exerciser Monkey, Android Developer Guide. http://dev.android.com/guide/developing/tools/monkey.html. (last
visited
June
18,
2009). [15] Fabio Paternò, Andrea Russino, and Carmen Santoro. Remote Evaluation of Mobile Applications. Task Models and Diagrams for User Interface Design, pages 155−169, 2007. [16] M. Satyanarayanan. Fundamental challenges in mobile computing. In PODC '96: Proceedings of the fifteenth annual ACM symposium on principles of distributed computing, pages 1−7, 1996. [17] M. Satyanarayanan. Pervasive computing: Vision and challenges. Personal Communications, IEEE, 8(4):10−17, 2001.
13
[18] J. E. Smith. Characterizing computer performance with a single number. Commun. ACM, 31(10):1202−1206, 1988. [19] SPEC Benchmarks (Standard Performance Evaluation Corporation). http://spec.org/benchmarks.html. (last
visited
May
23,
2009). [20] S.S. Shapiro, M.B. Wilk, and H.J. Chen. A Comparative Study of Various Tests for Normality. American Statistical Association, 63(324):134−137, 1968. [21] Debora Viana Thompson, Rebecca W. Hamilton, and Roland T. Rust. Feature Fatigue: When Product Capabilities Become Too Much of a Good Thing. Journal of Marketing Research, 42:431−442, 2005. [22] William E. Walsh, Gerald Tesauro, Je_rey O. Kephart, and Rajarshi Das. Utility Functions in Autonomic Systems. In International Conference on Autonomic Computing, 2004., pages 70−77, May 2004. [23] Wanghong Yuan and Klara Nahrstedt. Energy-E_cient Soft Real-Time CPU Scheduling for Mobile Multimedia Systems. In SOSP '03: Proceedings of the nineteenth ACM symposium on Operating systems principles, pages 149−163, 2003.
14