Mobile User Localization in Wireless Sensor Network Using Grey Prediction Method. Ren C. Luo Fellow, IEEE, Ogst Chen, Shi H. Pan. Department of Electrical ...
Mobile User Localization in Wireless Sensor Network Using Grey Prediction Method Ren C. Luo Fellow, IEEE, Ogst Chen, Shi H. Pan Department of Electrical Engineering Nation Chung Cheng University Chia Yi 621 Taiwan {luo, jchen, shpan}@ia.ee.ccu.edu.tw Abstract – Knowing the position of mobile user is an important role for location services in the building. The characteristics of wireless sensor network are low power, low cost and low complexity. With these functions, wireless sensor network have great potential to develop indoor position system. However, radio signal propagation is easily affected by diffraction, reflections, and scattering of radio in the building, the received signal strength need good calibration method to improve the accuracy of position estimation system. In this paper we use grey prediction method in wireless sensor network and employ wireless LAN medium (Zigbee/802.15.4). The grey prediction is used to predict the tendency of RSSI (received signal strength indicator), and we also designed Dynamic triangular (DTN) location method. We have done some experiments and compare with other classical location finding methods. The mean distant error of RSSI on mobile user can be within 2.3m at off line stage. As a result, grey predication with DTN provides more accurate predicted position and carries out mean distance error within 1.3 m at run-time stage.
I. INTRODUCTION Estimating mobile user’s location is one of key applications in wireless sensor network, the outdoor location detection uses GPS (Global Positioning System) and generally is exploited in car navigation, but in the building the GPS signal is not available. We want to develop a mobile user location estimation system in the building, and use this system to track mobile user and assist user navigation. Wireless sensor network has evolved over last several years, and can easily deploy a number of sensor nodes in the building. Wireless sensor network corresponds to the features of low power, low cost, low complexity and small size and provides mobility and flexibility of nodes. It has many advantages to replace the traditional sensor and control nodes in the building. This paper discusses grey perdition based location estimation algorithm for wireless sensor network. The proposed method determines the position of mobile user inside a building form measured RSSI on IEEE 802.15.4 wireless devices. Especially, we propose Dynamic Triangular (DTN) location method. There are two stages in our experiments, one is offline stage and the other is run-time stage. At offline stage DTN location method was compared with others classical location methods. We employ ‘mean distance error’ metric to evaluate accuracy of classical location methods and DTN. DTN achieved mean distance error within 2.3 m. We use grey prediction to predict the tendency of RSSI at rum-time stage and present analysis of predicted RSSI when mobile user is moving. Grey perdition is able to reduce the fluctuation of RSSI when mobile is moving.
0-7803-9252-3/05/$20.00 ©2005 IEEE
Location algorithms with grey prediction achieve smaller mean distance at run-time stage than off-line stage. The remainders of this paper are organized as follows. In the section II we discuss related work and introduce classic location algorithms. An overview of system framework and DTN location algorithm are given in Section III. A detailed description of grey Prediction based tracking method is presented in Section IV. The conclusion of the experimental results is presented in the Section V. II. RELATED WORK Many researches have focused on location estimation algorithms in the building. In this paper we only discuss the indoor location system that exploits the RSSI to estimate location. The early research was RARAR [2] system from Microsoft in Wireless LAN-based location estimation, the RARAR system record relationship between signal strength and location from each base station and establish the database at off-line stage, At run-time stage the base stations receive beacons that are dispatched from mobile user and search the best match signal strengths from k-nearest neighbours (KNN), and the infer the mobile user’s location. RARAR use two methods to find the estimation location, one is use the empirical method and the other is signal propagation method. The approach of triangulation (TN) is most generally used in location system such as GPS. TN uses the signal region circles that generate form different base stations, intersect of circles product the estimation location of mobile user. Those methods are described in [6] [7]. Pandya D. et al. [6] utilize two different kind of wireless devices (IEEE 802.11 and Bluetooth) that provide overlapping coverage, and fuse the signal strength data from multiple devices. They employ Smallest Polygon (SMP) algorithm to find location of mobile user. Each base station estimates candidate location set, SMP finds the smallest distinct-vertex polygon form the candidate location set. The location of mobile user is the centroid of the smallest polygon. Ogawa T. et al. [5] use the measured signal strength form several base stations at different locations to train the Learning Vector Quantization (LVQ) that is a at off-line stage, LVQ that is a kind of neural network. This method divides a room into several names of locations, and use trained LVQ to determine name of the location where user locate. Gwon Y et al. [1] presented Triangular Interpolation and extrapolation (TIX) algorithm. TIX algorithm needs three APs at least. TIX chooses the three base stations which measure highest three mobile user’s RSSIs. Those base stations form a triangle and find the ratio of triangular sides which using
2680
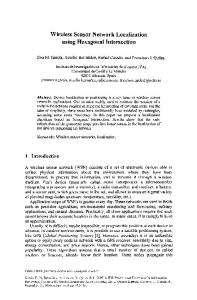
measured RSSIs. TIX uses the sides of triangular to estimate the final location of mobile user. III. SYSTEM FRAMEWORK Figure 1 is our experiment testbed. In our scenario, mobile user moves in a building, and the location system can be used to estimate the locomotion of mobile user. We place four CC2420BK Demonstration Board Kits labelled S1, S2, S3 and, S4 in our laboratory. The mobile user and sensor nodes equipped with a 2.4 GHz wireless interface (Zigbee). The mobile user moving around in blue color zone in our laboratory and sensor nodes establish the coordinate system. Figure 2 depicts system architecture. Each sensor node receives RSSIs which were generated by mobile user and use grey prediction to compute predicted RSSIs. Use them to estimate the location of mobile user form the coordinate system. Coordinate system denotes different location algorithm such as KNN, SMP, TN, and DTN and estimates mobile user’s location. DTN location method describes in great detail later.
sensor nodes and mobile user, and put the estimation distance into different location algorithms (SMP, TN and DTN) to get the coordination of mobile user. The ML (Maximum likelihood) method [3] is often used to find the radio propagation model at off-line stage. Radio signal propagation is easy influenced by diffraction, reflections, and scattering of radio induced obstacles in a building. The Radio signal strength measurement is contaminated by the measuring error and the NLOS (Non-Line-of-Sight) error [4] The measuring error result from the measuring processes in a noisy channel and can be improved with better SNR (signal-to-Noise Ratio). NLOS errors depend on the multipath-dominated environments and change from time to time. We record the RSSIs and distances between the sensor nodes and mobile user, and use ML method to find a propagation model for fading channel. This model provides the mean RSSI (d) that received form the mobile user, and equation (1) state that. The RSSI(d0) is the received signal strength in dB at a reference distance, and n is denoted the path loss exponent. The measured RSSI is calculated by ML and find the parameter RSSI(d0) and n. The Measured RSSI fit ∧
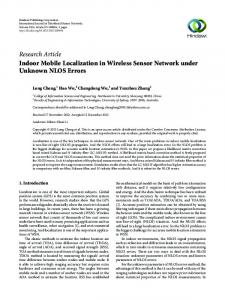
Channel Model is obtained the by using the equation (1). d is estimation the distance from equation (2), and Xσ the is random variable that denoted the estimation error with variance σ2 from equation (3). We find that random variable Xσ increase with distance between the sensor node and mobile user in Figure 3. Due to this reason, the proposed DTN chooses strongest RSSI from three sensor nodes at least and estimate location of mobile user. The strongest RSSI is able to estimate distance with small distance error, so DTN improve the accuracy of location estimation. RSSI ( d ) = RSSI ( d 0 ) − 10 n log( d ∧
d = d 010
d
(1)
) 0
RSSI( d0 )− RSSI( d ) 10n
(2)
∧
d = d + Xσ
Fig.1. Map of experimental testbad
(3)
4 3.5
Mean Distance Error (m)
3 2.5 2 1.5 1 0.5 0
0-1
1-2
2-3
3-4
4-5 5-6 6-7 Distance (m)
7-8
8-9
9-10
Fig.3. Estimation distance Error in location estimation
Fig.2. The framework of location estimation system
B. Local Coordination System
A. Radio Propagation Model We try to estimate mobile user’s location in our laboratory. First we must obtain the estimation distance between the
In this section we introduce our local coordination system, this system keep the scalability as the number of nodes increases, and estimate user location in high density of sensor
2681
network. We assume each sensor nodes know its location, and the local coordination system establish the small set of total sensor nodes in a room, This set of total have compose of three senor nodes at least. In the following discussion, we talk about the formation for location estimation and its communication protocol. Mobile user moves in an office sends the beacons to its adjacent sensor nodes periodically. sensor nodes broadcast RSSIs that receive from mobile user, and the sensor node which receives the strongest RSSI become the master node, and then it will broadcasts a message to establish itself as a master, the message include the mobile node ID, Master node ID, and time slot. The time slot is able to make local coordinate system synchronization. The other nodes which receive the message call the slave node. Slave nodes forward the RSSI of mobile user to the Master node, the message include mobile node ID, Master node ID, RSSI of Mobile node, and time slot. The master node receives the message and then estimates the location of mobile node. At last the master node sends the coordinate of mobile user to location server and mobile user. The location message is composed of Mobile node ID, and coordinates. The mobile user and location sever can know its location form this coordinate system. The sensor nodes are equipped with different location algorithms, such as TN, KNN, DTN, and SMP.
2) The distance of mobile user estuation: DTN Find the error between estimation distances (d2 and d3) and possible distances (d2θ and d3θ). 3) The coordinate of mobile approximation: DTN calculates the cost functions at each angle θ and the θ increase 1 degree each time. DTN search the minimum cost function, and the θ of minimum cost function is estimation angle on the mapping circle. The Angle θ on mapping circle is the ∧ estimation location D of mobile user. Figure 5 describes the Procedure of DTN location algorithm. At last we shift the ∧ local coordinate D and find the global coordinate of mobile user (x1+d1cosθ, y1+d1sinθ).
iMac
Fig.5. Procedure of DTN location algorithm Fig.4. The location estimation system
C. Dynamic Triangular Algorithm DTN algorithm requires at least three sensor nodes to estimate location of mobile user. We use four sensor nodes in our experiment. DTN discards the worst RSSI which measure by the sensor nodes and uses the other sensor nodes to estimate location. DTN chooses the sensor node which receives greatest RSSI to take as master node, and assumes the mobile user’s location in mapping circle of master node. The mapping circle is the estimation distance d1 between mobile user and master node. DTN finds the angle θ on mapping circle by using a cost function to pick one that best matches the observed distance. DTN comprise the following step: 1) Generation of mapping circle: DTN finds possible locations of mobile user (x1+d1cosθ, y1+ d1sinθ) on the mapping circle by using the possible distances (d2θ and d3θ) between mobile user and Slave nodes.
Fig.6. DTN location algorithm
We compare our location method with the other algorithms (KNN, SMP and TN), and employ ‘Mean distance error’ metric to analyze performance of different location algorithms at off-line stage. Mean distance error is computed by equation (4), N denotes the number of estimation locations,
2682
∧
∧ (1 )
∧
( x , y ) means the estimation coordinate, and (x, y) indicates the true location of grid in our laboratory. MSE
1 N
=
N
∧
∑
∧
i =1
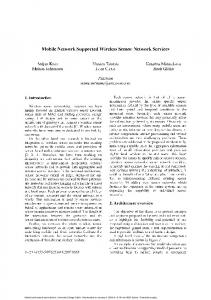
Figure 7 depicts mean distance error of different location algorithms using four sensor nodes at off-line stage. KNN performs better than TN, SMP, DTN, because our sensor nodes deploy high density (13.68 m2/n) and KNN only search for 417 location in total area of 54.7 m2 space, mean distance error of DTN is 2.3 m, and DTN is comparable to other classic location algorithms. We describe that Grey Prediction integrate with other different location methods in the section IV.
b ⎞ − ak b ⎛ + 1 ) = ⎜ x ( 0 ) (1 ) − + ⎟e a ⎠ a ⎝
(7)
minimizing the least square error term using the matrix (9), the optimal solution can be obtained by using following equation (8). ∧ ⎡a ⎤ a = ⎢ ⎥ = B ⎣b ⎦
(
T
B
)
−1
B
T
(8)
yn
( ( (
) ) )
1 ⎡ (1 ) (1 ) ⎢ − 2 x (1 ) + x ( 2 ) ⎢ 1 ⎢ − x (1 ) ( 2 ) + x (1 ) ( 3 ) 2 ⎢ B = ⎢ 1 − x ( 1 ) (3 ) + x ( 1 ) ( 4 ) ⎢ 2 ⎢ .... ⎢ 1 (1 ) ⎢− x (n − 1 ) + x ( 1 ) ( n ) ⎣ 2
5 4.5 4 Mean Distance Errpr (m)
(k
For the case of k ≥ 2 we can employ ordinary minimum ∧ least square estimation with a linear model y n = B a . By
(4)
(xi − x)2 + ( yi − y)2
x
3.5
(
3
)
⎤ 1⎥ ⎥ 1⎥ ⎥ 1⎥ ⎥ ⎥ ⎥ 1⎥ ⎦
(9)
2.5
[
2
y n = x ( 0 ) ( 2 ), x ( 0 ) ( 3 ), x ( 0 ) ( 4 ),....., x ( 0 ) ( x )
1.5
]
T
(10)
1
∧
0.5 0
TN
KNN
SMP
Finally, the prediction result x of the moving object at t = k + 1 can be obtained by equation (11). Figure 8 depicts the all procedure of grey Prediction
DTN
Algorithm
Fig.7. Mean distance error of KNN, TN, SMP, and DTN
∧ (0)
x
IV.GREY PREDICTION ALGORTHEM
∧ (1 )
( k + 1) = x
∧ (1 )
( k + 1) − x
(k )
A. Grey Prediction Model GM(1,1) We use the RSSI predictive based to improve accuracy of mobile user’s location. For tracking mobile user, the proposed grey prediction approach [8] utilizes the grey system to predict RSSI. We model the dynamic RSSI of X(1) using first-order ordinary different equations as follows:
dX (1) + aX dt
(1 )
=b
(5)
X(1) is the accumulated generating operation that can be obtained by X (1 ) = (x (1 ) (1), x (1 ) ( 2 ), x (1 ) ( 3 ),......., x (1 ) ( n ) ) where k (6) x (1 ) ( k ) = x ( 0 ) ( m ), k ∈ {1 ,....., n }
∑
m =1
(
)
X ( 0 ) = x ( 0 ) (1), x ( 0 ) ( 2), x ( 0 ) (3),......, x ( 0 ) ( n ) is the original data
sequence, where the X (0) (k) represents RSSI at time t equation (5) is called “white descriptor” for modelling a white system that we can find its parameters (a, b) directly from the observed RSSI. By solving the differential equation (6), we can obtain the prediction equation (7).
Fig.8. Procedure of Grey prediction system
B. Grey Prediction Experiment
2683
(11)
RSSI
= w 1 × RSSI
pred 2
MSE 1 =
MSE 2 =
n
1 n
∑
1 n
∑
+ w 2 × RSSI
( RSSI
i pred 1
− RSSI
i
)2
(13)
( RSSI
i pred 2
− RSSI
i
)2
(14)
i =1 n
(12)
i −1
i pred
i =1
We can see a example of prediction results from figure 9 and figure 10, we measure the RSSI samples when mobile user go far away from a sensor node (0m to 6m), and predict the tendency of RSSI by using grey prediction algorithm. The Figure 10 depicts grey prediction with original RSSI, and the predicted result which compared with original RSSI is not fluctuant violently. Figure 11 describes the grey prediction with weight RSSI, and the predicted RSSI close to original RSSI. -50 Original RSSI Predicted RSSI
-55 -60
dB
-65 -70 -75 -80 -85 -90 0.5
1
1.5
2
2.5
3 3.5 Distance (m)
4
4.5
5
Fig.9. A example of grey prediction
5.5
6
-50 Original RSSI Predicted RSSI
-55 -60 -65 dB
The mean square error (MSE) is used to determine the performance of grey prediction system, and at the Run-time stage we put the measured RSSIs which generated from mobile user to the grey prediction system, and then get the predicted RSSI. We compare two methods of grey prediction, one is original grey prediction output, the other is grey prediction with weight method, from equation (12) weight method is used to obtain RSSIpred2, w1 and w2 denote the weighting of original RSSI and predicted RSSI. The MSE1 and MSE2 are used to evaluate the accuracy of RSSIpred1 and RSSIpred2 from the Equation (13) and (14), n is the number of inputs. We measured four different independent sets of RSSIs when mobile user moved away from the same sensor node, and each set of RSSI was measured at different time a day, because signal strength fluctuates from time to time. The number of original RSSI and predicted RSSI are the same 300 and the mobile user move the same distance (6m). The RSSIpred1 is determined by using the grey prediction process that show in the Figure 9. grey Prediction computes 20 RSSI samples. After many experiments, we let w1 = 0.5 and w2 = 0.5 in Equation (12) and MSE have best performance. The average of MSE1 and MSE2 are 4.981 and 2.49 from the experiment result, obviously MSE2 is greater then MSE1.
-70 -75 -80 -85 -90 0.5
1
1.5
2
2.5
3 3.5 Distance (m)
4
4.5
5
5.5
6
Figure.10. A example of grey prediction with weight method
C. Grey Prediction with Location Methods In this section, we discuss several location algorithms (KNN, SNP, DTN and TN) which integrate with grey prediction, and present an analysis that these algorithms perform. Figure 11 depicts experiment testbed and we also place four the sensor nodes in our laboratory. The mobile user moves with direction of arrow line and broadcast the beacon every 50ms. The velocity of mobile user is 0.15m/s.Sensor nodes revive the beacons and put the RSSIs to grey perdition algorithm. We consider a couple of alternation grey perdition approaches. First is the only grey prediction method, second approach is grey prediction with weight method. The predicated RSSIs are put several location algorithm to estimate the location of mobile user. The true location and Estimation location of mobile user was recorded when mobile user is moving. Mean distance error is used to evaluate the accuracy of the location of mobile user. Grey prediction can reduce the NLOS error and predict the tendency of RSSI when mobile user is moving. Predicted result with location algorithm is used to predict mobile user’s location and origination. We change the number of grey perdition inputs and analyze this change which affect the accuracy of mobile user’s position. The figure 12 depicts mean distance errors of several location algorithms which cooperate with grey prediction. KNN and SMP have greater mean distance errors than DTN and TN when the number of grey perdition inputs smaller than 100. The mean distance error of DTN is smaller than the other location algorithms when the number greater than 100. The best mean distance error was 1.3 m, achieved by DTN. The figure 13 also depicts mean distance of the same algorithm with weight method. The 5% -43% mean distance errors of DTN performs better than the other location methods. We summarize this two different experiment conditions. grey prediction with weight method has 5-15 % greater mean distances error than only grey prediction method, the mean distance error of TN that cooperates with grey prediction increases, when the number of grey prediction inputs increase.
2684
V. Conclusions We presented a DTN location algorithm that using wireless sensor network and employ grey prediction to improve the accuracy of different location algorithms (KNN, SMP, TN, DTN). Our experiments verified that grey prediction can predict the tendency of RSSI and reduce the fluctuation of RSSI when mobile user is moving. DTN cooperates with grey prediction achieved smallest mean distance error of 1.3m. Localization algorithms integrate with grey prediction at rum-time also has smaller mean distance error than location methods without grey prediction. VI. Reference
Fig.11. The Grey prediction experiment testbed 4.5 DTN+GP KNN+GP SMP+GP TN+GP
Mean Distance Error (m)
4
3.5
3
2.5
2
1.5
1
0
50 100 The Number of Grey Prediciton Input (N)
150
Fig.12. The Grey prediction experiment result 4.5 DTN+GP+W KNN+GP+W SMP+GP+W TN+GP+W
Meab Distance Error (m)
4
3.5
3
2.5
2
1.5
0
50 100 The Number of Grey Prediction Input (N)
150
Fig.13. The Grey prediction experiment result with weight method
[1] Y. Gwon, and R. Jain, “Error Characteristics and Calibration–free Techniques for Wireless LAN-based Location Estimation,” In Proceedings of MobiWac, section 1 pp, 2-9, Oct. 1, 2004 [2] P. Bahl, V. N. Padmannabhan, “RADAR: A In-Building RF-Based User Location and Tracking System,” In Proceedings of the IEEE Conference on Computer Communications (INFOCOM ‘00), vol.2, pp. 775 – 784, March 2000 [3] Patwari, N.; Hero, A.O., III; Perkins, M.; Correal, N.S.; O'Dea, R.J., “Relative location estimation in wireless sensor networks,” IEEE Trans. Signal Processing, vol. 51 , pp. 2137 - 2148, Aug. 2003 [4] P.-C. Chen, “A non-line-of-sight error mitigation algorithm in location estimation,” In Proceedings of IEEE Conference WCNC (Wireless Communications and Networking, vol.1, pp. 316 – 320, Sept. 1999 [5] T. Ogawa, S. Yoshino, M. Shimizu, H. Suda,” A new in-door location detection method adopting learning algorithms,” In Proceedings of IEEE Conference Pervasive Computing and Communications(PerCom 2003), pp. 525 – 530, March 2003 [6] D. Pandya, R. Jain, and E. K Lupu, “Indoor Location Using Multiple Wireless Technologies,” In Proceedings of the IEEE Personal, Indoor and Mobile Radio Communications, vol.3, pp. 2208 – 2212, Sep. 2003. [7] Y. Gwon; R. Jain, T Kawahara, “Robust indoor location estimation of stationary and mobile users” In Proceedings of the IEEE Computer and Communications Societies (INFOCOM), vol. 2, pp. 1032 – 1043, March 2004 [8] C. H. Lee, and C. J. Yu, “An intelligent handoff algorithm for wireless communication systems using grey prediction and fuzzy decision system,” In proceedings of IEEE Networking, Sensing and Control Conference, vol. 1, pp. 541 – 546, March 2004.
2685