measurement of the bridge, identification of the structure's modal signature and finite element ... respectively, the longitudinal axis along the bridge, the.
Emirates Journal for Engineering Research, 9 (2), 29-34 (2004) (Regular Paper)
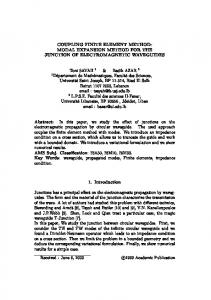
MODAL IDENTIFICATION AND FINITE ELEMENT MODEL UPDATING OF A REINFORCED CONCRETE BRIDGE S. EL-BORGI, H. SMAOUI, F. CHERIF, S. BAHLOUS and A. GHRAIRI Applied Mechanics Research Laboratory, Tunisia Polytechnic School Rue El-Khawarizmi, B.P. 743, La Marsa 2078, Tunisia
ﻭﺘﺴﺘﻨﺩ ﻫﺫﻩ ﺍﻟﻁﺭﻴﻘﺔ ﻋﻠﻰ.ﻴﻭﺠﺯ ﻫﺫﺍ ﺍﻟﺒﺤﺙ ﺘﻁﺒﻴﻕ ﻁﺭﻴﻘﺔ ﻤﻨﻬﺠﻴﺔ ﻟﺘﻘﻴﻴﻡ ﺍﻟﺠﺴﻭﺭ ﺍﻟﺨﺭﺴﺎﻨﻴﺔ ﺍﻟﻘﺩﻴﻤﺔ ﻓﻲ ﺘﻭﻨﺱ ﺜﻡ،ﻗﻴﺎﺱ ﺍﻫﺘﺯﺍﺯﺍﺕ ﺍﻟﺠﺴﺭﺘﺤﺕ ﺍﻟﻅﺭﻭﻑ ﺍﻟﻁﺒﻴﻌﻴﺔ ﺍﻟﻤﺤﻴﻁﺔ ﺒﻪ ﻭﺘﺤﺩﻴﺩ ﺨﺎﺼﻴﺔ ﺩﻴﻨﺎﻤﻴﻜﻴﺔ ﻟﻪ ﻤﻥ ﺘﻠﻙ ﺍﻟﻘﻴﺎﺴﺎﺕ ﺀ ﻋﻠﻰ ﻨﺘﺎﺌﺞ ﻗﻴﺎﺱ ﺍﺴﺘﺨﺩﺍﻡ ﻁﺭﻴﻘﺔ ﺍﻟﻌﻨﺎﺼﺭ ﺍﻟﻤﺤﺩﻭﺩﺓ ﻟﺘﺤﺩﻴﺙ ﺍﻟﻨﻤﻭﺫﺝ ﺍﻟﺘﺤﻠﻴﻠﻰ ﻟﻠﺠﺴﺭ ﺒﺼﻭﺭﺓ ﻤﺴﺘﻤﺭﺓ ﺒﻨﺎ ﻭﻗﺩ ﺘﻡ ﺍﺨﺘﻴﺎﺭ ﺠﺴﺭ ﻨﻬﺭ ﺴﻴﺩﻱ ﺒﻭﻋﻠﻲ ﻓﻲ ﻫﺫﻩ ﺍﻟﺩﺭﺍﺴﺔ ﻭﺍﻟﺫﻱ ﻴﺘﺄﻟﻑ ﻤﻥ ﺜﻤﺎﻨﻲ ﺒﺤﻭﺭ ﺫﺍﺕ ﺍﺭﺘﻜﺎﺯ.ﺍﻻﻫﺘﺯﺍﺯﺍﺕ ﻤﺘﺭﹰﺍ ﺘﺭﺘﻜﺯ ﻋﻠﻰ ﺭﻜﺎﺌﺯ ﻤﻁﺎﻁﻴﺔ ﻋﻨﺩ ﻤﻨﺎﻁﻕ25 ﻭﻴﺒﻠﻎ ﻁﻭل ﺒﺤﺭ ﺍﻟﻜﻤﺭﺓ ﺍﻟﻭﺍﺤﺩﺓ.ﺒﺴﻴﻁ ﻭﺒﻼﻁﺔ ﻤﺴﺘﻤﺭﺓ "accelerometers" ﻭﻗﺩ ﺘﻡ ﻗﻴﺎﺱ ﺍﻻﻫﺘﺯﺍﺯﺍﺕ ﺒﺎﺴﺘﺨﺩﺍﻡ ﺠﻬﺎﺯ ﺨﺎﺹ ﻟﺭﺼﺩ ﻭﺘﺤﻠﻴل ﺍﻟﺒﻴﺎﻨﺎﺕ ﻤﺘﺼل ﺒـ.ﺍﻟﺘﺤﻤﻴل ﻭﻗﺩ ﺘﻡ ﺘﻁﺒﻴﻕ ﺍﻟﻁﺭﻴﻘﺔ ﺍﻟﻤﺤﺴﻨﺔ ﻟﻠﺘﺤﻠﻴل ﻓﻰ ﺍﻟﻤﺠﺎل ﺍﻟﺘﺭﺩﺩﻯ ﻭﺍﻟﺘﻲ.ﻤﺜﺒﺘﺔ ﻓﻲ ﺘﺴﻌﺔ ﺃﻤﺎﻜﻥ ﻤﺨﺘﺎﺭﺓ ﻤﻥ ﺍﻟﺠﺴﺭ ﺘﻌﺭﻑ ﺒﻜﻔﺎﺀﺘﻬﺎ ﺒﺎﻟﻨﺴﺒﺔ ﻟﻠﻁﺒﻴﻌﺔ ﺍﻟﻤﺭﻜﺒﺔ ﻭﺍﻟﻤﺘﻐﻴﺭﺓ ﻟﻠﺘﺄﺜﻴﺭﺍﺕ ﻏﻴﺭ ﺍﻟﻤﻘﺎﺴﺔ ﺒﻬﺩﻑ ﺍﻟﺤﺼﻭل ﻋﻠﻰ ﺍﻟﺨﺼﺎﺌﺹ ﻭﻟﺘﺤﺩﻴﺙ ﺍﻟﻨﻤﻭﺫﺝ ﻓﻘﺩ ﺘﻡ ﺍﻓﺘﺭﺍﺽ ﺃﻨﻪ ﻴﻤﻜﻥ ﺘﻐﻴﺭ ﻤﻌﺎﻤل ﻤﺭﻭﻨﺔ ﺍﻟﺨﺭﺴﺎﻨﺔ ﻭﻜﺫﻟﻙ ﺠﺴﺎﺀﺓ.ﺍﻟﺩﻴﻨﺎﻤﻴﻜﻴﺔ ﻟﻠﺠﺴﺭ ﻭﻴﻤﺜل ﺍﻟﺘﻐﻴﺭ ﻓﻲ ﻤﻌﺎﻤل ﻤﺭﻭﻨﺔ ﺍﻟﺨﺭﺴﺎﻨﺔ ﺃﻱ ﺘﺼﺩﻉ ﻤﺤﺘﻤل ﻓﻲ ﺍﻟﺠﺴﺭ ﺃﻤﺎ ﺍﻟﺘﻐﻴﺭ ﻓﻲ ﺠﺴﺎﺀﺓ.ﺍﻟﺭﻜﺎﺌﺯ ﺍﻟﻤﻁﺎﻁﻴﺔ ﻭﻗﺩ ﺃﺩﻯ ﺘﻁﺒﻴﻕ ﺍﻟﻁﺭﻴﻘﺔ ﺍﻟﻤﻘﺘﺭﺤﺔ ﺇﻟﻰ ﺇﻴﺠﺎﺩ ﻨﻤﻭﺫﺝ.ﺍﻟﺭﻜﺎﺌﺯ ﺍﻟﻤﻁﺎﻁﻴﺔ ﻓﻴﻤﺜل ﺍﻟﺘﻐﻴﺭﺍﺕ ﻓﻲ ﺍﻟﻅﺭﻭﻑ ﺍﻟﻤﺤﻴﻁﺔ .ﺨﻁﻰ ﻤﺭﻥ ﻴﻌﺘﻤﺩ ﻋﻠﻰ ﻨﻅﺭﻴﺔ ﺍﻟﻌﻨﺎﺼﺭ ﺍﻟﻤﺤﺩﻭﺩﺓ ﻟﻬﺫﺍ ﺍﻟﺠﺴﺭ This paper summarizes the application of a rational methodology for the assessment of older reinforced concrete Tunisian bridges. This methodology is based on ambient vibration measurement of the bridge, identification of the structure’s modal signature and finite element model updating. The selected case study is the SidiBouAli river bridge which is an eight-span simply supported bridge with a continuous slab. Each span has a length of 25 m and is supported by rubber bearings at the supports. Ambient vibration tests with output-only measurements were conducted on the bridge using a data acquisition system with nine force-balance accelerometers placed at selected locations of the bridge. The Enhanced Frequency Domain Decomposition technique, known to be robust with respect to the complex non-stationary nature of the unmeasured excitation, was applied to extract the dynamic characteristics of the bridge. For model updating, it was assumed that the parameters that can be changed in the model are the concrete modulus of elasticity and the rubber bearing stiffness. The first parameter indicates any possible damage in the bridge and the second parameter reflects the changes in boundary conditions. The application of the proposed methodology led to a relatively faithful linear elastic finite element model of the selected bridge.
INTRODUCTION Tunisia has more than 3000 bridges with a minimum span length of 3 meters. Several of these bridges are old and designed based on outdated code regulations. A certain number of these bridges has suffered degradation and damage due to traffic and environment. Current bridge inspection techniques are based on visual inspection techniques conducted by experienced engineers. A recent study1 conducted by FHWA reported that at least 56% of average condition bridge visually based rating in the United States were incorrect due to factors such as inspector’s experience, bridge type and condition. Therefore, there is a need to develop a rational and scientific methodology for bridge inspection and evaluation. This paper summarizes part of the ongoing work conducted in Tunisia within the framework of a
research project funded by the Center for Testing and Construction Techniques which is affiliated to the Ministry of Infrastructure. The project deals with the development of a rational methodology for the assessment of older reinforced concrete bridges. This methodology is based on the following steps: (a) response-only ambient vibration measurement of the bridge; (b) output-only modal identification of the bridge’s modal signature; (c) finite element model updating which yields a linear elastic finite element model that reproduces as much as possible the real experimental behavior of the bridge; and (d) estimation of maximum bridge capacity and prediction of its failure modes based on detailed nonlinear finite element analyses. The focus of this paper is on the application of the first three steps of this methodology on the SidiBouAli river bridge which was built in the early 90’s.
29
S. El-Borgi et al.
The tested bridge is located on Tunisia’s Highway connecting the cities of Tunis and Sousse at the section where the highway crosses the river of SidiBouAli. This case study, constructed in the early 90’s, is an eight-span simply supported bridge with a continuous slab and a span length of 25 m (Figure 1a). Each span consists of eleven equally spaced longitudinal I-shape girders (Figure 2) which are laterally connected at the supports by cross girders. Each main girder rests on a 40×30×8 cm elastomeric bearing. Because the bridge spans are simply supported and are similar, this study was only limited to only one span shown in Figure 1b.
elements. The x, y and z-coordinates represent, respectively, the longitudinal axis along the bridge, the horizontal transversal axis and the vertical axis (Figure3). The material behavior is assumed to be linear elastic, isotropic and homogeneous. The concrete modulus of elasticity was estimated at 32000 MPa based on concrete samples compression tests. The mass density of concrete was assumed to be 2400 kg/m3. An additional mass of 200 kg/m was added in the model to account for the bridge’s footway and handrail. The stiffnesses of the individual elastomeric bearings were estimated based on an instanteneous modulus of elasticity of 4.8 MPa and an instanteneous shear modulus of 1.6 MPa as follows: Kx = Ky = 2.4 109 N/m; Kz = 7.2 109 N/m.
FINITE ELEMENT MODELING
OPTIMUM SENSOR LOCATION
A three dimensional finite element model of the bridge was elaborated using the SAP2000 computer program2 based on a detailed geometric model. Two types of elements were used for the finite element modeling of the bridge, namely four and three-noded shell element for the concrete girders and the topping slab and linear spring elements for the elastomeric bearings. The model, shown in Figure 3, uses a total of 6834 shell
The developed finite element model is transferred to the program FEMTools3 which is then used to simulate tests based on predefined locations and directions of the accelerometers. FEMTools, essentially, reduces the finite element model into a test model. The modal assurance criterion (MAC) is then used as a correlation analysis tool between the
DESCRIPTION OF THE CASE STUDY
(a)
(b)
Figure 1. A General view of SidiBouAli’s river bridge: (a) entire bridge; (b) tested span
Figure 2. Cross-sectional view of the bridge (all dimensions are in meter)
30
Emirates Journal for Engineering Research, Vol.9, No.2, 2004
Modal Identification and Finite Element Model Updating of a Reinforced Concrete Bridge
numerical and the simulated experimental mode shapes. After several attempts, it was decided to have five measurement points along each of the eleven beams (Figure 4) where the z and the y-components of the acceleration are measured at each point. Additional points were measured at the supports including the x, y and z-components of the acceleration. This sensor
configuration led to the MAC plot shown in Figure 5. This figure clearly indicates that there is an almost one to one correspondance between between the numerical and the simulated experimental mode shapes with a MAC value of 100% for the first ten vibration modes, meaning an almost perfect correlation.
Figure 3. Finite element model of one bridge span
Figure 4. Sensor location shown in dark dots across the bridge span (3-D and bottom views)
100
MAC (%)
80 60 40 20 0 10
8
FEM S
6
4
2
1
3
5
7
9
M SE
S
Figure 5. MAC Plot of Finite Element Mode Shapes (FEMS) versus Simulated Experimental Mode Shapes (SEMS)
Emirates Journal for Engineering Research, Vol.9, No.2, 2004
31
S. El-Borgi et al.
AMBIENT VIBRATION TESTS A proper evaluation of the bridge requires an accurate estimation of its modal signature (frequencies, mode shapes and damping ratios) based on measurement of the vibratory response. For large structures, ambient vibration tests with output-only measurements are preferred over forced vibration tests where both the excitation and the response are measured. The reason is that the measured response in an ambient vibration test is representative of the actual operating conditions of the structure which vibrates under its natural excitation loads such as traffic, wind, and microtremors. Ambient vibration tests were conducted on the bridge using a sixteen-channel data acquisition system called Vibration Survey System Model VSS-30004 with nine force-balance accelerometers, model FBAES-U5. A picture of the data acquisition setup is shown in Figure 6. The sensors, which are capable of measuring accelerations of up to ±0.25g with a resolution of 0.1µg, convert the physical excitation into electrical signals. Each accelerometer is connected to the data acquisition system using a 100m long cable. Cables are used to transmit the electronic signals from sensors to the signal conditioner. The signal conditioner unit is used to improve the quality of the signals by removing undesired frequency contents (filtering) and amplifying the signals. Vibration experiments were conducted during 10 minutes at a sampling frequency of 100 Hz. Signals converted to digital form are stored on the hard disk of the data acquisition computer.
Figure 7. Average of normalized singular values of spectral density matrices of all data sets using EFDD algorithm
MODAL SIGNATURE INDENTIFICATION The complex non-stationary nature of the unmeasured excitation requires the use of robust output-only modal identification techniques such as the Enhanced Frequency Domain Decomposition method6,7 and the Stochastic Subspace Identification methods8. These methods were recently applied successfully to buildings and bridges6,9. These techniques are available in the program Artemis Extractor10. In the present study, the Enhanced Frequency Domain Decomposition (EFDD) technique was applied to accurately extract the modal signature of the bridge. Table 1 shows the measurement-based estimates of the natural frequencies of the first five modes using the EFDD method. Table 1 also shows the natural frequencies computed by the program SAP2000 and the relative error between these frequencies and the identified test frequencies. The error varies between 10% and 29% for the first four vibration modes which clearly indicates the need to update or correct the finite element model. The measurement-based estimates of the damping ratios identified by the EFDD technique, shown in Table 1, reveal a relative variability and range approximately in the interval between 4% and 9%. The values of the damping ratios for the first three modes appear to be reasonable while the fourth and fifth mode damping ratios appear to be highly estimated by the EFDD technique.
Table 1. Measurement-based estimates of the natural frequencies and damping ratios using the EFDD technique and computed frequencies Estimated from Measurements Mode using EFDD Technique Frequency Damping (Hz) Ratio (%) 4.30 4.60 1 4.84 4.39 2 6.18 5.99 3 9.10 9.43 4 13.07 8.54 5
Computed by SAP2000 Frequency (Hz) 4.78 5.85 7.97 10.05 12.83
Relative error in frequency (%) between test and model 11.2 20.9 29.0 10.4 -1.8
Figure 6. Data acquisition system and an accelerometer fixed to the bridge
32
Emirates Journal for Engineering Research, Vol.9, No.2, 2004
Modal Identification and Finite Element Model Updating of a Reinforced Concrete Bridge
FINITE ELEMENT MODEL UPDATING The finite element model updating consists of obtaining a reasonable correlation between experimental and numerical modal properties. It was assumed that the updating parameters are the concrete modulus of elasticity and the rubber bearing stiffness. The modulus of elasticity indicates any possible damage or stiffness reduction in the bridge which means physically that this parameter can only be reduced. On the other hand, the rubber bearing stiffness, which was assumed to increase as a function of age, reflects the changes in boundary conditions. The updating consists of performing a sensitivity analysis of the model stiffness matrix with respect to changes in these parameters. This translates to taking the derivative of the stiffness matrix with respect to these parameters. The updating was performed based on two indicators that were applied simultaneously using the vertical displacement (z-direction): (a) comparison between computed and measured frequencies; and (b) comparison between computed and measured mode shapes. The comparison between the frequencies is estimated using the relative error between the computed and measured frequencies, while the comparison between the computed and measured mode shapes is evaluated using a correlation analysis tool known as Modal Assurance Criterion (MAC). The model updating is an iterative procedure performed using the program FEMTools3. Table 2 shows the test and model frequencies after updating obtained using 40 iterations. The relative error, which was before updating between 10% and 29% for the first four vibration modes (Table 1), became less than 2% as shown in Table 2. The first five vibration modes after updating are shown, respectively, in Figures 8 to 12. Figure 13 shows the MAC Plot between the updated Finite Element Mode Shapes (FEMS) and the Experimental Mode Shapes (EMS). This figure indicates that there is an almost one to one correspondence between the numerical and the experimental mode shapes for the first five vibration modes. Furthermore, the diagonal MAC value ranged between 73% and 87% for the first three vibration modes. Table 3 gives the percentage number of elements in terms of changes in parameters selected for model updating. This table indicates that 42% of the concrete elements remain intact while 30% of the elements undergo a stiffness reduction between 80% and 100% of their initial value and an additional 15% undergo a stiffness decrease between 60% and 80%. Table 3 shows that more than 50% of the rubber bearing elements remains intact while the remaining elements undergo an increase in stiffness. It is worthy to mention that the most important bearing stiffness is the z-component.
Table 2. Measurement-based estimates of the natural frequencies using the EFDD technique and computed frequencies after updating Mode
Test Frequency (Hz)
Model Frequency after updating (Hz)
Relative error between test and model frequency (%)
1 2 3 4 5
4.30 4.84 6.18 9.10 13.07
4.22 4.85 6.29 8.97 11.60
-1.9 0.2 1.8 -1.4 -11.2
Figure 8. 1st updated mode shape (4.22 Hz)
Figure 9. 2nd updated mode shape (4.85 Hz)
Figure 10. 3rd updated mode shape (6.29 Hz)
Figure 11. 4th updated mode shape (8.97 Hz)
Figure 12. 5th updated mode shape (11.60 Hz)
Emirates Journal for Engineering Research, Vol.9, No.2, 2004
33
S. El-Borgi et al.
conditions. Finally it can be concluded that the application of the proposed methodology on this particular bridge led to a relatively faithful linear elastic finite element model.
100 MAC (%)
80 60
ACKNOWLEDGMENTS
40 20 0 5 4 3 2 FEMS
1 1
2
3
45
EM
S
The authors are grateful for the funding provided by the Tunisian Center for Testing and Construction Techniques. Sincere thanks are due to the technical and adminstrative personnel who assisted the authors in conducting the ambient vibration tests on the SidiBouAli’s river bridge.
REFERENCES Figure 13. MAC Plot of updated Finite Element Mode Shapes (FEMS) versus Experimental Mode Shapes (EMS)
Table 3. Number of elements in terms of changes in parameters selected for model updating Elastomeric Bearing Stiffness Modulus of Elasticity (E) Kx Ky Kz Number of Parameter Parameter Number of Elements in Elements in % expressed in % of expressed in % of total elements of of total initial value % of initial same type elements of value same type 100% 42.4 100% 63.6 68.2 50.0 80% - 100% 30.5 100% - 150% 9.1 31.8 22.8 60% - 80% 14.7 150% - 200% 18.2 40% - 60% 7.2 200% - 250% 20% - 40% 3.9 250% - 300% 4.5 0% - 20% 1.3 300% - 500% 27.3 4.5 Total 100 100 100 100
CONCLUSIONS A rational methodology for the assessment of older reinforced concrete Tunisian bridges was applied on the SidiBouAli river bridge as an alternative to a visual inspection methodology. This methodology is based on ambient vibration measurement of the bridge, identification of the structure’s modal signature and finite element model updating. The modal properties for the first five vibration modes were successfully identified using the Enhanced Frequency Domian Decomposition technique. The error in the model frequencies before updating ranged between 10% and 29% for the first four vibration modes which clearly indicates the need to update the finite element model. These errors became less than 2% after updating. Furthermore, a good correlation between the experimental and finite element mode shapes was obtained at least for the first three vibration modes. The parameters selected for updating are the concrete modulus of elasticity and the rubber bearing stiffness. The concrete modulus of elasticity indicates any possible damage in the bridge, while the rubber bearing stiffness reflects the changes in boundary
34
1. Phares and Brent, “Highlights of Study of Reliability of Visual Inspection”, Presentation at the Annual Meeting of TRB Subcommittee A2C05(1) Non-destructive Evaluation of Structures, FHWA Report Nos. FHWARD-01-020 and FHWA-RD-01-021, 2001. 2. Computers and Structures, Inc. “SAP2000: Three Dimensional Static and Dynamic Finite Element Analysis and Design of Structures”, 2000. 3. "FEMTools Program Overview," http://www.femtools.com, accessed April 30, 2003. 4. Kinemetrics, Inc., “Operating Instructions for Vibration Survey System, VSS-3000”, 1997. 5. Kinemetrics, Inc., “User’s Guide for the EpiSensor Force Balance Accelerometers, Model FBA ES-U”, 2000. 6. Brincker, R. and Andersen, P., “Ambient Response Analysis of the Heritage Court Building Structure”, Proceedings of the 18th International Modal Analysis Conference (IMAC), San Antonio, Texas, 2000, pp. 1081-1087. 7. Brincker, R., Andersen, P. and Zhang, L., “Modal Identification From Ambient Responses using Frequency Domain Decomposition”, Proceedings of the 18th International Modal Analysis Conference (IMAC), San Antonio, Texas, 2000, pp. 625-630. 8. Van Overschee, P. and De Moor, B. (1996) Subspace Identification for Linear Systems: Theory, Implementations and Applications, Kluwer Academic Publications. 9. Brincker, R., Andersen, P. and Frandsen, J.B., “Ambient Response Analysis of the Great Belt Bridge”, Proceedings of the 18th International Modal Analysis Conference (IMAC), San Antonio, Texas, 2000, pp. 2632. 10. "Artemis Extractor Program Overview," http://www.svibs.com, accessed April 30, 2003.
Emirates Journal for Engineering Research, Vol.9, No.2, 2004