SEI Conference
May 2007
Modal System Identification & Finite Element Model Updating of a 15-story Building using Earthquake & Ambient Vibration Data Authors: Derek Skolnik, University of California, Los Angeles, USA,
[email protected] Eunjong Yu, Hanyang University, Seoul, Korea,
[email protected] John Wallace, University of California, Los Angeles, USA,
[email protected] Ertugrul Taciroglu, University of California, Los Angeles, USA,
[email protected]
ABSTRACT The focus of this study is the application of novel as well as existing methods of modal system identification and finite element model updating techniques to experimental data. The data are collected during a small earthquake and from ambient vibrations. The specimen structure is named the “Louis and Doris Factor Building,” and is located at the UCLA campus. It was instrumented by the U.S. Geological Survey with an embedded 72-channel accelerometer network following the 1994 Northridge earthquake. This network provides continuous vibration data. The collected data were used first to estimate the modal properties of the building, which were subsequently used to update a finite element model of the structure using an improved method. The results indicate that the combined use of modal system identification and model updating techniques yields a practically useful picture of the structural state; and furthermore, this approach may be used for obtaining a calibrated mathematical model of the dynamic response of non-structural components.
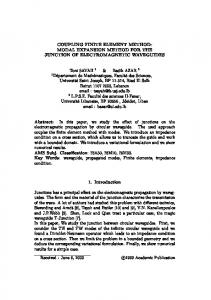
INTRODUCTION & THE DESCRIPTION OF THE BUILDING This paper summarizes the modal system identification and finite element model updating studies on the “UCLA Doris and Louis Factor Health Science building,” and a full account of this effort may be found in Skolnik et al. (2006). The specimen building, shown in Figure 1(a), is home to several centers for the health sciences, including the School of Nursing, the Jonsson Comprehensive Cancer Center, as well as other biomedical facilities. Designed and constructed in the late 1970s, the 15-story, 216.5 fthigh building is the tallest on campus. The structural system consists of a Special Momentresisting (steel) Frame (SMF) supported by concrete bell caissons and spread footings. A typical floor plan, shown in Figure 2, displays the orientation of the seismic framing system. For the most part, the building is symmetric about the East-West axis, and slightly asymmetric about the North-South axis. Each floor consists of a 6¼-inch thick lightweight concrete slab on 3-inch metal decking and a brick veneer anchored to the floor. The surface area for floors 10 through 16 (roof) increases by approximately 13.5% due to a slight overhang on the east and west faces of the building. Glass curtain walls complete the façade, which consist of ¼-inch thick spandrel
Skolnik, et al.
1
SEI Conference
May 2007
glass panels supported by an aluminum frame. The fifteenth story houses mechanical equipment; and there are two basement levels.
FIGURE 1 LOUIS FACTOR BUILDING FACING EAST (A), AND (B) ITS FINITE ELEMENT MODEL FACING WEST
Following the 1994 Northridge earthquake, the United States Geological Survey (USGS) instrumented the structure with 72 uniaxial force-balanced accelerometers with an on-site recording system. Four accelerometers are installed at each floor above grade, and are oriented to record translational motions near the perimeter of the floor (two per each direction). Both of the two basement levels have accelerometers to record vertical as well as translational responses. The building’s sensor network was upgraded in 2003, using funds provided primarily by the NSF Science and Technology Center for Embedded Networked Sensing (CENS) headquartered at UCLA. The upgrade consisted of converting all 72 channels to a 24-bit network continuously recording data viewable via the Internet in real-time. This reconfiguration included the installation of nine, eight-channel Q4120 A/D data loggers recording at 100 and 500 samples per second, resulting in approximately 3 Gigabytes/day of data that are stored on a 1.5-Terabyte RAID array. In 2005, a 330 ft-deep borehole seismometer was installed approximately 160 ft away from the building. Ongoing installations of several more seismometers in a nearby location extend the free-field network. The level of instrumentation provided in and around the Factor building makes it one of the most densely (permanently) instrumented buildings in North America.
Skolnik, et al.
2
SEI Conference
May 2007
FIGURE 2 TYPICAL FLOOR PLAN, SENSOR LOCATIONS, D ERIVED STORY ACCELERATIONS (UO, VO, QO), THE SELECTED POINT OF REFERENCE AND POSITIVE DIRECTIONS
SMALL EARTHQUAKE AND AMBIENT VIBRATION DATA The sensor network continuously records data, and has recorded numerous small earthquakes to date. One such event occurred on September 28, 2004, 10:15AM PDT due to ground shaking originating (with Mw = 6.0 on the moment magnitude scale) from Parkfield, CA. The accelerations due this event, recorded by Factor building’s sensor array, were used for structural system identification. According to data available through the USGS Earthquake Hazards Program (USGS, 2004), the earthquake epicenter was located approximately 163 miles from the Factor building; and a peak acceleration of only 0.0025g was recorded at the roof of the building during this event. In addition to earthquake vibration data, acceleration records collected on April 29, Thursday, 2004 at 3:00AM were extracted from the sensor network’s database to establish an ambient vibration data set. This particular date and time were selected in order to minimize the effects of traffic inside and outside of the building. The collected raw data were “detrended” to remove any signal bias and/or linear trends. Decimating the data at a lower sample rate removes high frequency noise and reduces the data size. Data processing is performed using built-in functions (i.e., detrend, resample) of the MATLAB Signal Processing Toolbox (MATLAB, 2004). Figure 3 displays the East-West acceleration history during the Parkfield earthquake for selected floors. Figure 4 displays the smoothed Fast Fourier transforms (FFT) of the Factor building’s story accelerations in response to Parkfield earthquake and ambient vibrations. For the case of the Parkfield earthquake, the sensors on the ground floor measure the input; therefore, the excitation is known. For the ambient vibration data, the excitation is not measured (i.e., unknown).
Skolnik, et al.
3
SEI Conference
May 2007
FIGURE 3 EAST-WEST STORY ACCELERATIONS FROM SENSOR RECORDINGS DURING THE 2004 PARKFIELD, CA EARTHQUAKE FOR S ELECT F LOORS
FIGURE 4 ARBITRARILY SCALED SMOOTHED FAST FOURIER TRANSFORMS OF THE EW, NS, AND TORSIONAL FLOOR ACCELERATIONS FROM BOTH PARKFIELD EARTHQUAKE AND AMBIENT VIBRATION MEASUREMENTS (NOTE THAT THE TOP AND BOTTOM PLOTS HAVE DIFFERENT SCALING)
Skolnik, et al.
4
SEI Conference
May 2007
MODAL SYSTEM IDENTIFICATION There is a large variety of system identification algorithms in open literature. For the present study, we adopted the “Numerical Algorithm for Subspace State-Space System Identification (N4SID)” by Van Overschee and De Moor (1994). This non-iterative approach yields reliable state-space models for complex multivariable dynamical systems, directly from measured data with modest computational effort. The N4SID algorithm is available in the System Identification Toolbox of MATLAB (2004), and we used it to determine the modal properties of the Factor building as outlined below. A linear time-invariant dynamical system can be described by the discrete first order differential equation in the state space at the kth time step as
X k +1 = AX k + BU k + ! k ,
(1)
= CX k + DU k + " k ,
Yk
where X is the state vector; A is the state matrix; B is the input influence coefficient matrix; C is the real output influence matrix; D is the output control influence coefficient matrix; U is the observed input; and Y is the output vector. In (1), ν and ω represent measurement and process noise terms, respectively, both of which may be modeled as uncorrelated, zero-mean, stationary, white noise vector sequences. In case of ambient vibrations, the input term U is treated as white noise, and thus, is lumped into ν and ω , which renders the state-space model
X k +1 = AX k + ! k , Yk
(2)
= CX k + " k .
N4SID algorithm yields the estimates of the system matrices (A and C) based on a linear least-squares approximation. The complex eigenvalues (λ) and eigenvectors (ψ) of the damped system can be calculated from the system matrix A; and if the damping is assumed to be small, and nearly classical, then the modal properties of the structure can be approximated as (see, for example, Safak 1991) f i = !i 2" ,
( )
# i = Re !i
2" f i ,
(
)
$i = C% i & sign '( Re C% i )*
(3)
where Re(•) and sign[•] denote the real part and the algebraic sign of their arguments; and fi , !i , and !i , respectively, are the natural frequencies, damping ratios and the mode shapes for the ith mode. Implementation of the N4SID algorithm requires a priori selection of the order of the state-space model (i.e., the dimension of state vector X), which is a challenging problem. In general, an N Degree-Of-Freedom (DOF) system will have a state-space model order of 2N. If we assume rigid-diaphragm behavior for floor slabs, and ignore the vertical responses, the Factor building has three degrees of freedom per each of its fifteen floors, resulting in a 45-DOF system. However, because of measurement noise and the non-white noise nature of the unknown
Skolnik, et al.
5
SEI Conference
May 2007
excitation (in the case of ambient vibration data), a model order that is higher than 90 is needed for extracting as many physically meaningful modal parameters from data as possible. Because of such high model orders, the N4SID algorithm identifies “superfluous” modes. In order to distinguish the structural modes from the superfluous ones, stability plots are typically employed (Bodeux and Golinval, 2001). As the model order increases, the identified structural modes (and hence associated modal properties) should remain reasonably stable. Stability tolerances are chosen based on the change in frequency (Δf), change in damping ratios (Δζ), and on the Modal Assurance Criterion (MAC) (see, for example, Link, 1999). Herein, stable modes for a given model order are defined as modes for which all three of the following criteria are met
!f < 1% ,
!" < 5% , MAC > 99%.
(4)
Figure 5 displays the stability plot for model identification using data from the Parkfield earthquake. The final modal properties are selected as the stable modes of the highest model order and are displayed in Table 1.
FIGURE 5 STABILITY PLOT WITH FFTS FOR SYSTEM IDENTIFICATION RESULTS USING RECORDED RESPONSES TO THE PARKFIELD EARTHQUAKE. THE Y-AXIS REPRESENTS THE INCREASING USER-SELECTED MODEL O RDER
Skolnik, et al.
6
SEI Conference
Mode Shape No. Direction 1 EW 2 NS 3 Torsion 4 EW 5 NS 6 Torsion 7 EW 8 NS 9 Torsion
May 2007
Ambient Vibrations Parkfield EQ Freq (Hz) Damp (%) Freq (Hz) Damp (%) 0.545 5.1 0.467 4.8 0.588 8.3 0.506 4.7 0.807 10.8 0.681 5.8 1.626 2.1 1.488 5.4 1.795 1.4 1.665 4.9 2.485 2.9 2.362 7.4 2.825 2.2 2.677 4.4 3.061 1.3 2.862 4.9 4.017 2.9 3.826 4.6
Difference Freq (%) Damp (%) 14.3 5.9 13.9 43.4 15.6 46.3 8.5 -157.1 7.2 -250.0 4.9 -155.2 5.2 -100.0 6.5 -276.9 4.8 -58.6
TABLE 1 IDENTIFIED MODAL PROPERTIES
We can observe from Table 1 that a stiffer structure with substantially reduced higher modal damping ratios is identified when we use ambient vibration data. This phenomenon may be attributed to Non-Structural Components (NSCs) that contribute more stiffness (see also, Kohler et al., 2005) and a broader excitation bandwidth at low-amplitude than at higher-amplitude vibrations.
FINITE ELEMENT MODELING We created an initial finite element model of the Factor building—illustrated in Figure 1(b)—— based on architectural and structural drawings. We made modeling assumptions that, we believed, would best reflect how the building behaves under ambient and/or small amplitude vibrations. These assumptions included modeling the gravity columns and girders explicitly, rendering the partially restrained connections as fully restrained, setting the rigidity factor to 0.5 in the panel zones, considering composite action between the girders and slabs, and modeling the foundation as a fixed base. Table 2 includes a list of estimated mass quantities that were used for the floor and exterior wall systems. Floor System
Exterior Wall System
Concrete Deck
Partitions
Mech. Equip.
Brick Veneer
Curtain Wall
46 psf
10 psf
5 psf
25 psf
5 psf
TABLE 2 ESTIMATED MASS QUANTITIES FROM ARCHITECTURAL DRAWINGS
Under the assumptions that floor diaphragms are rigid in-plane and masses are lumped at the center of mass at each floor level, we assembled and extracted the mass and stiffness matrices from the finite element model. The modal properties of the undamped system are obtained by solving the eigenvalue problem that involved these two matrices. Frequencies and mode shapes for the first nine modes of this initial analytical model are compared to those identified using the Skolnik, et al.
7
SEI Conference
May 2007
Parkfield earthquake data in Table 3. Not only is there a considerable discrepancy between identified and analytical frequencies, but also the order of NS and EW modes is reversed. Mode Shape No. 1 2 3 4 5 6 7 8 9
Dir. EW NS Torsion EW NS Torsion EW NS Torsion
Identified from Parkfield 0.467 0.506 0.681 1.488 1.665 2.362 2.677 2.862 3.826
Freq. (Hz) 0.513 0.511 0.666 1.507 1.445 1.903 2.534 2.386 3.185
Initial Model Error MAC (%) (%) -9.9 99.9 -1.0 99.6 2.2 99.9 -1.3 99.7 13.2 98.1 19.5 97.8 5.3 98.9 16.6 94.5 16.7 94.3
Freq. (Hz) 0.473 0.514 0.691 1.507 1.670 2.319 2.580 2.761 3.743
Updated Model Error MAC (%) (%) -1.3 99.8 -1.6 99.9 -1.5 99.2 -1.3 99.2 -0.3 98.5 1.8 98.3 3.6 99.3 3.5 98.9 2.2 99.2
TABLE 3 MODAL PROPERTY COMPARISON BETWEEN IDENTIFIED AND ANALYTICAL MODELS
MODEL UPDATING The modal properties identified using the Parkfield earthquake are used for finite element model updating, instead of those identified using ambient vibrations, since they better represent the response of the structure subjected to earthquake ground motions. The initial finite element model appears to underestimate both the mass and the stiffness of the actual building. We reasoned that the model underestimates the mass because contributing live load and the superimposed dead load masses are not considered. Stiffness also is underestimated, because the contributions of the NSCs are not considered in the finite element model. To include these contributions, a simple “stick” model—with mass and stiffness properties directly related to the parameters to be updated—is superimposed to the initial finite element model (Figure 6). Each story of the stick model is assigned an effective EW, NS, and torsional stiffness resulting in 45 stiffness parameters. The mass quantities (i.e., translational masses and mass moment of inertia) assigned to each node are based on a uniformly distributed weight, resulting in 15 mass parameters. The parameters are defined as ratios, ranging from zero to one, such that the properties assigned to the stick model are the corresponding parameters multiplied by the preassigned maximum physical quantities. Determining the maximum values of the additional stiffness and mass quantities assigned to the stick model requires special considerations and engineering judgment. Depending on the type of the NSCs, it is reasonable to assume that the additional story stiffness, provided by the NSCs (mainly interior partitions and the 1.5 inch-thick brick veneer), is less than the initial story stiffness provided by the seismic frame. This assumption can be revisited based on the results obtained for the parameters during the updating process. In order to roughly quantify the initial story stiffness, a shear building model of Factor’s SMF is constructed. Although the story stiffness values extracted from this model may be greater than the story stiffness values of the complete model, they provide an appropriate starting point to assign stiffness values for the stick model. The weaker story stiffness values (EW, NS, and torsional) of the SMF shear-building
Skolnik, et al.
8
SEI Conference
May 2007
model are taken as the maximum values for the stiffness quantities in the stick model. Although the Factor building houses several laboratories with heavy equipment (e.g., walk-in refrigerators), the additional weight (mass) is likely to be less than the self-weight of the structure—a direct result of the massive concrete deck (the selected maximum stiffness and mass values for the stick model are listed in the last column of Table 4).
FIGURE 6 THE ORIGINAL FINITE ELEMENT MODEL (SCHEMATIC) AND THE SUPERIMPOSED “STICK” MODEL The next step in model updating is to define a residual vector that measures the error between the analytical and identified modal data. The analytical modal data depends on the chosen values of the updating parameters, which are represented by the vector p. In order to maintain an overdetermined system of equations, the number of updating parameters (in this case 60) should be less than the number of identified results (in this case 135—i.e., 9 eigenvalues plus 9 ! 14 independent eigenvector elements). In order to simplify the notation, we define the following
{ = {"
}, " } ,
!( p) = " 12 ! " 29 !
2 1
!
2 9
T
T
{ = {$
}, $ }
#( p) = $ 1T ! $ T9 #
T 1
!
T 9
T
T
(5)
where ! i and !i are the identified eigenproperties, and ! i and !i are the eigenproperties obtained from the analytical model (i.e., the stick model superimposed to the initial FE model). As a result, the vector of analytical eigenproperties is a nonlinear function of the vector of updating parameters, p. For the eigenvalues, the residual is defined as the relative difference between the identified and analytically obtained eigenvalues. The relative difference is taken to obtain a similar weighting factor for both the low and high frequencies. For the eigenvectors, each mode shape is first normalized by the roof value (to ensure the comparison of the same
Skolnik, et al.
9
SEI Conference
May 2007
ratios), and the residuals are taken as the difference between the identified and analytically obtained mode shapes. Thus, the residual vector is defined as
(
)
$ ! " !( p) . / ! ' r( p) = & ) &% # " #( p) )(
(6)
where the operator “ . / ” denotes an element-by-element division of vector components. The goal of model updating is to determine the set of parameters p that minimizes an appropriate norm of this error residual. This objective can be cast as a constrained nonlinear least-squares minimization problem as in
min r( p) p
2 L2
such that
0 ! pi ! 1 .
(7)
One way to solve (7) is to expand the vector of analytical eigenproperties into a Taylor series and truncate it to include only the linear term (Link, 1999), i.e.,
(
)
$- p(( p). / ( & $ ( ) (( p) . / ( & ! ( p ( a) , "p) # L $% r( p) &' p = p( a ) = + )+ , "p , +% * ) *( p) ,' p = p( a ) +% - p *( p) ,' p = p( a )
(8)
where !p = p " p (a) is the perturbation vector of (structural) updating parameters. Equation (8) can be expressed in a compact form as
! = ra " S a #p
(9)
where S is the sensitivity matrix defined as
$! p"( p). / " ' Sa = & ) &% ! p #( p) )( p = p( a )
(10)
and ra is the residual evaluated at p = p (a) . Consequently, the constrained nonlinear minimization problem becomes a constrained linear minimization problem. Equation (9) yields an iterative sequence for p; and if the initial guess is reasonably close to the actual (optimum) parameter values, this sequence will be convergent. The sensitivity matrix in (10) can be numerically evaluated for a given iteration using the forward-difference method. However, this matrix is often ill-conditioned because groups of distinct parameters may have very similar influences on the error residuals. This is a complication that arises frequently in inverse problems, and occurs, essentially, when the identification of a larger number of parameters is attempted than that warranted by the quantity and the information content of experimental data. The ill-conditioning may lead to a solution to (7) that contains large changes in some parameters and small changes in others, which may not be physically sound. In order address this issue, an
Skolnik, et al.
10
SEI Conference
May 2007
additional parameter constraint is introduced, which is based on correlation coefficients between all of the parameter sensitivities, which is computed as Rij ! Cij
CiiC jj
(11)
where C is the covariance matrix of the sensitivity matrix S. If, the correlation coefficient for any two parameters (e.g., pi and p j ) approaches to unity, then these two parameters should have similar values, whereas those with a correlation coefficient near zero should not. Negative coefficients are avoided by inverting the result—i.e., by assigning values as a function of 1 ! pi . For example, the correlation between a given mass and stiffness parameter is negative because an increasing mass has the same effect on the modal properties as a decreasing stiffness. Hence, for a given story, the three stiffness values (EW, NS, and torsional) and the three corresponding mass values (two translational masses and mass moment of inertia) are functions of their corresponding parameters (e.g., the lth, mth, nth, and qth) as k EW = pl ! 2500 k/in, k NS = pm ! 2500 k/in, kTor = pn ! 1.50 E09 k-in/in, m = (1 " pq ) ! 50 psf ! SF / g, I m = m ! # 2
(12)
where, SF and ρ are, respectively, the area (in square feet) and the radius of gyration for a given floor; and g is the gravitational acceleration. As mentioned previously, the value of each parameter ranges from zero to one; thus, the correlation constraint between the ith and jth parameters is simply given by pi ! p j " 1 ! Rij .
(13)
This aforementioned technique is adopted from Yu et al. (2007), who showed that the introduction of sensitivity-based correlation constraints alleviate numerical difficulties associated with ill conditioning. Another important step in the updating process is to assign a weighting matrix (W) that represents the relative confidence in the identified modal properties. In the present study, the solution appeared to be highly affected by the choice of W. While there is no definitive method for selecting the parameters of W, certain indicators are helpful. For example, it is apparent from Figure 4 that the first fundamental mode in each direction was excited significantly more than the higher modes for Parkfield data, which is not surprising because the structural response to ground motions is often dominated by the fundamental modes. This suggests the assignment of higher weights to lower frequencies. Additionally, the modes that satisfy the stability criteria more easily (or quickly) may be assigned higher weights. Finally, significant weight may be applied to the eigenvalue residuals to prevent them from being obscured by the presence of the many elements in the mode shape residuals. Taking these factors into account, the authors experimented with different weight and selected a diagonal weighting matrix W defined as
W = Diag !"15 12.5 12.5 7.5 7.5 7.5 10 10 10 1 ! 1#$
Skolnik, et al.
(14)
11
SEI Conference
May 2007
where W is a 135 ! 135 diagonal matrix, and the partition line separates the nine eigenvalue weighting factors from the eigenvector weighting factors. Upon implementing all of the aforementioned considerations, the sequential minimization problem is expressed as
min W S k !p " Wrk !p
2 L2
such that 0 # pi( k ) # 1 and
pi( k ) " p (j k ) # 1 " Rij
(15)
solution of which yields !p at the kth iteration that is subsequently used for updating, p (k +1) = p (k ) + !p . The sequence continues by solving (15) with the updated parameters until the residual norm and/or a proper norm of !p becomes less than a specified tolerance. An implicit function within the MATLAB optimization toolbox is used to solve this minimization problem. The additional stiffness and mass quantities, based on updated parameters and equation (12) of the stick model, are shown in Table 4; and the modal properties of the updated model are displayed in Table 3, which indicates that the agreement between the analytical and identified modal properties is drastically improved as a result of model updating. Floor
2nd
3rd
4th
5th
6th
7th
8th
9th
Units
EW Stiffness kip/in 794.7 700.4 547.2 406.0 337.0 236.6 378.4 555.4 NS Stiffness kip/in 1081.2 982.7 813.2 667.9 587.0 673.3 847.5 1055.2 6 Torsional Stiffness 891.4 799.5 663.6 544.1 479.8 474.1 592.2 762.4 10 kip-in/in Distributed Weight 5.5 psf 6.0 6.5 7.0 8.6 14.0 20.7 28.5 Floor
10th
11th
12th
13th
EW Stiffness 603.3 245.7 291.2 597.1 NS Stiffness 1196.3 753.8 1359.9 1884.8 Torsional Stiffness 670.9 887.1 1311.4 1615.0 Distributed Weight 31.7 29.8 35.1 40.3
14th
15th
875.0 2233.0 1730.6 43.0
1507.3 2421.8 1504.7 38.7
Roof MAX
Units
kip/in 1248.6 2500 kip/in 1951.8 2500 6 1198.7 2000 10 kip-in/in psf 36.9 50
TABLE 4 FINAL ADDITIONAL STIFFNESS AND MASS Q UANTITIES BASED ON UPDATED MODEL PARAMETERS
We can observe from Table 4 that the additional stiffness provided by the NSCs is greater in the NS direction than in the EW direction. Most likely, this is because more brick veneer walls are oriented to contribute in the NS direction. The effect of the additional brick veneer on the upper levels on the west face (see, Figure 1) is also noted as the upper floors tend to have more additional stiffness than the lower floors. The predicted response of the updated model to the Parkfield earthquake is compared to the responses derived from measured vibration data to verify the updated model. As means of quantifying the improvement in response prediction as a result of model updating, the relative norm of the response error (E) is calculated via
E = am (t) ! a p (t)
Skolnik, et al.
L2
am (t)
L2
(16)
12
SEI Conference
May 2007
where am(t) and ap(t) are the measured and predicted story accelerations respectively. Figure 7 displays the predicted and measured roof accelerations (which are nearly identical), along with the E values for the initial (Ei) and updated (Eu) models. Over the height of the building, the response error tends to decrease with the higher floors. It is noted that the translational responses are improved significantly and are predicted quite well. Although more discrepancy exists for the torsional response, the magnitude of the peak torsional responses are relatively low compared to the peak values for translation. Discrepancies with respect to the amplitude of the response may be due to inaccurate damping, as the identified damping ratios represent classical damping which might not be the actual case. It is also possible that the damping ratios will be varying with time (i.e., loading); however, varying the damping ratios (within reasonable bounds, e.g., ± 2%) proved to have little effect on the response error.
FIGURE 7 COMPARISON OF PREDICTED AND MEASURED ROOF ACCELERATIONS FOR THE PARKFIELD EARTHQUAKE. THE L2 NORM OF THE ERROR BETWEEN PREDICTED AND MEASURED RESPONSES (EI FOR THE INITIAL MODEL, AND EU FOR THE U PDATED MODEL) IS U SED TO QUANTIFY THE I MPROVEMENT DUE TO MODEL UPDATING
SUMMARY & CONCLUSIONS We presented a successful implementation of the N4SID algorithm, which identified modal properties of the first nine modes of the Factor building (a 15-story steel moment frame located on the UCLA campus) for both low-amplitude earthquake vibrations and ambient vibrations. Confidence in the identification of higher modes is limited by the excitation’s low frequency content. The modal frequencies identified from ambient vibrations represent a stiffer structure Skolnik, et al.
13
SEI Conference
May 2007
than those identified from the low-amplitude earthquake excitation. We believe this to be the result of larger contributions to stiffness from non-structural components for the lower amplitude events. We created an initial finite element model of the structure, and updated this model by using a modal-sensitivity based method with parameters representing the additional mass and stiffness of the building that are not readily modeled. The frequencies and mode shapes of the updated model compare well with those identified from the Parkfield earthquake. Furthermore, the predicted acceleration response of the updated model compares quite well with the measured data. We note that the final updated parameters (p) depend on the user-defined weighting matrix and constraints; and therefore, they are not unique despite the dense sensor array in the Factor building. The documentation provided on the building in this study, and the updated baseline, linear elastic finite element model can be used for future studies. An interesting future study might be the investigation of the minimum number of sensors needed to achieve reasonable identification and updating results. ACKNOWLEDGEMENT This research project is supported by The Center for Embedded Networked Sensing (CENS) under the NSF Cooperative Agreement CCR-0120778. The authors are grateful for the comments and cooperation of Dr. Thomas Sabol (UCLA Civil Engineering), Igor Stubailo and Monica Kohler (UCLA CENS), UCLA Capital Programs & Facilities Management, Factor building administrators, and the USGS.
REFERENCES [1] Bodeux JB, Golinval JC, “Application of ARMAV models to the identification and damage detection of mechanical and civil engineering structures,” Smart Materials & Structures, 10, 2001, 479-489. [2] Kohler M, Davis P, Safak E, “Earthquake and Ambient Vibration Monitoring of the Steel-Frame UCLA Factor Building,” Earthquake Spectra 21(3), 2005, 715-736. [3] Link M, “Updating of Analytical Models – Basic Procedures and Extensions,” Modal Analysis and Testing, NATO Science Series, 1999, Kluwer. [4] MATLAB 6.5 User’s Manual, 2004. [5] Safak E, “Identification of linear structures using discrete-time filters,” Journal of Structural Engineering., 117, 1991, 3064-3085. [6] Skolnik D, Lei Y, Yu E, Wallace JW, “Identification, Model Updating, and Response Prediction of a 15-Story Steel Frame Building,” Earthquake Spectra, 22 (3), 2006, 781-802. [7] United States Geological Survey (USGS), Earthquake Hazards Program, 2004 (http://quake.wr.usgs.gov). [8] Van Overschee P, De Moor B, “N4SID: Subspace Algorithms for the Identification of Combined DeterministicStochastic Systems,” Automatica, Special Issue on Statistical Signal Processing and Control. 30 (1), 1994, 7593. [9] Yu E, Taciroglu E, Wallace JW, “Parameter identification of framed structures using an improved finite element model updating method, Part I: Formulation and verification” Earthquake Engineering & Structural Dynamics, 2007, (in print).
Skolnik, et al.
14