Copyright © 2011 KSAE 1229−9138/2011/057−03
International Journal of Automotive Technology, Vol. 12, No. 2, pp. 173−182 (2011)
DOI 10.1007/s12239−011−0021−0
MODEL-BASED DESIGN OF A VARIABLE NOZZLE TURBOCHARGER CONTROLLER H. G. ZHANG , E. H. WANG , B. Y. FAN , M. G. OUYANG and S. Z. XIA 1)
1)
1)*
1)
2)
3)
College of Environmental and Energy Engineering, Beijing University of Technology, Beijing 100124, China State Key Laboratory of Automotive Safety and Energy, Tsinghua University, Beijing 100084, China Beijing Automotive Technology Center Co. Ltd., Beijing 100020, China 2)
3)
(Received 12 January 2010; Revised 20 July 2010)
ABSTRACT−Variable Nozzle Turbocharger (VNT) was invented to solve the problem of matching an ordinary turbocharger with an engine. VNT can harness exhaust energy more efficiently, enhance intake airflow response and reduce engine emissions, especially during transient operating conditions. The difficulty of VNT control lies in how to regulate the position of the nozzle at different engine working conditions. The control strategy designed in this study is a combination of a closedloop feedback controller and an open-loop feed-forward controller. The gain-scheduled proportional-integral-derivative (PID) controller was implemented as the feedback controller to overcome the nonlinear characteristic. As it is difficult to tune the parameters of the gain-scheduled PID controller on an engine test bench, system identification was used to identify the plant model properties at different working points for a WP10 diesel engine on the test bench. The PID controller parameters were calculated based on the identified first-order-plus–dead-time (FOPDT) plant model. The joint simulation of the controller and the plant model was performed in Matlab/Simulink. The time-domain and frequency-domain performances of the entire system were evaluated. The designed VNT control system was verified with engine tests. The results indicated that the real boosting pressure traced the target boosting pressure well at different working conditions. KEY WORDS : Variable nozzle turbocharger, System identification, PID controller design, Modeling, Diesel engine
1. INTRODUCTION
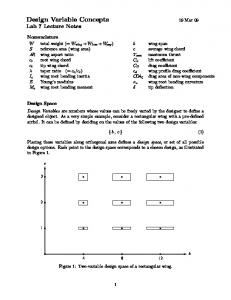
time of the intake air system lags significantly behind the fuelinjection system when the engine is working in accelerating conditions (Baratta ., 2010). A VNT can improve the transient-response performance of the intake-air system by regulating the nozzle position, thereby improving acceleration performance and reducing exhaust emission. Such a reduction in the transient-state emission of diesel engines, especially the particulate emissions, could be a remarkable advantage of the VNT. A schematic of a diesel engine matched with a VNT is shown in Figure 1. Fresh air is compressed by the compressor then cooled in the intercooler. The cooled air flows through the intake manifold pipes and enters the cylinders. The exhaust gas is discharged into the VNT through the exhaust-manifold pipes after being burned with the fuel in the cylinders. The exhaust gas expands in the turbine, and mechanical work is produced. Here differing from an ordinary turbocharger, there is a unison ring in the VNT, which regulates the nozzle in unison (Steve ., 2002). The nozzle can be rotated by its axle with a tab-and-slot mechanism connected to the unison ring; as a result, the regulation of the cross-sectional area of the airflow can be realized. The rotation of the unison ring is controlled by the actuator assembled on the turbine housing. The boosting pressure in the intake manifold can be used to control the amount of intake air to the engine cylinders
Variable Nozzle Turbocharger (VNT) is a good solution to overcome the shortcomings of an ordinary turbocharger matched with a vehicle engine. The use of the VNT will become more advantageous as engine-emission legislation becomes stricter. The nozzle geometry and area cannot be changed in an ordinary turbocharger; accordingly, the intake flow of the compressor cannot be adapted for the engine when the engine is working at low-speed conditions, and the amount of the intake air is insufficient for the requirements of large torque output. When the engine is working at high-speed conditions, the waste-gated valve has been adopted to bypass the exhaust gas to avoid overspeed operation of the ordinary turbocharger, but the exhaust energy cannot be fully utilized this way. The VNT resolves the above constraints by reducing the nozzle flow area at low engine speeds. This action results in an increased turbine speed, and the amount of intake air is accordingly increased. The VNT increases the nozzle flow area at high engine speed. This maintains a sufficient amount of intake air, while preventing damage to the turbocharger from overspinning. With the ordinary turbocharger, the response *
Corresponding author.
et al
et al
e-mail:
[email protected] 173
174
H. G. ZHANG
.
et al
Figure 1. Scheme of the VNT system. (Elbert and Spencer, 1990; Jensen ., 1991). When a VNT is used, the boosting pressure can be controlled by regulating the nozzle position, which is in turn regulated by the VNT control system. The key point of VNT control is to implement the regulation of the nozzle position quickly to reduce the response time of changes in intake airflow. Many vehicle manufacturers have developed VNT control systems including Nissan (Takashi ., 2001; Ogawa ., 1998), Fiat (Riccardo ., 1997), GM (Yongsheng ., 2006) and Chrysler (Ammann ., 2003). There are two main control methods used in the current control units. The first is feed-forward control (Takashi ., 2001; Ogawa ., 1998). The optimal position of the nozzle at a stable working point is obtained through engine tests and is then implemented in the control program as a lookup table mapped to the engine speed and load. The second method is proportional-integral-derivative (PID) feedback control (Ogawa ., 1998; Riccardo ., 1997; Ammann ., 2003; He ., 2006). The control strategy determines the target boostingpressure value by looking up in a map table. The pressure difference between the target boosting pressure and the real boosting pressure is calculated. The output value to drive the actuator is then computed according to the PI or PID control equations. The nozzle position can be readily achieved in steady-state conditions using the first method, but the performance is poor during transient conditions. Using the second method, the real boosting pressure can trace the target boosting pressure; however, while the effect is improved, the performance remains inadequate. Because the system characteristics over the working range are nonlinear, one set of PID controller parameters cannot satisfy the requirements for the whole range. Furthermore, a method for tuning the PID controller parameters has not been presented to date. In this study, a model-based method was introduced for VNT controller design. First-order-plus-dead-time (FOPDT) models were estimated at different working points. To overcome the system nonlinearity, a gain-scheduled PID controller was studied and a solution was developed. et al
et al
Figure 2. Scheme of the VNT control system.
et al
et al
et al
et al
et al
et
al
et
Figure 3. Designed control strategy of the VNT control system.
The scheme of the designed VNT control system is shown in Figure 2. The system consisted of the battery, the engine-speed
sensor, the accelerator-pedal-position sensor, the boostingpressure sensor, the intake-air-temperature sensor, the ambient-pressure sensor, the ignition switch, the diagnostic switch, the control module, the electro-hydraulic solenoid and the VNT. When the ignition switch is set on the “ON” position or the “Start” position, a voltage (24 V) is applied to the control unit. The control program samples the signals from the sensors and computes the output signal. The requirements for the VNT control system are that the real boosting pressure must be regulated to the target boosting pressure within two seconds in any engine working condition and the percent overshoot can be no more than 30%. The designed control strategy is shown in Figure 3 as a combination of the gain-scheduled PID controller and the feed-forward controller. The control object of the feedback control is the boosting pressure. The control object of the feed-forward control is the optimal nozzle position. The feedback control is responsible for keeping the real boosting pressure at the target boosting pressure in both steady and transient states. The feedforward control is responsible for providing a plausible floating base point for the PID controller. As shown in Figure 3, the engine load is represented by a load map based on the engine speed and the
et al
et al
et al
al
2. VNT CONTROL SYSTEM DESIGN
d
n
MODEL-BASED DESIGN OF A VARIABLE NOZZLE TURBOCHARGER CONTROLLER accelerator pedal position . The target boosting pressure is calculated by lookup in a map according to and . The real boosting pressure is sampled from the boostingpressure sensor. The pressure error ∆ = − is computed and input to the PID controller. The transfer function of the PID controller ( ) is expressed as: p
pt
n
d
Pr
P
Pt
Pr
Gc s
1 + T s⎞ G (s) = K ⎛⎝1 + T-----s ⎠ c
p
(1)
d
i
where is the proportional coefficient, is the integral time constant, is the derivative time constant and 1 is the output value of the PID controller. and were used to simplify the calculation of 1 in the control software, where = / and = . The gain-scheduled PID control strategy is used to adapt the parameters of the controller for different operating conditions. Here, , and are computed from three respective maps stored in the control software as 3D tables. The Lagrange linear interpolation method is used to calculate the output values according to the input values of and . The output value of the feed-forward control 2 is modeled as a function of the engine speed and the engine load , which are stored in the control program as a map. The map data were obtained from the engine-calibration tests. The output value to the plant model is the sum of 1 and 2. Ti
Kp
Td
Y
Ki
Kd
Y
Ki
Kp Ti
Kd
Kp
n
Ki
KpTd
Kd
d
Y
n
d
Y
Y
Y
3. PLANT MODEL IDENTIFICATION The parameters in the gain-scheduled PID controller must be calibrated using an appropriate method. The usual tuning method is empirical critical proportioning tuning (Haugen, 2004). Herein, the critical unattenuated oscillation curve is measured and stored to calculate the controller parameters. However, it is difficult to determine such a critical curve on the engine test bench. Therefore, the empirical critical proportioning tuning method was unsuitable for the VNT controller. Accordingly, a tuning method based on the identified plant model was applied here. This method avoids the need for many engine tests and provides sufficient accuracy and response times. There are two kinds of modeling approaches for control purposes: physical modeling and system identification. The plant model can be set up according to the working principles of physics, mechanics and chemistry. It is difficult to build such a physical plant model for a VNT control system because the parameters are difficult to measure and errors are often large in a lumped-parameters model. Hence, the first approach was not utilized here. In the system-identification approach, the plant model is treated as a black box and the designer only focuses on the data taken directly from the engine tests by exciting the plant and measuring its response. The process of constructing a model from experimental data is the main work of system identification. In the plant model for VNT control, the data input is the driving voltage applied to the actuator and the data output is the real boosting pressure. The driving-
175
voltage and the real boosting-pressure data were measured on the engine test bench. The relationship between the driving voltage and the real boosting pressure was found to be nonlinear over the entire engine operating range. As a result, a uniform linear plant model would not be accessible however, when the engine is running steadily at one point in the range, this relationship can be approximated as linear. The pertinent PID controller parameters can then be tuned based on the identified linear model. The classical approaches for acquiring the data are the step-response method and the impulse-response method (Antonio, 2006; Fang and Xiao, 2002; Su ., 2009). The step-response method was used to obtain the data in this work; the main stages are listed in the following. First, the feed-forward controller map was calibrated on the engine test bench. The nozzle position was adjusted from the maximum open position to the minimum open position, while keeping both the engine speed and the accelerator pedal position stable. The real boosting pressure was recorded with the nozzle at different positions and the target boosting pressure was thus determined. The driving voltage corresponding to the target boosting pressure was set as the target value in the map. Second, the target value of the driving voltage was set as the base voltage. A certain deviation voltage was added to or subtracted from the base value to excite the plant. The real boosting pressure was recorded during this process. Third, the recorded data were filtered and input to the system-identification toolbox in Matlab (Lennart, 1999, 2008). The process model was estimated in the GUI interface. Different configurations were tried to yield satisfactory results. The FOPDT plant model was estimated. The transfer function of the FOPDT model is written as: et al
K G( s) = ------------Ts + 1e
(2)
–τ s
where is the low-frequency gain, is the time constant and τ is the time delay. Operating points based on different engine speeds and loads were selected across the entire working range. Their relative plant models were estimated, and all the corresponding parameters of the PID controller were tuned based on these plant models. The gain-scheduled PID controller was then used to organize all the PID controller parameters. The VNT control system was assembled and installed on a WP10 common-rail turbocharged diesel engine (Weichai Power Co., Ltd., China). The engine is a water-cooled, four-stroke, EVB-brake, direct-injection and intercooled unit. The detailed specifications of the WP10 diesel engine are listed in Table 1. The typical results from the tests are presented in Figure 4. The data were measured at the engine working point of 2,200 r/min and 45% load. The output data of the real boosting pressure (upper part) were in response to the increment of the driving voltage (lower part). The time-domain data were imported into the graphical K
T
176
H. G. ZHANG
Table 1. Specification of Landking WP10 engine. Model WP10.290 Displacement 9.276 Bore × Stroke 126 × 130 Cylinder number 6 Valve number per cylinder 4 Fuel-injection equipment Common rail Rated power 213 Rated speed 2,200 Max. torque 1,200 Speed at max. torque 1,200-1,600
Unit L mm kW r/min N·m r/min
.
et al
where the low-frequency gain is 21.1887, the time constant is 0.852 s, and the time delay is 0.268 s. The measured signal and the simulated signal are compared in Figure 6. The measured boosting pressure is shown as the black line, and the simulated pressure is the blue line. The simulated line predicted the experimental line well. The difference between these output signals is presented in Figure 7. Significant differences were found in the intervals from -1 kPa to 1 kPa, so this result could meet the requirements for engine control. The cross-correlation between the input signal and the output residuals is shown in Figure 8. The results are within the confidence regions, indicating there was no significant correlation between past inputs and the residuals. The absolute stability of the FOPDT model was also analyzed. The results are listed in Table 2. The Matlab code is written as: num=21.1887; den=[0.852 1]; plant=tf(num,den); set(plant,'OutputDelay',0.268); allmargin(plant)
Figure 4. Measured data at 2,200 r/min and 45% load.
Figure 6. Comparison of the measured and simulated model outputs.
Figure 5. GUI interface used for data processing. user interface (GUI) shown in Figure 5. The data were split into two parts; one was used to estimate the plant model, and the other was used to validate the plant model. The FOPDT plant model was estimated as: 21.1887 e G(s ) = ----------------------0.852s + 1
–0.268 s
(3)
Figure 7. Residuals of the measured and simulated model outputs.
MODEL-BASED DESIGN OF A VARIABLE NOZZLE TURBOCHARGER CONTROLLER
177
crossover frequency increased as the engine load rose when the engine speed remained stable. The corresponding gain margin decreased at low and medium engine speeds but increased at high engine speed. 4. PID CONTROLLER TUNING
Figure 8. Cross-correlation between the input signal and the output residuals. The results shown in the command window of Matlab were as follows: GainMargin: [0.2666 1.1853 2.1249 3.0665 4.0086 4.9495] GMFrequency: [6.5252 29.4545 52.8320 76.2528 99.6837 123.0848] PhaseMargin: 71.2912 PMFrequency: 24.8393 DelayMargin: 0.0501 DMFrequency: 24.8393 Stable: 0 In the stable term, zero means that the nominal closed-loop system is unstable. The estimated plant models at six selected working points and their stabilities are listed in Table 2. The engine speed and the engine load in the first two columns were used to define the working point. The FOPDT models are listed in the third column. The absolute stability of the corresponding model is listed in the fourth column. The first crossover frequency and corresponding stability margin are given in the last two columns. The results indicate that the absolute stability changed from stable to unstable as the engine speed and load were increased. The
The PID controller has been the heart of engineering control practices for seven decades. However, implementation of control, in particular, how to tune the controller, remains an active research area. The great majority of PID tuning rules assume that an FOPDT model of the process is available. Many tuning rules have been put forward based on the FOPDT model (Aidan, 2006). However, their application to engine control has not been reported. In this study, the FOPDT plant models at different working points were estimated based on the results in the previous section. The parameters of the corresponding PID controller were tuned according to the system-identification results in the Matlab environment. Zhuang and Atherton proposed a PID controller-tuning rule based on the integral squared time-weighted error (ISTE) criterion for the FOPDT model (Zhuang and Atherton, 1993; Xue ., 2007); that method was adopted in this research. The crossover frequency ω and the corresponding ultimate gain were computed based on the FOPDT model. The critical time was calculated as = 2π/ ω . The set-point type of the PID controller was calculated as: et al
cg
kc
Tc
cg
Kp Ti Td
= 0.509 = 0.051(3.302κ+1) = 0.125 Kc
where κ = is the normalized gain. The results at 2,200 r/ min and 45% load according to Equation 4 determined as = 0.1357 V / kPa, = 0.9651 s, and = 0.1204 s. The performance of the controller at the above working KKc
Kp
Table 2. Identified FOPDT models at different working points. Speed(r/min) Load (%) FOPDT Model Absolite stabilty 3.571 ----------------------1,000 24 1 1.814s + 1e 4.768 ----------------------1,000 66 1 1.905s + 1e 1.0858 -------------------------1,600 20 1 1.0332s + 1e 20.83 ----------------------1,600 73 0 1.095s + 1e 21.1887 e -------------------2,200 45 0 0.82 s+1 25.347 ----------------------2,200 72 0 1.148s + 1e –0.2886 s
–0.225 s
–0.426 s
–0.325 s
–0.268 s
–0.132 s
(4)
Tc
Tc
Ti
Td
Kc
ω (rad/s)
3.0332
5.7631
2.9241
7.2999
4.1137
4.2134
0.2854
5.3517
0.2666
6.5252
0.5661
12.461
cg
178
H. G. ZHANG
.
et al
Figure 9. Simulation model for the time-domain performance analysis at 2,200 r/min and 45% load. point was analyzed in the time domain. The simulation model, including the controller and the plant model, was elaborated in the Matlab/Simulink environment, as shown in Figure 9. The signal u is the target boosting pressure. Here, it is a step-stimulation signal with the same shape as shown in Figure 4. The signal y is the real boosting pressure output by the FOPDT model. The signal d is the disturbance, as presented in Figure 10. The configuration parameters in Matlab/Simulink are shown in Figure 11. The output of the simulation is shown in Figure 12; here, the blue line is the input of u, the black line is the output of y when the disturbance input is off and the red dashed lines show the 5% limit for the settling time. The results reveal that the settling time to within 5% of the final value was less than 1.2 s and the percent overshoot was about 20%. The magenta line is the data with disturbance, showing a very similar outcome as long as the white-noise disturbance does not exceed ±0.1 V. The tuned PID controller had a good time response. The settling time was enhanced from 2 s, as shown in Figure 4, to 1.14 s. The stability of the above-defined PID controller was then analyzed in the frequency domain. The open-loop logmagnitude-phase diagram (Bode diagram) is shown in Figure 13; the red line is the plant model G(s) plot, the blue line is the PID controller Gc(s) plot and the black line is the open-loop plot of the feedback system Gc(s)G(s). The red line shows that the plant model is unstable according to the Nyquist stability criterion but the feedback system of Gc(s)G(s) is stable. The relative stability can also be analyzed by the phase margin in the open-loop Bode diagram. The phase margin was computed as 64.78 degrees at 3.17 rad/s. It is generally found that gain margins of three or more combined with phase margins between 30 and 60 degrees result in reasonable tradeoffs between bandwidth and stability. In addition, if the second-order approximation is used, the damping ratio is
0.648 according to the approximation relationship: ζ = 0.01φm (Richard and Robert, 2001). Therefore, the percent overshoot can be evaluated as: σ = e–ζπ ⁄
1–ζ
2
× 100%
Figure 10. White-noise disturbance signal.
Figure 11. Parameters configuration in simulink.
(5)
MODEL-BASED DESIGN OF A VARIABLE NOZZLE TURBOCHARGER CONTROLLER
179
Table 3. Parameters of the PID controllers and their timedomain performances. Speed Load Kp (r/min) (%) (V/kPa) Ti (s) Td (s) Ts (s) σ (%) 1,000 24 1.5439 2.0443 0.1363 0.81 8 1,000 66 1.4884 2.0648 0.1076 0.66 10 1,600 20 2.0939 1.1978 0.1864 1.26 9 1,600 73 0.1453 1.2353 0.1468 1.35 19 2,200 45 0.1357 0.9651 0.1204 1.14 20 2,200 72 0.2881 1.2442 0.063 0.47 21
Figure 12. Simulation results with and without disturbance input. and the calculated percent overshoot is 7%, which is also less than the allowed value. Table 3 lists the tuning results according to the FOPDT models in Table 2. Kp, Ti and Td at each working point were tuned based on Equation 4. The settling time and the percent overshoot of each point were also computed using the simulation model in Figure 9. The results indicate that the time-domain performance of the controllers was good and within our desired limiting values.
5. WP10 ENGINE VALIDATION TESTS The maps for the gain-scheduled PID controller were constructed based on the method presented in Sections 3 and 4. There were only six points included in Tables 2 and 3. However, more appropriate working points had to be selected
Figure 13. Open-loop Bode diagram of the results at 2,200 r/min and 45% load.
at each calibrated engine-speed line. Because the identified working points were not situated only at the nodes of the maps, interpolation processes were employed to calculate the values for the maps, and the refined calibration of the calculation results was then performed. The control strategy was realized in the control software. The entire system including the WP10 engine and the VNT control module was verified on the engine test bench shown in Figure 14. First, the dynamometer was configured for the constant-speed control mode. The accelerator pedal was regulated from the minimum position to the maximum position. The relevant data were collected by the calibration tool. The results at 2,200 r/min are presented in Figure 15: (a) is the engine speed variation curve during testing; (b) is the accelerator pedal position variation curve; (c) are the VNT control values denoted by voltages; (d) are the variation curves of the real boosting pressure and the target boosting pressure. In addition, Figure 16 shows the results at 1,400 r/min. Subsequently, the dynamometer was configured for the constant-torque control mode. The accelerator pedal was regulated from the minimum position to the maximum position. The corresponding data were measured. The results at 700 Nm and 600 Nm are displayed in Figures 17 and 18, respectively. The results indicate that the real boosting pressure followed the target boosting pressure very well when the accelerator pedal was adjusted. While the engine was operating at high speed, the VNT control value was relatively smaller. Thus, the open area of the VNT vanes was larger than
Figure 14. Validation of the VNT control system with WP10 diesel engine.
180
H. G. ZHANG
.
et al
Figure 15. Results of speed control mode at 2,200 r/min. at low speed. 6. CONCLUSIONS
The application of VNT to a diesel engine can improve the power output performance and reduce emissions. The demonstrated dynamic response indicates that the VNT is suitable for a heavy-duty diesel engine. The main research results reported herein are as follows. First, the VNT control system was successfully developed according to the design strategy, which consisted of a feedforward controller and a gain-scheduled feedback PID controller. Second, the FOPDT plant models were estimated at different work points. The results indicated that the absolute stability changes from stable to unstable as the engine speed
Figure 16. Results of speed control mode at 1,400 r/min. and the engine load are increased. The crossover frequency increases as the engine load rises when the engine speed is stable. The corresponding gain margin decreases at low and moderate engine speeds but increases at high engine speed. Third, the parameters of the PID controller were tuned according to ISTE criteria. The time-domain performance and the frequency-domain stability were analyzed. The results indicated that the setting time and the percent overshoot satisfied the requirements for the VNT controller. Finally, the complete control system was verified on the engine test bench with transient-state tests. The results indicated that the boosting pressure control could be achieved under both steady
MODEL-BASED DESIGN OF A VARIABLE NOZZLE TURBOCHARGER CONTROLLER
181
Figure 17. Results of torque control mode at 700 Nm.
Figure 18. Results of torque control mode at 600 Nm.
states and transient states for the designed VNT control system. The real boosting pressure traced the target boosting pressure very well. Accordingly, the results indicate that a model-based design method for a VNT control system is feasible and convenient.
A. H. (2003). Model-based control of the VGT and EGR in a turbocharged common-rail diesel engine: Theory and passenger car implementation. SAE Paper No. 200301-0357. Antonio, V. (2006). Practical PID Control. Springer. London. 165−172. Baratta, M., Spessa, E. and Mairone, P. (2010). Numerical investigation of turbolag reduction in HD CNG engines by means of exhaust valve variable actuation and spark timing control. Int. J. Automotive Technology , , 289− 306. Elbert, H. and Spencer, C. S. (1990). Mean value modeling
REFERENCES Aidan, O. (2006). Handbook of PI and PID Controller Tuning Rules. 2nd Edn. Imperial College Press. London. 154−235. Ammann, M., Fekete, N. P., Guzzella, L. and Glattfelder,
11 3
182
H. G. ZHANG
of spark ignition engines. SAE Paper No. 900616. Fang, C. Z. and Xiao, D. Y. (2002). Process Identification. Tsinghua University Press. Beijing. 84−132. Haugen, F. (2004). PID Control. Tapir Academic Press. Trondheim. 124−175. He, Y. S., Lin, C. C. and Anupam, G. (2006). Integrated simulation of the engine and control system of a turbocharged diesel engine. SAE Paper No. 2006-010439. Jensen, J. P., Kristensen, A. F., Spencer, C. S., Houbak, N. and Elbert, H. (1991). Mean value modeling of a small turbocharged diesel engine. SAE Paper No. 910070. Lennart, L. (1999). System Identification : Theory for the User. 2nd Edn. Prentice Hall PTR. New Jersey. 399− 538. Lennart, L. (2008). System Identification ToolboxTM 7 User’s Guide. Mathworks Co. Ltd. Ogawa, H., Hayash, M. and Yashiro, M. (1998). Development of the continuous and feedback controlled variable nozzle turbine turbocharger system for heavy-duty trucks (In Chinese). Vehicle Engine, , 9−15. 1
.
et al
Riccardo, B., Alessandro, C., Enrico, L. and Alberto, P. (1997). DI diesel engine with variable geometry turbocharger (VGT): A model based boosting pressure control strategy. Meccanica, , 409−421. Richard, C. D. and Robert, H. B. (2001). Modern Control Systems. 9th Edn. Prentice Hall. New Jersey. 406-519. Steve, A., Mark, G., Shahed, S. M. and Kevin, S. (2002). Advanced variable geometry turbocharger for diesel engine applications. SAE Paper No. 2002-01-0161. Sung, S. W., Lee, J. and Lee, I.-B. (2009). Process Identification and PID Control. Wiley. Singapore. 151− 316. Takashi, S., Hiroyuki, I. and Hiromichi, M. (2001).Study of strategy for model-based cooperative control of EGR and VGT in a diesel engine. JSAE Review, , 3−8. Xue, D. Y., Chen,Y. Q. and Atherton, D. P. (2007). Linear Feedback Control: Analysis and Design with MATLAB. SIAM Press. Philadelphia. 181−230. Zhuang, M. and Atherton, D. P. (1993). Automatic tuning of optimum PID controllers. Proc. IEE, Part D, , , 216−224. 32
22
140
3
Reproduced with permission of the copyright owner. Further reproduction prohibited without permission.