Model-based Parameter Recovery from. Uncalibrated Optical Images. S. J. Preece1, I. B. Styles2, S. D. Cotton1, E. Claridge2, and A. Calcagni2,3. 1 Astron ...
Model-based Parameter Recovery from Uncalibrated Optical Images S. J. Preece1 , I. B. Styles2 , S. D. Cotton1 , E. Claridge2 , and A. Calcagni2,3 1
2
Astron Clinica, The Mount, Toft, Cambridge CB3 7RL, UK School of Computer Science, University of Birmingham, Birmingham B15 2TT, UK 3 Birmingham and Midland Eye Centre, City Hospital NHS Trust, Dudley Road, Birmingham B17 7QU, UK
Abstract. We propose a novel method for quantitative interpretation of uncalibrated optical images which is derived explicitly from an analysis of the image formation model. Parameters characterising the tissue are recovered from images acquired using filters optimised to minimise the error. Preliminary results are shown for the skin, where the technique was successfully applied to aid the diagnosis and interpretation of nonmelanocytic skin cancers and acne; and for the more challenging ocular fundus, for mapping of the pigment xanthophyll.
1
Introduction
Optical imaging methods have recently assumed a much more important role in medicine: light is non-ionising and relatively safe; and increasingly powerful computers make it possible to implement detailed models of image formation. These can provide principled means of relating image values to physical properties of the tissues being imaged. A common problem is the interpretation of images taken under conditions of varying illumination. The magnitude of light reaching the detector depends on many factors not related to tissue properties, including the magnitude, direction and spectral composition of the incident light; the object geometry; the presence of other objects in the scene, etc. In some cases these factors can be controlled and compensated for by calibrating against objects with known reflectance, but this is impossible in many cases. We show how a physical model of image formation can be used to derive quantitative properties of tissue from uncalibrated optical images. Earlier work [1, 2] has laid down the foundations for a physics-based image interpretation method capable of deriving quantitative parameters characterising tissue histology from in vivo multi-spectral images. The method was first applied to skin imaging, and shown to be successful in the early detection of melanoma [1, 3]. Although the principles of that work are generic, many human tissues present major additional challenges in comparison to the skin. The existing approach assumes that the absolute reflectance of the tissue can be deduced from a simple measurement. This is usually accomplished by placing an object of known reflectance (a “standard”) alongside the tissue, but this
is inappropriate where the image is of a non-planar object; the illumination is spatially non-uniform; or when the tissue under investigation cannot be accessed in order to place the standard. We have developed a method for compensating for spatial variations in illumination and geometry in an image. The method does not require any form of reflectance standard to be used and is quite general. We provide objective criteria which ensure that parameter recovery from such uncalibrated images is both unique and of sufficient accuracy.
2
Compensating for geometric variations in illumination
The proposed technique is based upon an analysis of the imaging process. When capturing an image on a CCD-based device, using a filter with transmittance Fn (λ) at wavelength λ, the signal recorded at position x is Z in (x) = C I0 (λ, x)R(λ, x)Fn (λ)Q(λ)dλ, (1) Λ
where Q(λ) is the quantum efficiency of the CCD, I0 (λ, x) defines the illuminant, and R(λ, x) is the reflectance of the tissue. The constant C scales the signal onto the range of the detector and is determined by factory calibration. We have assumed that Fn (λ) and Q(λ) are spatially uniform. Clearly the reflectance of the tissue varies with position as its composition changes, and the intensity of illumination can also vary spatially due to surface irregularities, beam edge effects or surface curvature. We can generally assume all variations in system geometry can be included in I0 (λ, x), and that these variations are independent of wavelength in diffuse imaging. We can therefore write I0 (λ, x) = A(x)S(λ), a product of spatial A(x) and spectral S(λ) terms. The geometric properties of the system are then contained solely in A(x). Substituting for I0 in Eqn. (1), and noting that A(x) does not depend on λ we obtain Z in (x) = CA(x) S(λ)R(λ, x)Fn (λ)Q(λ)dλ. (2) Λ
All geometric information is contained in the pre-factor to the integral. We may therefore eliminate system geometry by considering quantities qmn (x) = im (x)/in (x), the so-called image quotients. In the next section we will define objective criteria for the selection of image quotients, and show how they can be used to recover tissue parameters from appropriate images.
3
Modelling of Uncalibrated Imaging
In Ref. [2], Preece and Claridge described the process of image formation as a sequence of mappings. They assumed that the optical properties of tissue can be described by a vector of K parameters p = {pk }k=1...K , p ∈ P, where P is the space of all possible parameter vectors for a given tissue type. The first stage in the imaging process is the formation of the reflectance spectrum of the
tissue: r = r(λ), r ∈ R, where R is the space of all possible reflectance spectra. We define a mapping a : P 7→ R describing the relationship between tissue parameters and spectral reflectance. This mapping can be realised using Monte Carlo simulation [4]. Optical imaging devices typically acquire images by filtering the remitted spectra to generate a single image value per filter. For N filters {Fn (λ)}n=1...N , an image vector i = {in }n=1...N , i ∈ I is recorded, where I is the space of all possible image vectors for a given tissue. This is represented by a mapping b : R 7→ I, defined by Eqn. (2). We now introduce an additional step. Given an N -component image vector, we can form an (N − 1)-component vector of independent image quotients, q = {qm }m=1...N −1 = {im /iN }m=1...N −1 , q ∈ Q. The image quotients are independent of surface and illumination geometry, and remove the need for calibration. We represent this final stage as a mapping c : I 7→ Q. The process of forming image quotients is then the composite function f = a ◦ b ◦ c : P 7→ Q, relating the composition of the object described by a parameter vector p to image quotients q formed from an image captured by a set of optical filters {Fn (λ)}n=1...N . We can now, in principle, construct an inverse mapping f −1 : Q 7→ P which allows us, given a vector of image quotients q, to deduce the vector of parameters p that describes the tissue at the point of interest. There are two important criteria which f and f −1 should meet: f should be a unique, one-to-one (bijective) mapping between points in P and points in Q; and when applied to a vector q, f −1 should compute the corresponding parameter vector p with sufficient accuracy. Preece and Claridge [2] established objective criteria to ensure that these conditions are met, and our analysis is similar. We assume that the spectrum of the illuminating source S(λ) and the quantum efficiency of the detector Q(λ) are known, and that we have control over the filters {Fn (λ)} used to acquire the image. We first check whether f is bijective using the criteria defined in Sect. 3.1. Sets of filters which do not meet this requirement are discarded. We then use an evolutionary algorithm [5] to select {Fn (λ)} such that they minimise the mean error with which parameters can be computed from image quotients. This is described in Sect. 3.2. 3.1
Uniqueness of the Mapping
To determine the uniqueness of the forward mapping f , we compute the Jacobi matrix J with components Jij = ∂qi /∂pj at each point at which the model is defined. We then compute the Jacobian J = det(J), and test the sign of J at all points in P . The mapping f is bijective if J is found to be of constant sign (and non-zero) throughout P. An important consequence of this is that the number of image quotients must equal the number of object parameters, N − 1 = K. 3.2
Minimisation of Error in f −1
Minimisation of error is essential in medical image analysis. The accuracy of a clinician’s diagnosis depends on the quality of information that analysis of an
image provides. We have identified three main sources of error: errors in f ; errors in the imaging process; and errors in the construction of f −1 . Errors in f can arise from several sources. The data used to characterise the tissue may not be known accurately; the characteristics of the imaging equipment may not be known exactly; and the model of tissue reflectance may not be deterministic. The main source of error in the imaging process is thermal noise in the CCD. This leads to a small error in the image values recorded by the camera, and hence in the recorded image quotients. Finally, f −1 cannot generally be computed exactly and an approximation is necessary (see Sect. 3.3). Each of these errors reduces the accuracy of the recovered tissue parameters. It is a simple exercise in error propagation to compute the error which which parameters can be recovered, given these known sources of uncertainty. The resulting measure of error is a function of the set of filters chosen, and is used in the optimisation process to determine optimal filters for the problem. 3.3
Construction of the Inverse Function
When processing an image using these ideas, an explicit implementation of f −1 will be required, but in general, we cannot compute f −1 directly. The forward model f is defined only at a finite number of points in P, and there are a finite number of points in Q. A natural approach to the construction of f −1 is to fit a multi-dimensional surface to the data, but both f and f −1 are often highly nonlinear, and finding an appropriate functional form for the surface is very hard. For the two-dimensional model of skin discussed in Sect. 4, a standard surface fitting algorithm provided good results, but models with higher dimensionality have proven to be much more difficult. In these cases, acceptable theoretical results have been obtained using a neural network.
4
Application: Non-Contact Skin Imaging
The original parameter recovery method developed for skin imaging by Cotton and Claridge [1] requires calibrated, illumination-invariant image data. This is fairly simple to achieve for small areas of the skin by contact photography, but larger, curved or uneven surfaces cannot be imaged in this way. We have implemented a system for uncalibrated non-contact imaging of the skin and have carried out a preliminary evaluation for a number of medical conditions including non-melanocytic skin cancers and acne. For practical reasons we have based the system on an off-the-shelf digital camera which involved making small departures from the generic interpretation scheme described above. An accurate optical model of the skin requires three parameters: concentration of epidermal melanin, concentration of dermal blood and thickness of the dermal layer [6]. Appropriate ranges for each of these parameters were taken from Ref. [6]. For each parameter vector, the mapping a : P 7→ R was implemented using a Monte Carlo simulation. The standard RGB camera used provides only three filters {Fn (λ)} = {R, G, B}, allowing only two of the three
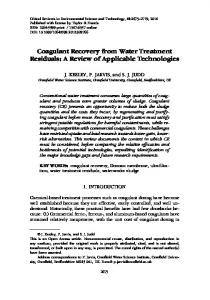
Fig. 1. First row: an infiltrative BCC, (a) colour image; (b) blood map; (c) melanin map. The lesion (dark arrow in (a)) shows increased vascularity and tortuous engorged vessels in (b). Two nearby lesions (seborrhoeic keratoses, marked by white arrows), show no increase in vasculature (b), and their pigment content contrasts with the nonpigmented BCC in (c). Second row: a moderately differentiated SCC: (a) colour image; (b) blood map; (c) melanin map. A nodular area (arrow in (a)) is highly vascular (arrow in (b)), possibly reflecting tumour activity. Low melanin values in (c) demonstrate the non-pigmented nature of this lesion.
parameters to be recovered. Blood and melanin were chosen because of their clinical importance, but also because of their significantly greater local variability in comparison with collagen. A constant value of collagen of 0.2mm was assumed [6]. The thickness of collagen does change the absolute magnitude of the reflectance spectrum, but has only a small effect on the relative magnitudes of the image quotients. Since {Fn (λ)} were predefined, the optimisation was reduced to selecting one of the R, G or B bands to play a role of the denominator in the image quotients, and testing whether the uniqueness of the mapping is preserved. The quotients B/R and G/R were found to give the best unique mapping. The correctness of this mapping was tested by comparison with the original method, which does require calibration. The imaging system uses a Cannon G5 Powershot digital camera capable of taking images ranging in size from half-body to 5mm patches. Illumination is provided by a ring flash mounted in the camera lens plane with a system of polarising filters to prevent flash artifacts. Images are taken under ambient illumination. Parametric maps are computed in ∼ 2 seconds on a standard PC. Two pilot studies described here investigate the pre-therapeutic characterisation of non-melanocytic skin lesions, and the objective assessment of severity of acne. Non-melanocytic skin cancers. Basal Cell Carcinoma (BCC) and Squamous Cell Carcinoma (SCC) are the most common forms of skin cancer. These can be difficult to differentiate from non-cancerous and non-invasive lesions. A noninvasive alternative to biopsy would reduce the likelihood of unnecessary surgery and patient trauma. In a pilot study 150 images of non-melanocytic skin lesions
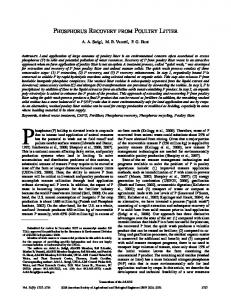
Fig. 2. Acne Lesions. (a) Colour photograph; (b) parametric map of blood; (c) extent of the lesions identified from (b) and overlaid on the original photograph.
were obtained and parametric maps of blood and melanin were examined by a dermatologist for diagnostically useful features. The tumour vascularity, clearly visible in the blood map shown in Fig. 1b (second row), was identified as a highly relevant sign of BCC. A combination of features in blood and melanin maps was useful in eliminating suspicious lesions as non-cancerous (Fig. 1, first row). An in-vivo examination of these histological, diagnostically relevant signs of cancer is at present not possible in any other way. Acne. In acne, bacteria caught in the skin pores causes an inflammatory skin reaction. The treatment depends on the severity and extent of the condition, however the assessment of these factors is highly subjective. In a small study involving 20 patients, clinical scores were compared with scores derived from parametric maps of the blood distribution. The ’extent’ score was computed as a percentage of skin with blood levels above the mean in the region of interest (outlined in Fig. 2c). The ’severity’ score of the inflammation was computed as the mean of the blood level values in the affected area. The correlation between clinical and computer-derived scores was R2 = 0.82 for the severity and R2 = 0.8 for the extent, indicating good agreement. It should be stressed that values recorded in the parametric maps correspond to real physical quantities. For example blood levels can be expressed in units of mmol/L. For this reason both, the ’extent’ and ’severity’ scores, are truly objective measures of inflammation which can be compared over time or over a population of patients. At present there are no other methods, neither clinical, nor photographic, capable of such objective assessment.
5
Application: Ocular Fundus Imaging
Age-related macular degeneration (ARMD) causes irreversible sight loss in elderly patients. Early identification may facilitate preventative treatments, but at present there are no objective screening methods. The pigment xanthophyll is thought to play a protective role in ARMD and decreasing levels may indicate the onset of the disease. Quantitative estimates of the pigment level may be of considerable clinical value. This section describes work in progress on quantitative interpretation of fundus images.
Fig. 3. (a) Projection of the model (black points) and image (gray points) onto the q1 q2 subspaces, where q1 = i(507nm)/i(611nm), q2 = i(525nm)/i(611nm). (b) A sample fundus image in the band centred at 507nm. (c) Distribution of xanthophyll in a healthy human subject recovered from fundus images.
The model of fundus reflectance is described by five parameters: RPE melanin, choroidal blood, choroidal melanin, xanthophyll and retinal blood, based on the model proposed by Preece and Claridge [7]. Other properties of the tissue were assumed to be constant. The parameters were discretised within their respective ranges and tissue reflectance for each parameter vector was computed using a Monte Carlo simulation. The recovery of five parameters requires six images, and the optimisation procedure found that the best unique mapping was provided by filters with central wavelengths 507nm, 525nm, 552nm, 585nm, 596nm with the filter used in the denominator of the image quotients located at 611nm. Xanthophyll absorbs light at λ < 534nm, and it is possible to recover its distribution using the quotients at 507nm, 525nm and 552nm. Fig. 3a shows an example of the relationship between the model vectors and image quotient vectors in a projected view. Images from twelve normal subjects were taken using a standard fundus camera coupled to a Retiga EXi monochrome camera and a VariSpec programmable LCD filter. The VariSpec filter was programmed to implement the selected filters. When applied to a normal subject, the inverse mapping yields the distribution of xanthophyll shown in Fig. 3c. The pigment level shows a significant increase near the fovea, which is in agreement with the accepted distribution [8]. Areas showing no xanthophyll include the optic disk, which is not modelled in the current implementation, and large veins, which obscure the underlying tissue. Values of xanthophyll range from zero (in the black regions) to 0.6 mmol/L in the white regions. To our knowledge this is the first time that the distribution of a single ocular pigment has been deduced by digital imaging and computer modelling. These results are very encouraging and work is in progress to produce parametric maps showing the distribution of the remaining model parameters.
6
Discussion and Conclusions
We have developed a generic method for quantitative interpretation of optical images. The method uses image quotients to effectively normalise the intensity
of illumination, allowing objects with complex geometries and/or large areas to be interpreted. This is similar to ”discounting the illuminant”, a process used to normalise pixel values prior to image segmentation and classification [9, 10]. In this paper we have shown for the first time that it is possible to carry out quantitative analysis of tissue composition from uncalibrated images. This is a far more ambitious and difficult task than classification, and the merits of quantitative image interpretation methods in medical imaging are well recognised. A clinically important practical advantage of our method is that it does not require the use of calibration patches and can be used for non-contact imaging. This is vital when studying, for example, large burns, where the area of interest is likely to be highly sensitive to the touch and prone to infections. The theoretical bases and computational methodology of our method are truly generic. We have demonstrated their successful application to aid the diagnosis and interpretation of several skin conditions and to compute the distribution of the pigment xanthophyll in the ocular fundus. The same method has also been applied to problems in x-ray astronomy [11], and fluorescein imaging of cancer cells [12] . We anticipate that in the future this work will yield much insight into the optical imaging of biological tissues in general, and that it will lead to the development of clinically useful systems.
References 1. Cotton, S.D., Claridge, E., Hall, P.N.: Noninvasive skin imaging. In: Information Processing in Medical Imaging (LNCS1230). (1997) 501–507 2. Preece, S.J., Claridge, E.: Spectral filter optimisation for the recovery of parameters which describe human skin. IEEE Trans. PAMI 26 (2004) 913–922 3. Moncrieff, M., Cotton, S., Claridge, E., Hall, P.: Spectrophotometric intracutaneous analysis - a new technique for imaging pigmented skin lesions. British Journal of Dermatology 146 (2002) 448–457 4. Prahl, S.A., Keijzer, M., Jacques, S.L., Welch, A.J.: A monte carlo model of light propagation in tissue. SPIE Insitute Series IS 5 (1989) 102–111 5. Yao, X., Liu, Y.: Fast evolution strategies. Control and Cyb. 26 (1997) 467–496 6. Anderson, R., Parrish, J.A.: The optics of human skin. J. Invest. Dermatol. 77 (1981) 13–19 7. Preece, S.J., Claridge, E.: Monte carlo modelling of the spectral reflectance of the human eye. Phys. Med. Biol. 47 (2002) 2863–2877 8. Hammer, M., Schweitzer, D.: Quantitative reflection spectroscopy at the human ocular fundus. Phys. Med. Biol. 47 (2002) 179–191 9. Healey, G.: Using colour for geometry-insensitive segmentation. J. Opt. Soc. Am. A 6 (1989) 920–937 10. Maloney, L., Wandell, B.: Color constancy: a method for recovering surface spectral reflectance. J. Opt. Soc. Am. A 3 (1986) 29–33 11. O’Dwyer, M., Claridge, E., Ponman, T., Raychaudhury, S.: Mapping the physical properties of cosmic hot gas with hyper-spectral imaging. In: Proceeding of the Seventh IEEE Workshop on the Applications of Computer Vision. (2005) 185–190 12. Claridge, E.: Optimal filter selection for quantitative interpretation of fluorescence microscopy images. Technical Report CSR-05-02, University of Birmingham, School of Computer Science (2005)