may have severe consequences ranging from loss of business opportunities, physical ... scribes our model-driven process for assessing and refining use cases.
Model-Driven Assessment of Use Cases for Dependable Systems Sadaf Mustafiz, Ximeng Sun, J¨org Kienzle, Hans Vangheluwe School of Computer Science, McGill University Montreal, Quebec, Canada {sadaf, xsun16, joerg, hv} @cs.mcgill.ca
Abstract. Complex real-time systems need to address dependability requirements early on in the development process. This paper presents a model-based approach that allows developers to analyze the dependability of use cases and to discover more reliable and safe ways of designing the interactions with the system and the environment. We use a probabilistic extension of statecharts to model the system requirements. The model is then evaluated analytically based on the success and failure probabilities of events. The analysis may lead to further refinement of the use cases by introducing detection and recovery measures to ensure dependable system interaction. A visual modelling environment for our extended statecharts formalism supporting automatic probability analysis has been implemented in AToM3 , A Tool for Multi-formalism and Meta-Modelling. Our approach is illustrated with an elevator control system case study.
1 Introduction Complex computer systems are increasingly built for highly critical tasks from military and aerospace domains to industrial and commercial areas. Failures of such systems may have severe consequences ranging from loss of business opportunities, physical damage, to loss of human lives. Systems with such responsibilities should be highly dependable. On the software developer’s part, this involves acknowledging that many exceptional situations may arise during the execution of an application, and providing measures to handle such situations to maintain system reliability and safety. Any such exception that is not identified during requirements elicitation might potentially lead to an incomplete system specification during analysis, and ultimately to an implementation that behaves in an unreliable way. Rigorous requirements elicitation methods such as the exceptional use case approach we proposed in [1] lead the analyst to define handler use cases that address exceptional situations that threaten system reliability and safety. These handler use cases allow exceptional interactions that require several steps of handling to be described separately from the normal system behavior. But is it enough to only define handlers for exceptions that can interrupt the normal system functionality? What about exceptions that interrupt the handlers themselves? Do we need handlers for handlers? To answer this question there must be a way to assess the reliability and safety of a system. For this purpose, this paper proposes a model-driven approach for assessing and refining use cases to ensure that the specified functionality meets the dependability
requirements of the system. To carry out the analysis, the use cases are mapped to DACharts, a probabilistic extension of part of the statecharts formalism. The assessment is then based on a tool that performs probability analysis of the model. The paper is organized as follows: Section 2 provides background information on dependability, use cases, and the exceptional use cases approach in [1]. Section 3 describes our model-driven process for assessing and refining use cases. Section 4 presents our probabilistic statecharts formalism used for dependability analysis. Tool support for our formalism is discussed in Sect. 5. Section 6 illustrates our proposed process by means of an elevator control case study. Section 7 presents related work in this area and Sect. 8 discusses future work and draws some conclusions.
2 Background 2.1 Dependability Dependability [2] is that property of a computer system such that reliance can justifiably be placed on the service it delivers. It involves satisfying several requirements: availability, reliability, safety, maintainability, confidentiality, and integrity. The dependability requirement varies with the target application, since a constraint can be essential for one environment and not so much for others. In this paper, we focus on the reliability and safety attributes of dependability. The reliability of a system measures its aptitude to provide service and remain operating as long as required [3]. The safety of a system is determined by the lack of catastrophic failures it undergoes [3]. Fault tolerance is a means of achieving system dependability. As defined in [4], fault tolerance includes error detection and system recovery. At the use case level, error detection involves detection of exceptional situations by means of secondary actors such as sensors and time-outs. Recovery at the use case level involves describing the interactions with the environment that are needed to continue to deliver the current service, or to offer a degraded service, or to take actions that prevent a catastrophe. The former two recovery actions increase reliability, whereas the latter ensures safety. 2.2 Use Cases Use cases are a widely used formalism for discovering and recording behavioral requirements of software systems [5]. A use case describes, without revealing the details of the system’s internal workings, the system’s responsibilities and its interactions with its environment as it performs work in serving one or more requests that, if successfully completed, satisfy a goal of a particular stakeholder. The external entities in the environment that interact with the system are called actors. Use cases are stories of actors using a system to meet goals. The actor that wants to achieve the goal is referred to as the primary actor. Entities that the system needs to fulfill the goal are called secondary actors. Secondary actors include software or hardware that is out of our control. The system, on the other hand, is the software that we are developing and which is under our control. 2.3 Exceptions and Handlers in Use Cases In [1] we proposed an approach that extends traditional use case driven requirements elicitation, leading the analyst to focus on all possible exceptional situations that can interrupt normal system interaction.
An exception occurrence endangers the completion of the actor’s goal, suspending the normal interaction temporarily or for good. To guarantee reliable service or ensure safety, special interaction with the environment might be necessary. These handling actions can be described in a handler use case. That way, from the very beginning, exceptional interaction and behavior is clearly identified and separated from the normal behavior of the system. Similar to standard use cases, handlers use cases are reusable. Handlers can be defined for handlers in order to specify actions to be taken when an exception is raised in a handler itself.
3 Model-Driven Dependability Analysis of Use Cases We propose a model-driven approach for assessing and refining use cases to ensure that the specified functionality meets the dependability requirements of the system as defined by the stakeholders. For the purpose of analysis, we introduce probabilities in use cases. The value associated to each interaction step represents the probability with which the step succeeds. If we assume reliable communication and a perfect software (which we must at the requirements level), the success and failure of each interaction depends on the quality of the hardware device, e.g. motor, sensor, etc. The reliability of each hardware component can be obtained from the manufacturer. If the secondary actor is a software system, its reliability is also either known or must be determined statistically. Our proposed process is illustrated in Fig. 1. First, the analyst starts off with standard use case-driven requirements elicitation (see step 1). Using the exceptional use case approach described in [1] the analyst discovers exceptional situations, adds detection hardware to the system if needed, and refines the use cases (see step 2). Then, each use case step that represents an interaction with a secondary actor is annotated with a probability value that specifies the chances of success of the interaction (see step 3). Additionally, each interaction step is annotated with a safety tag if the failure of that step threatens the safety of the system. Next, each use case is mapped to a DA-Chart (see step 4). DA-Charts and the mapping process are described in Sect. 4. This mapping could be automated (see Sect. 8), but for now it has to be done manually. The DA-Charts are then mathematically analyzed by our dependability assessment tool (see step 5) and a report is produced. Steps 3, 4, and 5 are the main contributions of this paper. The implementation of the tool using meta-modeling is described in Sect. 5. The assessment report allows the analyst to decide if the current system specification achieves the desired reliability and safety. If not, several options can be investigated. It is possible to increase the reliability of secondary actors by, for instance, buying more reliable hardware components, or employing redundant hardware and voting techniques. Alternatively, the use cases have to be revisited and refined. First, the system must be capable of detecting the exceptional situation. This might require the use of time-outs, or even the addition of detection hardware to the system. Then, handler use cases must be defined that compensate for the failure of the actor, or bring the system to a safe halt. The analyst can perform the refinements in the annotated use cases or on the DA-Charts. After the changes, the effects on the system reliability and safety are determined by re-running the probabilistic analysis. The refinement process is repeated until the stakeholders are satisfied.
Fig. 1. Model-Driven Process for Assessment and Refinement of Use Cases
Elevator System Case Study. We demonstrate our approach by applying it to an elevator control system case study. An elevator system is a hard real-time application requiring high levels of dependability. For the sake of simplicity, there is only one elevator cabin that travels between the floors. The job of the development team is to decide on the required hardware, and to implement the elevator control software that processes the user requests and coordinates the different hardware devices. Initially, only “mandatory” elevator hardware has been added to the system: a motor to go up, go down or stop; a cabin door that opens and closes; floor sensors that detect when the cabin is approaching a floor; two buttons on each floor to call the elevator; and a series of buttons inside the elevator cabin. Standard use case-driven requirements elicitation applied to the elevator control system results in the use case model shown in Fig. 2. In the elevator system there is initially only one primary actor, the User. A user has only one goal with the system: to take the elevator to go to a destination floor. The primary actor (User) is the one that initiates the TakeLift use case. All secondary actors (the Door, the Motor, the Exterior and Interior Floor Buttons, as well as the Floor Sensors) that collaborate to provide the user goal are also depicted. Due to space constraints, we only discuss the subfunction level use case ElevatorArrival (shown in Fig. 3) in detail. To ride the elevator the User enters the cabin, selects a destination floor, waits until the cabin arrives at the destination floor and finally exits the elevator.
Fig. 2. Standard Elevator Use Case Diagram
Use Case: ElevatorArrival Primary Actor: N/A Intention: System wants to move the elevator to the User’s destination floor. Level: Subfunction Main Success Scenario: 1. System asks motor to start moving in the direction of the destination floor. 2. System detects elevator is approaching destination floor. 3. System requests motor to stop. 4. System opens door. Fig. 3. ElevatorArrival Use Case
CallElevator and RideElevator both include the ElevatorArrival use case shown in Fig. 3. It is a subfunction level use case that describes how the system directs the elevator to a specific floor: once the system detects that the elevator is approaching the destination floor, it requests the motor to stop and opens the door. The analysis of the basic use case following the approach in [1] lead to the discovery of some critical exceptions that interrupt the normal elevator arrival processing: MissedFloor, MotorFailure and DoorStuckClosed.
4 Probabilistic Statecharts In this section, we introduce DA-Charts (short for Dependability Assessment Charts), a probabilistic extension of the statecharts formalism introduced by David Harel [6]. 4.1 Statecharts The statecharts formalism is an extension of Deterministic Finite State Automata with hierarchy, orthogonality and broadcast communication [7]. It is a popular formalism for the modelling of the behaviour of reactive systems. It has an intuitive yet rigourously defined notation and semantics. It is the basis for documentation, analysis, simulation, and code synthesis. Many variants of statecharts exist, including the one included in the UML standard. 4.2 Extending Statecharts with Probabilities We extend the statecharts formalism with probabilities to enable dependability assessment. While stochastic petri nets is an established formalism with clearly defined semantics, statecharts seem a more natural match for our domain. This, thanks to their modularity, broadcast, and orthogonality features. Statecharts also make it possible to design visually simple and structured models. Standard statecharts are solely event-driven. State transitions occur if the associated event is triggered and any specified condition is satisfied. Given the event, a source state has only one possible target state. In the formalism we propose, DA-Charts, when an event is triggered, a state can transition to one of two possible target states: a success state and a failure state. When an event is triggered, the system moves to a success state with probability p and to a failure state with probability 1-p. In most real-time systems, the probability of ending up in a success state is closer to 1 and the failure
state probability is closer to 0. For example, if a motor in a mechanical system is asked to stop, it might stop with a probability of 0.999 and it might fail to stop with probability 0.001. As in statecharts, the transition may broadcast events. The event that is broadcast can be different depending on whether the transition leads to a success state or a failure state. Hence, the outcome of the event might vary. DA-Charts Syntax. The statecharts notation is extended to include probabilities. The standard transition is split into two transitions, each annotated with the probability that the event associated with the transition leads to a success state or a failed state. The notation used for this purpose adds an attribute next to the event: event[condition] {probability} /action. Absence of the probability attribute implies a probability of 1. DA-Charts Semantics. Finite State Automaton: Unlike statecharts, DA-Charts are non-deterministic due to the addition of probabilities in state transitions. Our formalism requires adaptation of the various features of the statecharts semantics to support the notion of non-determinism. In particular there is non-determinism in both the end states and in which events are broadcast. Orthogonality: In DA-Charts, orthogonal components model the concurrent behavior of actors in the environment. For example, in an elevator system, we might want to model the different hardware devices (motor/sensors) as orthogonal components. However, DA-Charts has the constraint that events cannot be triggered simultaneously in orthogonal components. Broadcast: The broadcasting feature is used in DA-Charts to enable sequencing of events. In a real-time system, the system progresses with time and some devices can only react provided that some required event preceded it. In the elevator system, the door should only be opened if the floor sensor detects that the destination floor has been reached. Depth: DA-Charts as described in this paper do not currently support hierarchy in components. However, we are currently working on allowing hierarchical states within the system component to reflect the user goal / sub-goal hierarchy (see Sect. 8). History: When external events or environmental hazards are considered in DACharts, history states would be useful when the system needs to return to a prior state after handling such a situation (see Sect. 8). A user inside an elevator might request an emergency stop but after servicing the request, the system might want to resume normal functionality. DA-Charts Constraints. Our DA-Chart formalism is constrained by the following: – Every DA-Chart must contain a system component describing the behaviour of the software of the system. No probabilities are allowed in the system component, since at the requirements level we assume a fault-free implementation. – Each secondary actor is modelled by an orthogonal component. Each service that an actor provides can either succeed or fail, which is modelled by two transitions leading to either a success or a failed state, annotated with the corresponding probabilities.
– To monitor the safety constraints of the system, an additional orthogonal safetystatus component is created. Whenever the failure of an actor leads to an unsafe condition, a toUnsafe event is broadcast to the safety-status component. Other quality constraints can be modelled in a similar manner. 4.3 Mapping Exceptional Use Cases to DA-Charts We assume that the system software and the communication channels between the system and the actors are reliable. During requirements elicitation, the developer can assume that the system itself, once it has been built, will always behave according to specification - in other words, it will not contain any faults, and will therefore never fail. As the development continues into design and implementation phases, this assumption is most certainly not realistic. Dependability assessment and fault forecasting techniques have to be used to estimate the reliability of the implemented system. If needed, fault tolerance mechanisms have to be built into the system to increase its dependability. Although the system is assumed to function perfectly, a reliable system cannot assume that it will operate in a fault free environment. Hence, at this point we need to consider the possible failure of (secondary) actors to perform the services requested by the system that affects the dependability of the system. Each use case is mapped to one DA-Chart. As mentioned above, the DA-Chart has one orthogonal system component that models the behavior of the system, one safetystatus component that records unsafe states, and one probabilistic orthogonal component for each secondary actor. Each step in the use case is mapped to a transition in the system component, as well as a transition in the actor involved in the step as follows: – An appropriately named event is created, e.g. floorDetected or stopMotor. – A step that describes an input sent by an actor A to the system is mapped to: • an action, e.g. floorDetected, on the success transition in the component modelling the reliability of A. The probability annotation p from the step is added to the success transition, the probability 1-p is added to the failure transition. • an event in the system that moves the system to the next state. – A step that describes an output sent by the system to an actor A is mapped to: • an action in the system, e.g. stopMotor, • an event within the component modelling the behavior of A, that leads to a success state and a failure state. Probability annotation p from the step is added to the success transition, the probability 1-p is added to the failure transition. – Each exception associated with the step is mapped to a failure action, e.g. motorFailure, and attached to the failure transition of the corresponding actor. – If a step is tagged as Safety-critical, the failure transition broadcasts an event toUnsafe which is recorded in the safety-status component.
5 Creating Tool Support for Probabilistic Statecharts 5.1 AToM3 : A Tool for Multiformalism and MetaModelling To allow rapid development of visual modelling tools, we use AToM 3 , A Tool for Multiformalism and Meta-Modelling [8, 9]. In AToM3 , we follow the maxim “model everything” (explicitly, in the most appropriate formalism). Formalisms and transformations
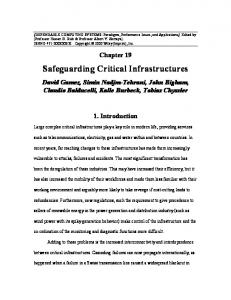
are modelled using meta-models and graph grammar models respectively. Also, composite types and the user interfaces of the generated tools are modelled explicitly. The tool has proven to be very powerful, allowing the meta-modelling of known formalisms such as Petri Nets [10]. More importantly, many new formalisms were constructed using the tool, such as the Traffic formalism [11]. 5.2 DA-Charts Implementation in AToM3 DA-Charts is a simple extension of the statechart syntax: a simple edge is extended by adding a probability attribute which becomes a P-Edge, so the action and the target depend on the outcome of a probabilistic experiment. A traditional edge can be seen as a P-Edge whose probability is 1. We implement tool support for DA-Charts by extending the meta-model of the DCharts formalism (a variant of Statecharts) described in [12]. This is done in three steps as follows. First, probability is added as a float attribute to the Hyperedge relationship of the existing DCharts meta-model (an Entity-Relationship diagram). The default value of probability is 1. Two constraints are added. One constraint allows users to only set the probability of a transition to a maximum of 1; the other one checks if the total probability of all transitions from the same source node and triggered by the same event is 1. AToM3 allows for the subsequent synthesis of a visual DA-Charts modelling environment from this meta-model. Second, a Probability Analysis (PA) module which can compute probabilities of reaching a target state is implemented. The algorithm is described in the next section. Lastly, a button which invokes the PA module is added to the visual modelling environment. The semantics of a DA-Chart are described informally as follows. When an event occurs, all P-Edges which are triggered by the event and whose guards hold are taken. The system then leaves the source node(s), chooses one of those P-Edges probabilistically, executes the action of the chosen P-Edge, and enters the target node(s). 5.3 Probability Analysis of DA-Charts in AToM3 Given a source state (consisting of a tuple of source nodes) and a target state, the probability to reach the target from the source is computed by finding all paths that lead from the source to the target state. The probability of each path is calculated as the product of all transition probabilities. The total probability is then computed by adding the probabilities of all paths. A probabilistic analysis algorithm based on the above observations has been implemented in AToM3 . It reads three arguments, model M containing all elements, such as components, nodes and edges, a tuple of node names of the source state S, and a tuple of node names of the target state T. It then produces a float value in the range [0, 1]. The details of the algorithm are omitted here for space reasons. An analyst wanting to compute, for instance, the reliability of the system has to first press the PA button, and then select the target state that symbolizes the successful completion of the goal, after which a pop-up dialog shows the result and all possible paths leading to the target state are highlighted in the model. Fig. 4 shows an example DA-Chart model in AToM3 . The model consists of three components: System, D1 and D2. The default state is (s5, s1, s8) and the only transition
Fig. 4. Example DA-Chart Model in AToM3
which can happen initially is the one from s1 to s2. The probability of reaching (s3, *) (“*” means we do not care about what other nodes are when the system ends in the state containing s3) from (s5, s1, s8) is 99.95% which is the combination of the probabilities along two possible paths: Ts1→s2 , Ts5→s6 , and Ts2→s3 for path one; Ts1→s2 , Ts5→s7 , Ts2→s4 , Ts8→s9 , and Ts4→s3 for path two. The computation performed can be mathematically defined as follows: Ptotal = (Ps2→s3 × Ps5→s6 + (Ps4→s3 × Ps8→s9) × Ps2→s4 × Ps5→s7) × Ps1→s2
(1)
6 Dependability Analysis Using Statecharts 6.1 Analyzing Exceptions in the Elevator Arrival Use Case We use the Elevator System case study to demonstrate our assessment approach. At this point, the standard use case has been already analyzed for exceptional situations that can arise while servicing a request. As discussed in Sect. 3, several failures might occur: the destination floor might not be detected (MissedFloor); the motor might fail (MotorFailure); or the door might not open at the floor (DoorStuckClosed). To detect whether the elevator is approaching a floor, we need to introduce a sensor, ApprFloorSensor. To detect a motor failure, an additional sensor, AtFloorSensor is added. It detects when the cabin stopped, and therefore when it is safe to open the doors. Fig. 5 shows the updated version of the ElevatorArrival use case that includes the added acknowledgment steps and the exception extensions. Some steps are annotated with (made up) probabilities of success: the ApprFloorSensor and the AtFloorSensor have failure chances of 2% and 5% respectively. The motor has a 1% chance of failure.
Use Case: ElevatorArrival Intention: System wants to move the elevator to the User’s destination floor. Level: Subfunction Main Success Scenario: 1. System asks motor to start moving towards the destination floor. 2. System detects elevator is approaching destination floor. Reliability:0.98 Safety-critical 3. System requests motor to stop. Reliability:0.99 Safety-critical 4. System receives confirmation elevator is stopped at destination floor. Reliability:0.95 5. System requests door to open. 6. System receives confirmation that door is open. Extensions: 2a. Exception{MissedFloor} 4a. Exception{MotorFailure} 6a. Exception{DoorStuckClosed} Fig. 5. Updated ElevatorArrival Use Case
For space reasons, we assume that the motor always starts and the door always opens. In addition, each step is tagged as Safety-critical if the failure of that step threatens the system safety. 6.2 The DA-Charts Model of the Basic Elevator Arrival System with Failures We first model the initial ElevatorArrival use case shown in Sect. 6.1 as a DA-Chart according to the process described in Sect. 4.3. The result is shown in Fig. 6. The model consists mainly of four orthogonal components which model the behaviour of the system (System), a motor (Motor), and two sensors (ApprFloorSensor and AtFloorSensor). An additional orthogonal component is used to monitor the safety outcome of the system. Note that the system has no randomness. To clarify the model, one of the components is briefly explained here. The Motor is initially ready (in the mtr ready state). After it is triggered by the System (by the start event), it acknowledges the System’s request (by broadcasting startAck) and goes into running mode (by transitioning to the mtr started state). When the motor is asked to stop (by the stop event), the Motor will either stop itself successfully (going to mtr stopped) and send an acknowledgement (by broadcasting stopAck), or fail to stop (going to mtr failed and broadcasting motorFailure and toUnsafe). The chances of success and failure are 99% and 1% respectively. 6.3 Evaluating Dependability of the System Safety Analysis. We want to ensure the safety levels maintained by the elevator arrival system. The system is unsafe if the approaching floor sensor fails to detect the destination floor (because then the system never tells the motor to stop), or if the motor fails to stop when told to do so. This is why the failure transition in the ApprFloorSensor component, as well as the failure transition in the Motor component broadcast a toUnsafe event that is recorded in the Status component. It is interesting to note that actually achieving the goal of the use case has nothing to do with safety. Our tool then calculates that the probability of reaching the state safe from the initial system state (sys ready) is 97.02%, which is the combination of the probabilities along two possible paths.
Elevator_I Motor
System
ApprFloorSensor
mtr_ready
sys_ready
apFlrSnsr_ready
start/startAck
startAck{0.02}/missedFloor;toUnsafe
/start
startAck{0.98}/apFlrSnsrD
mtr_started sys_started
stop{0.01}/motorFailure;toUnsafe
missedFloor
stop{0.99}/stopAck
apFlrSnsr_ack
apFlrSnsrDetected/stop
apFlrSnsr_failed
AtFloorSensor
mtr_stopped mtr_failed sys_stopped
Status
sys_missed_floor
atFlrSnsr_ready
atFlrSnsrFailure
normal
toUnsafe
toSafe
safe
motorFailure
stopAck{0.05}/atFlrSnsrFailure;toSafe stopAck{0.95}/floorReached;toSafe
floorReached/openDoor
unsafe
goalSuccess
goalFailure
atFlrSnsr_ack
atFlrSnsr_failed
Fig. 6. DA-Chart Model of the Elevator Arrival Use Case with Failures
Reliability Analysis. Our tool calculates a reliability (probability of reaching the goalSuccess state) of 92.169%. Although we assume that the door is 100% reliable, a failure of the AtFloorSensor would prevent the system from knowing that the destination floor is reached, and hence the system cannot request the door to open. The person riding the elevator would be stuck inside the cabin, and hence the goal fails. 6.4 Refining the Elevator Arrival Use Case For a safety-critical system like the elevator control system, a higher level of safety is desirable. Safety can be increased by using more reliable or replicated hardware, but such hardware might not be available or might be too costly. Another possibility is to initiate an action that can prevent catastrophes from happening. To illustrate this approach, we focus on the motor failure problem. To remain in a safe state even if the motor fails, it is necessary to use additional hardware like an emergency brake. This behavior is encapsulated in the EmergencyBrake safety handler (shown in Fig. 7). 6.5 The DA-Charts Model of the Safety-Enhanced Elevator Arrival Use Case The DA-Chart model of the elevator arrival system is updated to reflect the use of emergency brakes (see Fig. 8). Another orthogonal component to model the behaviour of the emergency brakes is added. The brake used has a 99.9% chance of success. Handler Use Case: EmergencyBrake Handler Class: Safety Context & Exception: ElevatorArrival{MotorFailure} Intention: System wants to stop operation of elevator and secure the cabin. Level: Subfunction Main Success Scenario: 1. System stops motor. 2. System activates the emergency brakes. Reliability:0.999 Safety-critical 3. System turns on the emergency display. Fig. 7. EmergencyBrake Handler Use Case
Elevator_I Motor
System
ApprFloorSensor
mtr_ready
sys_ready start/startAck
apFlrSnsr_ready /start startAck{0.02}/missedFloor;toUnsafe startAck{0.98}/apFlrSnsrD
mtr_started stop{0.01}/motorFailure
sys_started
stop{0.99}/stopAck
missedFloor
apFlrSnsrDetected/stop
apFlrSnsr_ack
apFlrSnsr_failed
AtFloorSensor
mtr_stopped mtr_failed sys_missed_floor
sys_stopped
atFlrSnsr_ready
Status atFlrSnsrFailure/activate
normal
stopAck{0.95}/floorReached;toSafe
floorReached/openDoor
toSafe
safe
stopAck{0.05}/atFlrSnsrFailure
motorFailure/activateEB
toUnsafe
unsafe
goalSuccess
goalFailure
atFlrSnsr_ack
atFlrSnsr_failed
EmergencyBrake activateEB{0.001}/toUnsafe
eb_ready activateEB{0.999}/toSafe
eb_activated
eb_failed
Fig. 8. DA-Chart Model of the Elevator Arrival System with Failures and Handlers
Safety Analysis. A probability analysis of the updated model shows a significant improvement in the safety achieved by the system. It is now safe 97.9942% of the time, which evaluates to an increase of 0.9742%. The safety would be even more improved if the missedFloor exception would be detected and handled.
Reliability Analysis. The reliability of the system has not changed. The use case could be further refined so that the elevator detects when the AtFloorSensor fails 1 , and then the system could redirect the elevator to the nearest floor. Even though the original goal of the user is not satisfied, the system attempts to provide reliable service in a degraded manner. 6.6 Discussion In this paper due to space constraints, we have only shown one safety-related refinement of the ElevatorArrival use case. Many other exceptions affect the dependability of the elevator system, for example exceptional situations that occur due to overweight or a door mechanism failure or a fire outbreak. However, such issues can be easily modelled in DA-Charts following our defined process, and can then be subjected to probability analysis. The proposed assessment approach can be easily scaled for more complex systems. Assessment and refinement is supposed to be an iterative process, and can be continued as long as it is realistic and feasible, until the expected system safety and reliability is met. Thanks to our tool support, iterations are not time-consuming, and immediate feedback is given to the analyst of how changes in the use cases affect system dependability. 1
This can, for instance, be done using a time-out.
7 Related Work Research has been carried out on analyzing quality of requirements mostly using formal requirements specification, that is, requirements written in specification languages, and model checking techniques. Bianco et al. [13] presents an approach for reasoning about reliability and performance of probabilistic and nondeterministic systems using temporal logics for formal specification of system properties and model-checking algorithms for verifying that the system satisfies the specification. Automatic verification of probabilistic systems using techniques of model checking are also covered in [14]. Atlee et al. [15] demonstrates a model-checking technique used to verify safety properties of event-driven systems. The formal requirements are transformed to statebased structures, and then analyzed using a state-based model checker. Huszerl et al. [16] describes a quantitative dependability analysis approach targeting embedded systems. The system behaviour is specified with guarded statechart models and then mapped to timed, stochastic petri nets to carry out performance evaluation. Jansen et al. [17] proposed a probabilistic extension to statecharts, P-Statecharts, similar to our DA-Charts formalism to aid in formal verification of probabilistic temporal properties. The probability concept in P-Statecharts has two facets: environmental randomness and system randomness. In our work, we focus on dependable systems in which randomness only comes from the environment the system is exposed to, rather than from the system itself. Unlike their formalism, DA-Charts allows different actions to be taken (events to be broadcasted) depending on the probabilistically chosen target state, not just on the event which initiates the transition. Based on the work in [17], they later proposed the StoCharts approach [18] which extends UML-statecharts with probabilities and stochastic timing features to allow for QoS modelling and analysis. Vijaykumar et al. [19] proposed using a probabilistic statechart-based formalism to represent performance models. The model specified using statecharts is used to generate a Markov chain from which steady-state probabilities are obtained. Their approach is concerned with evaluating general performance of models, such as system productivity. Blum et al. [20] presents the System Availability Estimator (SAVE) package that is used to build and analyze models to enable prediction of dependability constraints. A SAVE model is constructed as a collection of components, each of which can be subject to failure and repair. The high-level model is then automatically transformed to a Markov chain model. Bavuso et al. [21] introduce the Hybrid Automated Reliability Predictor (HARP) tool developed for prediction of reliability and availability of fault-tolerant architectures. It is Markov model-based, and provides support for coverage modelling and automatic conversion of fault trees to Markov models. Our approach is different in the sense that we begin with informal requirements specification, namely use cases, apply a model-driven process to map the requirements to statecharts to evaluate the safety and reliability achieved by the system, followed by revisiting and refining the use cases if necessary. Developers do not require expertise in specification languages to determine the quality of their requirements. Also, communicating with end-users is simpler with use cases. The probability analysis is completely automated and allows quick generation of dependability-related statistics. Our model-based assessment is similar to model-checking since we attempt to verify
that dependability constraints hold. However, the goal of our work is to evaluate and refine the requirements of the system, and model analysis is carried out only to serve this purpose.
8 Conclusion and Future Work We have proposed a model-based approach for analyzing the safety and reliability of requirements based on use cases. The contribution mainly lies in the combined use of exceptional use cases, probabilities, statecharts, and dependability analysis means. Each interaction step in a use case is annotated with a probability reflecting its chances of success, and a safety tag if the failure of the step hampers the system safety. The use cases are then mapped to DA-Charts, a probabilistic extension of the statechart model. Precise mapping rules have been suggested. We have implemented our formalism in the AToM3 tool to provide support for automatic dependability analysis. The tool also verifies the formalism constraints and ensures that the mapping rules are adhered to. Based on path analysis, the tool quantitatively determines probabilities of reaching safe or unsafe states. The assessment allows the analyst to decide if the dependability constraints of the system are met. If not, the use cases have to be refined. This implies introducing additional interaction steps, discovering exceptions and applying handlers that dictate the system behavior in such situations [1]. At each refinement step, our tool provides immediate feedback to the analyst on the impact of the changes on system dependability. Based on our dependability focused use cases, a specification that considers all exceptional situations and user expectations can be elaborated during a subsequent analysis phase. This specification can then be used to decide on the need for employing fault masking and fault tolerance techniques when designing the software architecture and during detailed design of the system. So far, our assessment technique only considers exceptions that threaten the reliability and safety of the system. In the future, we want to extend our approach to also be able to handle exceptions in the environment that change user goals. For instance, a person riding an elevator might feel unsafe and request an emergency stop. Once the situation is resolved, normal service should continue where it was interrupted. To model such a situation, we are currently working on integrating hierarchy and history into DA-Charts. We also aim to automate the process of mapping use cases to DA-Charts (and viceversa). This would be a highly desirable feature, ultimately allowing developers to work with the model (use cases or statecharts, or maybe even sequence diagrams) that best suits them. Our tool can then ensure that all representations are consistently updated. Any changes made to one model would automatically be reflected in the other models. Finally, we intend to extend our process to address other dependability constraints like availability, timeliness, and usability.
References 1. Shui, A., Mustafiz, S., Kienzle, J., Dony, C.: Exceptional use cases. In Briand, L.C., Williams, C., eds.: MoDELS. Volume 3713 of Lecture Notes in Computer Science., Springer (2005) 568–583
2. Laprie, J.C., Avizienis, A., Kopetz, H., eds.: Dependability: Basic Concepts and Terminology. Springer-Verlag New York, Inc., Secaucus, NJ, USA (1992) 3. Geffroy, J.C., Motet, G.: Design of Dependable Computing Systems. Kluwer Academic Publishers (2002) 4. Avizienis, A., Laprie, J., Randell, B.: Fundamental concepts of dependability (2001) 5. Larman, C.: Applying UML and Patterns: An Introduction to Object-Oriented Analysis and Design and the Unified Process. 2nd edn. Prentice Hall (2002) 6. Harel, D.: Statecharts: A visual formalism for complex systems. Science of Computer Programming 8(3) (1987) 231–274 7. Harel, D.: On visual formalisms. Communications of the ACM 31(5) (1988) 514–530 8. de Lara, J., Vangheluwe, H.: Defining visual notations and their manipulation through metamodelling and graph transformation. Journal of Visual Languages and Computing 15(3 - 4) (2004) 309–330 Special Issue on Domain-Specific Modeling with Visual Languages. 9. de Lara, J., Vangheluwe, H.: AToM3 : A tool for multi-formalism and meta-modelling. In: ETAPS, FASE. LNCS 2306, Springer (2002) 174 – 188 Grenoble, France. 10. de Lara, J., Vangheluwe, H.: Computer aided multi-paradigm modelling to process petri-nets and statecharts. In: International Conference on Graph Transformations (ICGT). Volume 2505 of Lecture Notes in Computer Science., Springer (2002) 239–253 Barcelona, Spain. 11. Juan de Lara, H.V., Mosterman, P.J.: Modelling and analysis of traffic networks based on graph transformation. Formal Methods for Automation and Safety in Railway and Automotive Systems (December 2004. Braunschweig, Germany) 11 12. Feng, T.H.: DCharts, a formalism for modeling and simulation based design of reactive software systems. M.Sc. dissertation, School of Computer Science, McGill University (2004) 13. Bianco, A., de Alfaro, L.: Model checking of probabalistic and nondeterministic systems. In Thiagarajan, P.S., ed.: FSTTCS. Volume 1026 of Lecture Notes in Computer Science., Springer (1995) 499–513 14. Hinton, A., Kwiatkowska, M., Norman, G., Parker, D.: PRISM: A tool for automatic verification of probabilistic systems. In: Proc. 12th International Conference on Tools and Algorithms for the Construction and Analysis of Systems (TACAS’06). (2006) To appear. 15. Atlee, J.M., Gannon, J.: State-based model checking of event-driven system requirements. IEEE Transactions on Software Engineering 19(1) (1993) 24–40 Special Issue on Software for Critical Systems. 16. Huszerl, G., Majzik, I., Pataricza, A., Kosmidis, K., Cin, M.D.: Quantitative analysis of UML statechart models of dependable systems. Comput. J 45(3) (2002) 260–277 17. Jansen, D.N., Hermanns, H., Katoen, J.P.: A probabilistic extension of uml statecharts: specification and verification. In Damm, W., Olderog, E.R., eds.: Formal techniques in real-time and fault-tolerant systems: FTRTFT. Volume 2469 of Lecture Notes in Computer Science., Berlin, Germany, Springer (2002) 355–374 18. Jansen, D.N., Hermanns, H.: QoS modelling and analysis with UML-statecharts: the stocharts approach. SIGMETRICS Performance Evaluation Review 32(4) (2005) 28–33 19. Vijaykumar, N.L., de Carvalho, S.V., de Andrade, V.M.B., Abdurahiman, V.: Introducing probabilities in statecharts to specify reactive systems for performance analysis. Computers & OR 33 (2006) 2369–2386 20. Blum, A.M., Goyal, A., Heidelberger, P., Lavenberg, S.S., Nakayama, M.K., Shahabuddin, P.: Modeling and analysis of system dependability using the system availability estimator. In: FTCS. (1994) 137–141 21. Bavuso, S., Dugan, J.B., Trivedi, K.S., Rothmann, B., Smith, E.: Analysis of typical faulttolerant architectures using HARP. IEEE Transactions on Reliability (1987)