can be applied to realize model-free execution monitoring by classifying observed ...... Exactly the same control software is used during the two different .... best for fault detection and energy performed best for fault isolation. In Table I and II the ...
IEEE TRANSACTIONS ON SYSTEMS, MAN, AND CYBERNETICS—PART B: CYBERNETICS, VOL. 37, NO. 4, 890–901
1
Model-Free Execution Monitoring in Behavior-Based Robotics Ola Pettersson, Lars Karlsson, and Alessandro Saffiotti
Abstract— In the near future, autonomous mobile robots are expected to help humans by performing service tasks in many different areas, including personal assistance, transportation, cleaning, mining, or agriculture. In order to manage these tasks in a changing and partially unpredictable environment, without the aid of humans, the robot must have the ability to plan its actions and to execute them robustly and in a safe way. The robot must also have the ability to detect when the execution does not proceed as planned, and to correctly identify the causes of the failure. An execution monitoring system allows the robot to detect and classify these failures. Most current approaches to execution monitoring in robotics are based on the idea of predicting the outcomes of the robot’s actions by using some sort of predictive model, and comparing the predicted outcomes with the observed ones. In contrary, this work explores the use of model-free approaches to execution monitoring, that is, approaches that do not use predictive models. In this work we show that pattern recognition techniques can be applied to realize model-free execution monitoring by classifying observed behavioral patterns into normal or faulty execution. We investigate the use of several such techniques, and verify their utility in a number of experiments involving the navigation of a mobile robot in indoor environments.
I. I NTRODUCTION Autonomous mobile robots that act in a changing and partially unpredictable environment must have the ability to plan their actions and to execute them robustly and in a safe way. Since the real world is dynamic and not fully predictable, the robot must also have the ability to detect when the execution does not proceed as planned, and to correctly identify the causes of the fault. An execution monitoring system is a system that allows the robot to detect and classify these faults. In the control literature such systems are called fault detection and isolation systems. When a fault is detected and isolated, the fault information can be used within the controller in order to recover from the fault situation. Therefore, a fast detection and accurate isolation of the faults will help the system to find better recovery strategies and guarantee safety. For a deeper motivational analysis on monitoring in robotics see [2]. Execution monitors can be classified into two major groups: those that use a predictive model in order to verify that the system evolves as expected, called model-based monitoring, and those that solely observe the actual execution of the system, called model-free monitoring [3]. In model-based approaches, the monitoring system uses a model of the monitored system, in our case the robot, in order to predict the expected behavior. Discrepancies between the predicted behavior and the observed one are taken as ¨ The authors are with the Orebro University, Sweden.
indication of a fault. The main assumption when using modelbased approaches is that a precise mathematical model of the system is available. In many complex systems it is difficult, or even impossible to create such models. This concerns, for example, behavior-based systems where the combination of different reactive behaviors may produce an overall behavior, sometimes called an emergent behavior, that is very difficult to model. Other examples of systems that are hard to model are systems that involve many different input variables or many unknown parameters. In general, model-based approaches run the risk to interpret as faults discrepancies between the estimated output and the measured output, which are instead caused by modeling errors. Let us explain the idea of model-based execution monitoring with an intuitive example. An autonomous mobile robot that assists in office deliveries has a fixed set of well defined actions, for example, cross door. Each action has a corresponding model that is used to predict the outcome from the particular action. The outcome from the cross door action, given the specific door to be crossed is that the robot is positioned on the other side of the door. If the robot does not reach the goal position after the action has terminated, the monitoring system indicates a fault. Model-free execution monitoring does not use predictive models. Instead, the monitoring system solely observes the behavior of the monitored system, and classifies these observed behavioral patterns into normal or faulty execution. If a model-free execution monitoring system is incorporated in the autonomous office robot, predictions about action outcomes are never performed. Instead, the overall behavior of the robot is analyzed. In this approach, non effective motion, for example when the robot moves in circles or jerkily indicates a fault independently of terminated actions. Model-free execution monitoring is almost totally neglected within the robotics field. On the other hand it is accepted within other fields, such as the process industry. In order to learn more about its particular advantages, this paper will focus on model-free techniques. The main contribution of this paper is to bring modelfree techniques into the robotics field. We introduce and study methods to realize model-free execution monitoring in behavior-based robotics. The work is based on the only assumption that the behaviors have some activation levels, or enabling signals, and that the monitor has access to those levels. We show that pattern recognition techniques can be applied to realize execution monitoring by classifying observed behavioral patterns into normal or faulty execution. We investigate the use of several such techniques, and verify their utility in a number of experiments involving the navigation of
IEEE TRANSACTIONS ON SYSTEMS, MAN, AND CYBERNETICS—PART B: CYBERNETICS, VOL. 37, NO. 4, 890–901
Controller
Controller Input
Input
Output
Output
Robot
Robot
Execution monitor
Execution monitor
Output prediction
Classification
Fault
Fig. 1.
2
The basic principle of a model-based execution monitoring system.
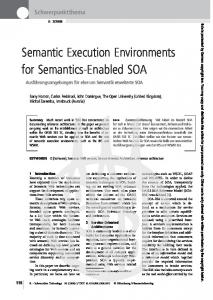
a mobile robot in indoor environments. Statistical measures are used to compare the results given from several realistic simulations. Our approach has also been successfully tested on a real robot navigating in an office environment. Interesting, this test has shown that it is possible to train a model-free execution monitor in simulation, and then use it in a real robot. In the next section we recall the necessary background on execution monitoring. In Section III we give an outline of our approach to model-free execution monitoring in the case of behavior-based robots. In Section IV we present the technical details of our approach, based on pattern recognition. Our technique is evaluated in Section V by means of several series of experiments, performed both in simulation and on a real mobile robot. Finally, in Section VII we discuss our results and conclude. II. BACKGROUND According to [3, p. 5] monitoring can be classified into model-based or model-free approaches. Inspired by this work we define these two categories as follows: • model-based approaches use a predictive model in order to verify that the monitored system evolves as expected, and • model-free approaches solely observe the actual execution of the system, and detect certain patterns that indicate some problem. Figure 1 shows the basic principle of a model-based execution monitoring system. In this approach predictive models, often basic models from physics, are used in order to predict the system’s output. This approach relies on the concept of analytical redundancy. This means that two analytically generated quantities, most often the predicted state and the observed state, are compared. The resulting difference, called residual, indicates the presence of a fault in the system. In Figure 2 the basic principle of a model-free execution monitoring system is shown. Here the input is not given to the execution monitor. Instead, faults are detected when certain patterns are recognized in the robot’s output. Note that the above given definitions do not tell us anything about the use of models in the control of the system. Predictive models are necessary during planning, and also often incorporated in the control of the system. Furthermore,
Fault
Fig. 2.
The basic principle of a model-free execution monitoring system.
the term model-free is somewhat misleading. Also model-free approaches need some kind of model, in order to discriminate fault situations from normal behavior. Nevertheless, the key aspect is that no predictive models are used within the monitoring system. More complex variations of these two basic principles are possible. That is, to combine a model-based approach with a model-free approach in a hybrid monitor. Such hybrid monitoring approaches are, for example, proposed by [4] in the field of industrial control. A. Model-Based Execution Monitoring in Robotics Model-based execution monitoring is by far the most common approach within the robotics literature. The first model-based execution monitor applied to a mobile robot was PLANEX [5] on board Shakey. Here the predicted outcomes from the robot’s actions were compared to the measured world-state. The Procedural Reasoning System (PRS) [6] was developed as the execution and monitoring system on board the mobile robot Flakey. In PRS every plan has an expected outcome that is monitored by the system. In other words, the residual is given by comparing the measured world-state to the expected world-state. PRS has been developed further and implemented in many different mobile robot control architectures. See for example, Saphira [7], CPEF [8], the LAAS architecture [9], or Execution Assistants [10]. The Reactive Action Packages (RAP) system [11] was introduced as a plan execution and monitoring system for mobile robots and has much in common with PRS. The RAP system is the main component in the Animate agent architecture [12], [13]. The execution monitoring device on board the mobile robot Xavier [14] is programmed in TDL [15]. Also TDL is very similar to PRS. In this approach a fault is defined as a significant difference between the observed state of the world and the expectation with respect to the nominal situation [16]. Livingstone [17] is the control architecture used in NASA’s first New Millennium spacecraft. Also here the residual is given by comparing the measured state to the expected state. In Livingstone 2 [18] the state identification is improved by the use of Markov decision processes.
B. Model-Free Execution Monitoring in Robotics Model-free execution monitoring is rarely seen in the robotics literature, although some systems do exist [22]. An early example is presented in [23] where a model-free monitor is applied to an autonomous rover moving across the surface of a planet. In this approach several variables are measured and compared to a number of limit values. These limit values are obtained from statistical measures from several simulations. Another early example of execution monitoring using limit value checking on an autonomous robot is the work on the Thinking Cap [24]. In this system a variable, that is a fuzzy composition of several variables, is compared to a given limit in order to detect plan failures. In [25] this work is extended by comparing the fuzzy variable to several limits in order to obtain the magnitude of the fault. Recent work on execution monitoring in planetary rovers is given in [26]. Here the system is described as a discretetime probabilistic hybrid automaton. Instead of defining the different states in the automaton from predictive models, the transition functions between states are given from statistical measures from several observed variables. The monitoring is realized using particle filters [1]. Although not focused on execution monitoring but still related to this, is work on the DD&P architecture [27]. This work shows that the activation levels of the behaviors form certain patterns that can be learned in order to extract information about the robot’s state. The extracted information is not primarily used for fault detection, merely to help in localization. III. A NALYSIS OF B EHAVIOR ACTIVATION L EVELS Most behavior-based systems [28] incorporate behavior activation levels that are updated continuously. The intuitive idea behind our approach to execution monitoring is that these activation levels form specific patterns when a fault occurs that differs from the patterns given during normal execution. In
Reach Orient Face Cross
3
1 0.5 0 0 1
10
20
30
40
50
60
10
20
30
40
50
60
10
20
30
40
50
60
10
20
30
40
50
60
10
20
30
40
50
60
10
20
30
40
50
60
0.5 0 0 1 0.5 0 0 1 0.5 0 0 1 0.5 0 0 1
Still
Rationale-based monitoring [19] is another planning and monitoring system. In Rationale-based monitoring, a set of states within the world-model are selected to be monitored. This approach dramatically decrease the state space to be observed. Work on Overseer [20] differs from the work discussed above since it focuses on monitoring multiple agents. In Overseer the agents are modeled as a graph showing the relationship between belief and the different agents’ statuses. Overseer has been applied to synthetic multi-agent battlefield simulation environments. The monitoring system within the behavior-based Saphira architecture [21] is designed as an expert system implemented in linear temporal logic (LTL). In this approach a set of temporal fuzzy rules, operating on the activation levels of the behaviors, are used for fault detection and isolation. In contrary to many other expert systems the fault detection and isolation is not based on the current state solely. LTL supports notions of time and time intervals, and therefore a sequence of measures can be analyzed.
Follow
IEEE TRANSACTIONS ON SYSTEMS, MAN, AND CYBERNETICS—PART B: CYBERNETICS, VOL. 37, NO. 4, 890–901
0.5 0 0
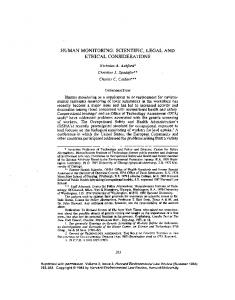
Fig. 3. Examples of behavior activation levels changing over time. After approximately 20 seconds a fault occurs when the robot reaches a closed door. Time is given in seconds.
Figure 3 some examples of such activation levels are shown. Here we can see that some problem occurs after approximately 20 seconds since the R EACH behavior endlessly is switched on and off. Our idea is to detect such abnormal patterns automatically. Our work is founded on only one assumption, namely: the use of behaviors with activation levels. In virtually all other matter the work is not dependent on neither the architecture nor the robot. This is accomplished since the model-free monitoring approach only incorporates knowledge about the relation between the activation levels of the behaviors, and the fault classes. In the following sections the model-free approach will be evaluated systematically. First, the simplest method to realize model-free execution monitoring is tested. Second, the monitoring performance is increased when several variables are analyzed. Third, robustness is further increased by the use of several time instances of each variable. A. Limit Value Checking The simplest method to realize model-free execution monitoring is by limit value checking, the most frequently used method for fault detection in the process industry [29]. In this approach some measured variables are compared to given limits. If a measured variable exceeds the threshold limit a fault is indicated. By testing this simple method we have shown that model-free execution monitoring is possible in behavior-based robotics [25]. We consider execution monitoring on a mobile robot that is controlled by a hybrid architecture based on [24] and called the Thinking Cap [30]. The Thinking Cap (TC) consists of a fuzzy behavior-based controller, and a navigation planner. In Figure 4 the reactive controller in TC is shown. In order to achieve a goal the planner creates a behavior-plan (B-plan) consisting of a number of behaviors to be executed together with the conditions to execute them. These are represented
IEEE TRANSACTIONS ON SYSTEMS, MAN, AND CYBERNETICS—PART B: CYBERNETICS, VOL. 37, NO. 4, 890–901 B-plan
R1
R2
D1
4
Controller
Context rules
... LPS
D2
Behavior 1
Defuzzification
C1 R3
Controls
...
...
Behavior 2
Behavior n
2 1
Fig. 4.
4
D31
3
C2
The behavior-based controller in Thinking Cap.
D32
Fig. 5. The robot has the plan “Goto R3 ,” but this turns out to be difficult to achieve, so it adopts a new plan “Goto R2 .”
using fuzzy rules. An example of a B-plan is shown in Figure 15. Depending on the current situation, the different behaviors are activated to different degrees. Let bj (t) denote the activation level of behavior Bj at time t. For example, in Figure 3 the behavior R EACH is activated to a degree of 0.5 at time 20 seconds. This is denoted bReach (20) = 0.5. Fault detection is performed by limit value checking of the adequacy variable obtained from the TC. This variable is a measure of the ability for the current B-plan, to achieve the given goal. Intuitively, the variable measures the amount by which the current situation is covered by at least one behavior in the plan, that is, there is at least one behavior active. A simplified version of the formal definition of adequacy found in [24] is as follows: Let P be the B-plan created for a certain goal. Then adequacy is the degree by which P is an adequate plan at time t, measured by: Adequacy(P, t) = max bj (t). Bj ∈P
(1)
This measure quantifies the above intuition, that there is at least one behavior which is active at the current time t. The use of the maximum operator is coherent with the fact that behaviors in the TC are weighted and combined using fuzzy logic: max is the fuzzy logic equivalent of the ∃ operator for the finitary case. Let us now consider the following scenario: A mobile service robot works in a food factory, see Figure 5. It regularly has to go and fetch two food samples from two production lines in two different rooms, R2 and R3 , and bring them to the quality control lab, room R1 . The robot must now plan its next delivery. It decides to get the sample from R3 first, since room R3 is a little bit nearer than R2 . While going there, however, it finds that the main door to that room is closed. The robot knows that there is another door that could be used, and considers the desirability of using that one instead. Unfortunately, the alternative way to R3 is more difficult, since it goes through a narrow corridor which is usually cluttered with boxes. Besides, doors usually do not stay closed for long. Hence, the robot decides to go first to R2 , and come back to R3 later on. It goes to room R2 , picks up the food sample and returns. The door to R3 is still closed, and this time our robot has no other choice than taking the difficult route. It does so, obtains the desired sample, and finally reaches the lab and completes its task.
R1
R2
D1
D2 C1 R3 7
5 6
D31 C2
D32
Fig. 6. The robot again tries the plan “Goto R3 .” Since door D31 is still closed, the robot has to go through the cluttered corridor C2 .
Figures 5–7 show a simulation of the given scenario. In Figure 8 the measures of adequacy during the simulation are presented. After approximately 20 seconds the value drops to zero when the robot reaches the closed door at point 2 in Figure 5. This fault is detected by the monitor and the other route to R3 is tried. The adequacy then raises just above the limit value when the robot starts traversing the cluttered corridor (point 3 in Figure 5). Also this fault, although less critical, is detected by the monitor and a new plan is created. The adequacy then indicates a very successful execution from point 3 until point 5 when a new critical fault is detected. Door D31 is still closed and this time the robot has no option but using the difficult route. An advantage of this simple method is that it is straightforward to apply. The monitoring algorithm is basically a comparison between the measured variable and a limit. Furthermore, no predictive models either describing the robot or the robot’s actions have to be created and encoded into the monitoring system. One limitation is that it is not obvious how to determine the limit values. In our experiments, these were found through trial and error. Another, more fundamental limitation is that this method is only able to detect a fault when a relatively big change in the measured variable occurs. In addition, more complex types of faults cannot be detected. This is a well known limitation of this approach and is discussed in, for example, [29]. In the rest of this paper, we will consider a number
IEEE TRANSACTIONS ON SYSTEMS, MAN, AND CYBERNETICS—PART B: CYBERNETICS, VOL. 37, NO. 4, 890–901
R1
D1
R2
Input data
Data acquisition
5
Feature extraction
Classification
Fault information
8
Fig. 9. Schema of the model-free execution monitoring approach realized by pattern recognition.
D2 C1 R3
D31 D32
C2
Adequacy
Fig. 7. Both previous plans are fulfilled, and the robot adopts the last plan “Goto R1 .”
A. Data Acquisition
1 0.5 limit value
0 0
divides the measurement data represented by a set of features into groups. In this work we have evaluated both statistical classification and artificial neural networks. Figure 9 shows a schema of the model-free execution monitoring approach realized by pattern recognition. The following sections describe how the three steps can be realized in more detail.
50
100
150
200
250
300
350
Time
Fig. 8. Measures of adequacy during the simulation run. Time is given in seconds.
of more sophisticated activation level analysis methods. IV. PATTERN R ECOGNITION FOR M ODEL -F REE E XECUTION M ONITORING The main assumption in our approach is that faults form specific patterns in the activation levels of the behaviors. If this assumption holds, execution monitoring can be based on standard pattern recognition techniques. Pattern recognition can be divided into two groups depending on the training method: supervised pattern recognition and unsupervised pattern recognition [31]. When the designer of the monitoring system knows what is faulty behavior as well as the difference between different faults a supervised approach seems most straightforward. The design process of an execution monitoring system based on supervised pattern recognition will undergo two phases: • Learning phase The monitoring system is given the type of fault from the supervisor, and simultaneously a number of variables are measured. From these data pairs a discriminant function is created. • Decision phase During execution monitoring new input data is continuously given to the monitoring system. Now the discriminant function is used to classify the given data into one of the learned faults. In both phases the following three steps are performed: data acquisition, feature extraction, and classification. Data acquisition is basically the process of measuring some variables, in our case the activation levels of the behaviors. In most cases the discrimination power is improved if the raw measurements obtained from data acquisition are processed in some way. This pre-processing is called feature extraction. In this work several common feature extraction methods have been evaluated. Classification is a discriminant function that
In the simple method above the activation levels were combined into one variable in order to perform limit value checking. We will now show that the execution monitoring performance can be increased when the characteristics of each activation level is analyzed. Data acquisition is the process of collecting the activation levels bj (t) of all behaviors Bj continuously. As with any pattern recognition system it is of great importance that the same variable set is measured throughout the analysis. If a fixed set of behaviors always was executed this would be fulfilled. Then data acquisition would be rather simple since the data could be collected directly from the system. In TC the B-plans contain different sets of behaviors given different navigation goals, or different environments. For example, different plans may contain different instances of the behavior C ROSS involving different doors. A straightforward solution to this problem is to group together all behaviors of a certain type, and to merge the activation levels connected to the behaviors within each group. For example, all activation levels connected to the behavior type C ROSS(O) can be merged together independently of what door O the behavior refer to. This merging operation can be formalized as follows: Let T d be a fixed set of behavior types, and T ∈ T d be one of these types. Let bj (t) denote the activation level connected to behavior Bj in a given B-plan P . Then the merged activation level for behavior type T at time t is computed by ¯bT (t)
=
max bj (t).
Bj ∈T
(2)
The activation level merging transforms the data into space An×d where n is the number of time instances and d is the number of behavior types given in T . Since the number of behavior types d is fixed, and independent of the goal and the environment, the merged data is now plan independent. The merged activation levels can be put in the following activation level vector: ¯ b(t) =
[¯b1 (t), ¯b2 (t), . . . , ¯bd (t)],
(3)
where t denotes the current time. Now the data acquisition is simply the following allocation: xt
=
¯ b(t).
(4)
IEEE TRANSACTIONS ON SYSTEMS, MAN, AND CYBERNETICS—PART B: CYBERNETICS, VOL. 37, NO. 4, 890–901
When the activation levels are collected for several time instances, the data can be stacked into a matrix X ∈ An×d . B. Feature Extraction Even though the merged activation levels seem to contain some informative patterns, they also contain a lot of noise. In order to improve robustness, several observations from multiple time instances can be considered. In the pattern recognition literature many standard feature extraction methods are given. During the experiments the following commonly used methods are compared: • cumulative sum (CUSUM), • energy, • sample variance, and • median. These feature extraction methods use samples from several time instances. Therefore the feature extraction is performed on a set of samples within a time window. This means that a feature variable is calculated, using a time window, for each behavior type. Let w be the size of the window, that is, the number of samples within the window. Then the data vector captured over time window w can be written as a column vector x
= [x1 , x2 , . . . , xw ]T ,
(5)
where T denote the transpose. The window size is a parameter of interest for the performance of the monitoring system, that will be discussed further on. A cumulative sum (CUSUM) is the partial sum of the samples within the given time window. A feature calculated by the cumulative sum is given by the following equation: sum(x)
=
w X
xi .
(6)
i=1
An average calculation can be applied to overcome some of the noise fluctuations within the time window. One common average calculation is the energy. This feature is calculated of the data x according to =
ene(x)
w 1 X 2 x . w i=1 i
(7)
The sample variance of x is given by the following equation: w
var(x)
=
1 X (xi − x ¯)2 , w − 1 i=1
(8)
where x ¯ is the sample mean given as: x ¯ =
w 1 X xi . w i=1
(9)
The median is calculated by sorting the samples within x and selecting the middle value. Let the samples within x be sorted in increasing order such that x1 ≤ x2 ≤ · · · ≤ xw . Then the median is given as: � x(w+1)/2 when w is odd, and med(x) = (10) 1 (x + x ) when w is even. w/2 w/2+1 2
6
One of the given feature extraction methods is used to calculate a scalar feature variable, for each behavior type. The feature vector is composed of all calculated feature variables. Hence the length of the feature vector is the number of behavior types. Ideally, features that are used for classification should be uncorrelated. This is unfortunately not true for our variables, in fact the activation levels of the behaviors are highly interdependent. One way to obtain a set of less correlated features is to perform principal component analysis (PCA) on the data [32]. PCA is a method for projecting data into a lower-dimensional space. It produces a lower-dimensional representation in a way that preserves the correlation structure between the input variables, and is optimal in terms of capturing the variability in the data. In our case, let XF ∈ F n×d be the feature data computed by one of the above methods, where n is the number of time instances and d is the number of behavior types. Then we use PCA to transform this data into XP C ∈ F n×a , where F represents the principal component feature space, where a is the new dimension. See [22] for all details in the transformation steps. C. Classification In this section, we discuss how to apply two different classification methods to model-free execution monitoring, namely: multiple linear regression, that is, a classical multivariate statistical method, and radial basis function networks, that is, a particular type of artificial neural network. Both classification methods use a continuous input space, that is, the feature space, and map this data to a discrete output space, that is, the known classes determining the faults. 1) Multiple Linear Regression: We have chosen multiple linear regression (MLR) since it is a simple, and therefore computationally attractive, statistical method [33]. MLR combines a set of variables X in linear combinations that correlate as closely as possible to the corresponding y-values. When applying this approach to our data the response yn×1 is calculated by y = XP C w + e,
(11)
where XP C ∈ F n×a is the feature data matrix, wa×1 is the weight vector, and en×1 is a random error that is assumed to be normally distributed with mean 0 and constant variance. In the learning phase, an estimate of w is computed. Let w ˆ be the least squares estimate of w that minimizes e. Given the input data XP C and its corresponding output values y this estimation is calculated by −1 T w ˆ = (XT XP C y. P C XP C )
(12)
During learning the output vector y has ones at the corresponding class and zeros otherwise. In the decision phase a new data set XD , which is not earlier presented to the system, is classified into one of the known classes by solving the following equation: y ˆ = XD w. ˆ
(13)
IEEE TRANSACTIONS ON SYSTEMS, MAN, AND CYBERNETICS—PART B: CYBERNETICS, VOL. 37, NO. 4, 890–901
φ1 φ2
Fault detection
w11 w21
y1 y2
xd
φM Radial basis functions Fig. 10.
...
...
...
x2 w2M
Activation levels
Feature extraction (Median)
Classification (RBF network I)
Success/ fault
Feature extraction (Energy)
Classification (RBF network II)
Fault information
Data acquisition (Merging)
...
x1
7
yc
Fault isolation
wcM Fig. 11.
Schema of a hierarchical model-free execution monitoring system.
Output layer
The structure of a radial basis function network.
a mapping function: yk (xi ) =
M X
wkj φj (xi ),
i = 1, 2, . . . , n, (14)
j=0
The classification into several classes often performs poorly when only one regression model is used. Therefore we use the multi-model PCA (mPCA) approach, that is, several PCA models are created based on data collected from each specific fault. The data is then transformed by all the PCA models and an arbiter chooses the model, connected to a specific class, with the highest response. 2) Radial Basis Function Networks: Since artificial neural networks perform very well in pattern recognition problems [34], and have nonlinear discrimination power, we have chosen to also use radial basis function (RBF) networks for classification. The motivation of using RBF networks instead of the most popular multi-layer feed forward networks with backpropagation training algorithms is that the training is much faster for the former [35]. When using a linear regression method, such as the MLR, the PCA is a necessary part of the feature extraction in order to discriminate between different classes. In contrary, the linear transformation in the PCA will not significantly improve the discrimination power of a nonlinear classifier, such as artificial neural networks. Therefore, the PCA is not included in feature extraction when the classification is performed by RBF networks. Since our RBF network has spherically symmetric basis functions, it is particularly important to normalize the input variables so that they span similar ranges. Therefore the extracted features are normalized with respect to the mean and the variance and stacked into a new feature data matrix XF ∈ F n×d , where F represents the feature space. Each row in XF represents a feature vector xi , where i = 1, 2, . . . , n. These feature vectors are passed to the radial basis function networks. As shown in Figure 10 a RBF network can be described as a two-layer network. We have chosen an approach, presented in [35], where layer 1 consists of a number of nonlinear radial basis functions φj , where j = 0, 1, . . . , M , with fixed centers and parameters in the nonlinearities. Hence, the input data is translated into a nonlinear space. The output layer then performs a linear combination on this new space and the only adjustable parameters are the weights of this linear combination. Mathematically the network can be described as
where n is the number of time instances, wkj denote the weight between output neuron yk and the radial basis function φj , and φ0 is a bias with activation value fixed at φ0 = 1. The nonlinear basis function is in our case a Gaussian: φj (xi ) =
e−
kxi −µj k2 2σ2
,
(15)
where µj is the vector determining the center for basis function φj and σ is a constant that controls the smoothness properties of the interpolating function. Since the basis functions are considered fixed, the training of the output layer weights wkj is equivalent to the training of a single-layer network, termed generalized linear discriminant. Hence we can optimize the weights, that is, train our network, by minimizing a suitable error function such as the sum-of-squares error function: n c 1 XX 2 E = (yk (xi ) − tik ) , (16) 2 i=1 k=1
where tik is the target value, that is, the correct classification, for output neuron yk given input vector xi . Since the features are normalized in variance the static value σ was set to 1 in all experiments. D. Hierarchical Execution Monitoring In the above discussed techniques fault detection and fault isolation are performed by the same pattern recognition system. In other words, the same classifier is used to distinguish between normal behavior and faulty behavior as well as distinguishing between different faults. In contrary, a hierarchical execution monitoring system separates fault detection and fault isolation. In Figure 11 a hierarchical model-free execution monitor is shown. In this approach the fault isolation is not invoked until a fault is detected by the fault detection mechanism. One advantage of using hierarchical monitors is that the two functionalities can be specialized in order to increase the robustness of the monitoring system. Another aspect of considering hierarchical monitors is the performance in terms of reaction speed. In many cases it is important to detect a fault very quickly. On the other hand the fault isolation can
IEEE TRANSACTIONS ON SYSTEMS, MAN, AND CYBERNETICS—PART B: CYBERNETICS, VOL. 37, NO. 4, 890–901
sometimes be allowed to take longer time. If this is the case, the fault isolation function can use more measurement samples and more complex algorithms to perform better in terms of isolation power. Some examples of hierarchical monitors in the control literature are presented in [4] and [36]. In the next section, we shall provide an experimental evaluation of model-free execution monitoring using the hierarchical execution monitoring approach, and using the techniques for the different blocks which are indicated in Figure 11.
R1 D11
8
R2
D12
D2
C1 R3 D3
Fig. 12.
R4 D4
The office environment.
V. E XPERIMENTS The overall goal of our experiments is to evaluate the proposed idea of model-free execution monitoring. Two sets of experiments are performed: simulated experiments and real robot experiments. The simulated experiments are performed systematically. The techniques are chosen to solve the problems involved in the given scenario as simple as possible. Further on, when the scenarios are more complex, other more complex techniques are evaluated. By this increasing complexity approach, we can easily analyze what functionalities are needed in order to manage a scenario at a certain level of complexity. Furthermore, simulation allows for experiments where the same scenario including the same amount of noise and obstacles can be repeated several times. The large number of experiments allows for statistical analysis. The real robot experiments are not performed in order to get a statistically significant analysis of execution monitoring in real robot scenarios. The motivation of these experiments is rather to strengthen the previous statistical results given from simulation. A. Experimental Setup Both the simulation and real robot experiments are performed in indoor office environments including obstacles. Exactly the same control software is used during the two different experiments. During simulation several different office environments were evaluated. The real robot experiments were performed in an environment that was never used in simulation. The real robot environment is shown in Figure 12. During the experiments the robot is given a simple service task, that is, to collect mail from one or many of the rooms in the office environment. Three different scenarios are tested, both in simulation and in the real robot experiments, namely: 1) success, 2) detected closed door (Fault DCD), and 3) undetected closed door (Fault UCD). The success scenario of course represents a successful execution of the task. In this scenario all doors are open and the robot achieves its given navigation task. In the detected closed door scenario one the doors is found closed during execution. In the last scenario, the closed door is undetected during execution. Here, the robot keeps on trying to cross the closed door. Our system does have a means to detect that a door is closed by looking at sonar readings. However, this means is rather
unreliable and sometimes it fails to detect a closed door. This situation is rather realistic for service and domestic robots that do not use laser scanners. Laser scanners are relatively large, heavy, expensive, they require much power, and may pose a health threat. In the undetected closed door scenarios, the closed-door detector was manually switched off in order to test the monitoring under this situation. B. Simulated Experiments All the simulated experiments are performed within the mobile robot simulator named Nserver, which simulates the environment, that is, walls, corridors, and obstacles; and the robot hardware, that is, sensors and actuators including noise. Nserver is created by Nomadic Technologies, Inc., and sold together with the Nomad 200 robots [37]. All three scenarios were simulated 15 times, giving a total of 45 full simulated runs. Various amounts of obstacles were used, from no obstacles at all to highly cluttered rooms, and various amount of noise were added to the sensors and actuators. In the two fault scenarios different doors were closed. Figure 13 shows an example of the undetected closed door scenario. In this example three different rooms must be visited. This leads to that three different B-plans are executed in sequence. As can be seen in the figure the successful execution is correctly classified except for a moment after around 30 seconds of execution. It is of great importance that quantifiable criteria are used when evaluating the performance of a monitoring system. Inspired by [3] we have chosen to measure the following criteria when evaluating our ideas: • Reaction speed, that is the ability to detect faults with reasonably small delays after their arrivals. • Robustness, that is the ability to operate in the presence of noise, disturbances and modeling errors, with few false alarms. • Isolation performance, that is the ability to distinguish between faults. These evaluation criteria is common within the fault detection and isolation literature and highly used within the automation industry. Therefore, these are relevant also within the mobile robotics domain. Reaction speed is necessary if the robot moves quickly, robustness is measured since the robots are affected by noise and disturbances, and isolation power is needed in order to make adequate recovery from the fault.
Follow
0.5
Reach
0.5
Orient
IEEE TRANSACTIONS ON SYSTEMS, MAN, AND CYBERNETICS—PART B: CYBERNETICS, VOL. 37, NO. 4, 890–901
0.5
TABLE I
1
0 1
0 1
0
Face
0.5
Cross
1
0.5
0 1
0
Avoid Still
1 0.5
0.5
0 1
0
9
0
20
40
60
80
100
120
0
20
40
60
80
100
120
0
20
40
60
80
100
120
0
20
40
60
80
100
120
0
20
40
60
80
100
120
0
20
40
60
80
100
120
0
20
40
60
80
100
120
Fault UCD Fault DCD Success
20
40
60
80
100
120
Fig. 13. An example of the undetected closed door scenario. Top: The merged activation levels. Bottom: The output signal from the execution monitor. Time is given in seconds.
The reaction speed depends on the number of samples that are stored within the time window. Since the sampling rate w is 10 Hz, the reaction speed is given as 10 seconds, where w denote the size of the window. The performance in robustness and isolation is here calculated by evaluating the mean error ¯ and the standard error deviation s. In order to get unbiased E statistical measures, the leave-one-out procedure [38] was used. In this method, data from one simulation run is left out and used for testing and the rest is used for training. This procedure is then repeated until all simulation runs have been left out once for testing. During the simulated experiments we have first compared two different pattern recognition methods for model-free execution monitoring: a multivariate statistical approach, that is, the mPCA together with MLR, and the hierarchical approach including two RBF networks. Since the latter approach showed significant better results this was investigated further. For all details on the statistical pattern recognition approach see [39]. One reason why the latter approach is better is that the classification has nonlinear discrimination power. Another reason is that fault detection and fault isolation, when separated, can use two independently optimized feature extraction methods. The hierarchical approach (see Figure 11) has then been used in order to evaluate different feature extraction methods. Four different feature extraction methods were evaluated in order to optimize the performance. The median performed best for fault detection and energy performed best for fault isolation. In Table I and II the performance using energy and median for feature extraction is presented. We have omitted the performance measures from CUSUM and sample variance, since these feature extraction methods provided significantly worse results. As can be seen in Table I and II, the robustness is improved when a larger time window, that is, a slower
M ONITORING PERFORMANCE WHEN ENERGY IS CHOSEN FOR FEATURE EXTRACTION . Reaction speed Robustness False alarms Missed alarms Isolation performance Fault DCD Fault UCD
Time 2s
Time 4s
Time 10 s
¯ E 0.095 0.111 ¯ E
s 0.079 0.054 s
¯ E 0.107 0.096 ¯ E
s 0.073 0.053 s
¯ E 0.036 0.097 ¯ E
s 0.058 0.110 s
0.075 0.012
0.089 0.038
0.086 0.007
0.208 0.032
0.089 0.028
0.162 0.023
TABLE II M ONITORING PERFORMANCE WHEN MEDIAN IS CHOSEN FOR FEATURE EXTRACTION . Reaction speed Robustness False alarms Missed alarms Isolation performance Fault DCD Fault UCD
Time 2s
Time 4s
Time 10 s
¯ E 0.083 0.104 ¯ E
s 0.049 0.047 s
¯ E 0.096 0.116 ¯ E
s 0.078 0.062 s
¯ E 0.079 0.071 ¯ E
s 0.131 0.075 s
0.078 0.019
0.120 0.038
0.101 0.011
0.175 0.049
0.055 0.017
0.173 0.026
reaction speed, is used. This means, there is a trade-off between reaction speed and robustness. C. Real Robot Experiments One disadvantage of using model-free execution monitoring is that it is not always feasible to force the robot into all known fault situations during the learning phase. Some fault situations can be catastrophic for either the robot or people in the environment. An interesting solution to this problem could be to let the execution monitor learn the fault classes safely in simulation and then apply the system to a real robot. In these experiments we will evaluate if this learning from simulation approach is a feasible solution to the problem. Since our Nomad 200 robot that is simulated is retired, one of our Magellan Pro robots (shown in Figure 14) is used in the real robot experiments instead. The Nomad 200 and the Magellan Pro are equipped with similar sensors (a ring of 16 sonars) and motion (synchronous drive in one case, differential drive in the other). They also both run the same robot control architecture. However, notice that no information about the robot platform, the environment, or the plans are used within the execution monitoring system. The monitor only takes as input the vector of all the behavior activation levels in the controller. In our experiment, we have trained the execution monitor in the simulator of one type of robot platform, and we have then ported it directly to the real robot without any modifications. The real robot experiments were performed in an environment that was never used in simulation. When the robot is located at the starting point in corridor C1 and is given the navigation task: “Go to room R3 ,” the Thinking Cap creates a B-plan containing 8 context rules. The B-plan is shown in Figure 15.
Orient
Reach
Follow
IEEE TRANSACTIONS ON SYSTEMS, MAN, AND CYBERNETICS—PART B: CYBERNETICS, VOL. 37, NO. 4, 890–901
1 0.5 0 0 1
0 0 1
Face Cross
20
30
40
50
60
10
20
30
40
50
60
10
20
30
40
50
60
10
20
30
40
50
60
10
20
30
40
50
60
10
20
30
40
50
60
0.5
0.5 0 0 1 0.5 0 0 1
Still
10
0.5
0 0 1
0.5 0 0
Fig. 14.
10
Our mobile robot reaches a closed door. Fault UCD Fault DCD
1 2 3 4 5 6 7 8
Context at(goal) near(goal) ∧ ¬at(goal) at(R3 ) ∧ ¬near(goal) at(C1 ) ∧ open(D3 ) ∧ f acing(D3 )∧ oriented(D3 ) ∧ ¬at(R3 ) ¬at(R3 ) ∧ at(C1 ) ∧ open(D3 )∧ ¬oriented(D3 ) near(D3 ) ∧ ¬at(R3 ) ∧ at(C1 )∧ open(D3 ) ∧ ¬f acing(D3 ) at(C1 ) ∧ traversable(C1 )∧ oriented(D3 ) ∧ ¬near(D3 ) ¬near(D3 ) ∧ at(C1 )∧ traversable(C1) ∧ ¬oriented(D3 )
Behavior S TILL (goal) R EACH (goal) R EACH (goal) C ROSS (D3 )
Success
10
20
30
40
50
60
Fig. 16. An example of the detected closed door scenario. Top: After some time all behaviors, except for R EACH, become inactive. Bottom: The output signal from the execution monitor, indicating fault DCD after approximately 12 seconds. The time is given in seconds.
O RIENT (D3 ) FACE (D3 ) F OLLOW (C1 ) O RIENT (C1 )
Fig. 15. The B-plan containing 8 context rules created for the task “Go to room R3 .”
Each scenario, that is, success, fault DCD, and fault UCD, is tested three times using our Magellan Pro robot. Figure 16 and Figure 17 show examples from execution of the detected closed door, and the undetected closed door scenarios, respectively. Each figure is divided into two sub figures: The top figure shows the merged activation levels that are used as inputs to the execution monitor, and the bottom figure shows the corresponding output given from the execution monitor. The success scenario is not shown in a figure because of the limited available space. This scenario is 100 % correctly classified by the execution monitor. An example of the detected closed door scenario is shown in Figure 16. In this scenario almost all behaviors become inactive when the door is detected closed and the robot cannot proceed its execution of the plan. The fact that the goal point is located just on the other side of the closed door confuses the R EACH behavior. Therefore this behavior is still activated even thought the door is closed. Nevertheless, this scenario is also 100 % correctly classified by the execution monitor. In Figure 17 an example of the undetected closed door scenario is shown. Here the activation levels of the behaviors R EACH, O RIENT, and FACE are oscillating when the robot keeps on trying to cross the closed door. In this scenario the execution monitor has some problems in determining the
correct output. Here a little more than 20 % of the execution time is misclassified. VI. D ISCUSSION The main contribution of the paper is that it is the first systematic introduction of model-free approaches into the robotics field. Our approach is intended as a complement to model-based approaches that are by far the most commonly used approaches within mobile robotics. Our approach is basically founded on only one assumption, namely: the use of behaviors with activation levels. In virtually all other matter the work is neither dependent on the architecture nor the robot. This is accomplished since the model-free monitoring approach only incorporates knowledge about the relation between the activation levels of the behaviors, and the fault classes. Since models of the robot structure or the robot’s capabilities are not used, no assumptions about the architecture or the robot are needed. As depicted in Figure 2, model-free execution monitoring can be performed by observing the sensor data coming from the robot, and classifying it into normal and faulty patterns. In our work, we observe behavior activation levels instead of sensor data. While these levels depend on the sensor data, they represent a higher level of abstration, which also reflects what action the robot is currently doing, that is, its intentions. For example, our monitor could discriminate between successful docking and faulty obstacle avoidance, even though the patterns in the raw sensor data would be similar in both cases. Model-free execution monitoring is particularly suitable in systems where it is difficult to obtain adequate models. This is
Orient
Reach
Follow
IEEE TRANSACTIONS ON SYSTEMS, MAN, AND CYBERNETICS—PART B: CYBERNETICS, VOL. 37, NO. 4, 890–901
1
Face Cross
20
30
40
50
60
70
10
20
30
40
50
60
70
10
20
30
40
50
60
70
10
20
30
40
50
60
70
10
20
30
40
50
60
70
10
20
30
40
50
60
70
VII. C ONCLUSIONS
0.5 0 0 1 0.5 0 0 1 0.5 0 0 1 0.5 0 0 1
Still
10
trations, flows etc are measured [42]. Here it is really hard to connect one particular variable to a problem. Model-free execution monitoring is by no means meant to replace model-based execution monitoring, but to complement it. Since the model-free approaches have some complementary advantages to the model-based approaches they could be used simultaneously in order to combine their respective strengths. Such hybrid monitors are rarely seen in the robotics literature. A hybrid monitor could, for instance, be realized by a neurofuzzy expert system, where the IF-THEN rules are compiled by a human expert, and the membership functions are trained by an artificial neural network [4].
0.5 0 0 1
11
0.5 0 0
Fault UCD Fault DCD Success
10
20
30
40
50
60
70
Fig. 17. An example of the undetected closed door scenario. Top: The oscillating behavior performed by R EACH, O RIENT, and FACE. Bottom: The output signal from the execution monitor. The time is given in seconds.
shown, for example, in the survey given by [40] where modelbased methods have their best application areas in mechanical systems where the models of the processes are relatively precise. Finally, we believe that the usability for a service robot will benefit from this approach. Most probably it is easier for the user to train the robot by telling what is success or fault, instead of compiling detailed predictive models in a formal language. According to [41] learning is easier than hand coding the logic expressions for every success and fault state. The proposed approach relies on a human expert to classify normal and faulty execution of the robot. If the number of faults increase this could be a tedious work for the human teacher. An interesting extension to this approach would be to allow the system to keep learning new faults in an openended way, using existing techniques for life-long learning [43], [44]. However, it should be noted that the end user of the robot does not need to teach the robot all possible normal and faulty behaviors. Instead, the robot might be equipped with a factory installed knowledge-base of normal and faulty behavior. Users can optionally complete this knowledge by teaching additional classes of normal and faulty behaviors peculiar to their application. To scale up with the number of faults is a common problem in fault detection and isolation. Often the number of measured variables must increase in order to detect and isolate an increased number of faults. In the same manner more complex faults are handled by introducing new variables. Unfortunately, an increased number of variables makes it difficult to obtain adequate models. Therefore, model-free monitoring is suitable in systems where many or complex faults has to be isolated. This is why model-free monitoring are often preferred in the chemical industry, where thousands of temperatures, concen-
In this work we have introduced the idea of model-free execution monitoring in behavior-based robotics. Model-free execution monitoring does not use predictive models to compare the expected and the actual states of execution. Instead, the monitoring system solely observes the actual behavior of the monitored system, and classifies these observed behavioral patterns into normal or faulty execution. Two standard pattern recognition approaches have been evaluated: multivariate statistics, and RBF networks. Several experiments, including both simulated and real robots, show that this approach is a promising complement to model-based monitoring. Intentionally, we have chosen standard techniques from the pattern recognition literature for feature extraction and classification. If instead new pattern recognition techniques, optimized for a specific domain, were used the monitoring performance might be increased significantly. Although, this was outside the scope of this paper. ACKNOWLEDGMENT The authors are grateful to Joachim Hertzberg for enlightening discussions. Many thanks as well to the anonymous reviewers for their detailed and constructive comments. This work was partly supported by the Swedish Research Council and by the Swedish Knowledge Foundation. R EFERENCES [1] V. Verma, G. Gordon, R. Simmons, and S. Thrun, “Real-time fault diagnosis,” IEEE Robotics and Automation Magazine, vol. 11, no. 2, pp. 56–66, 2004. [2] O. Pettersson, “Execution monitoring in robotics: A survey,” Robotics and Autonomous Systems, vol. 53, no. 2, pp. 73–88, 2005. [3] J. Gertler, Fault Detection and Diagnosis in Engineering Systems. New York, NY, USA: Marcel Dekker, 1998. [4] B. Huallpa, E. N´obrega, and F. von Zuben, “Fault detection in dynamic systems based on fuzzy diagnosis,” in Proceedings of the IEEE International Conference on Fuzzy Systems, New York, NY, USA, 1998, pp. 1482–1487. [5] R. Fikes, P. Hart, and N. Nilsson, “Learning and executing generalized robot plans,” Artificial Intelligence, vol. 3, no. 4, pp. 251–288, 1972. [6] M. Georgeff and A. Lansky, “Reactive reasoning and planning,” in Proceedings of the National Conference on Artificial Intelligence (AAAI), Seattle, WA, USA, 1987, pp. 677–682. [7] K. Konolige, K. Myers, E. Ruspini, and A. Saffiotti, “The Saphira architecture: A design for autonomy,” Journal of Experimental and Theoretical Artificial Intelligence, vol. 9, no. 1, pp. 215–235, 1997. [8] K. Myers, “CPEF: A continuous planning and execution framework,” AI Magazine, vol. 20, no. 4, pp. 63–69, 1999.
IEEE TRANSACTIONS ON SYSTEMS, MAN, AND CYBERNETICS—PART B: CYBERNETICS, VOL. 37, NO. 4, 890–901
[9] F. Noreils and R. Chatila, “Plan execution monitoring and control architecture for mobile robots,” IEEE Transactions on Robotics and Automation, vol. 11, no. 2, pp. 255–266, 1995. [10] D. Wilkins, T. Lee, and P. Berry, “Interactive execution monitoring of agent teams,” Journal of Artificial Intelligence Research, vol. 18, pp. 217–261, 2003. [11] R. Firby, “An investigation into reactive planning in complex domains,” in Proceedings of the National Conference on Artificial Intelligence (AAAI), Seattle, WA, USA, 1987, pp. 202–206. [12] R. Firby, R. Kahn, P. Prokopowicz, and M. Swain, “An architecture for vision and action,” in Proceedings of the International Joint Conference on Artificial Intelligence (IJCAI), Montreal, QC, Canada, 1995, pp. 72– 79. [13] R. Firby, P. Prokopowicz, and M. J. Swain, “The animate agent architecture,” in Artificial Intelligence and Mobile Robots, R. Bonasso, D. Kortenkamp, and R. Murphy, Eds. MIT Press, 1998, pp. 243–275. [14] R. Simmons, J. Fernandez, R. Goodwin, S. Koenig, and J. O’Sullivan, “Lessons learned from Xavier,” IEEE Robotics and Automation Magazine, vol. 7, no. 2, pp. 33–39, 2000. [15] R. Simmons and D. Apfelbaum, “A task description language for robot control,” in Proceedings of the IEEE International Conference on Intelligent Robots and Systems (IROS), Victoria, BC, Canada, 1998, pp. 1931–1937. [16] J. Fern´andez and R. Simmons, “Robust execution monitoring for navigation plans,” in Proceedings of the IEEE International Conference on Intelligent Robots and Systems (IROS), Victoria, BC, Canada, 1998, pp. 551–557. [17] B. Williams and P. Nayak, “A model-based approach to reactive selfconfiguring systems,” in Proceedings of the National Conference on Artificial Intelligence (AAAI), Cambridge, MA, USA, 1996, pp. 971– 978. [18] J. Kurien and P. Nayak, “Back to the future for consistency-based trajectory tracking,” in Proceedings of the National Conference on Artificial Intelligence (AAAI), Austin, TX, USA, 2000, pp. 370–377. [19] M. Veloso, M. Pollack, and M. Cox, “Rationale-based monitoring for planning in dynamic environments,” in Proceedings of the International Conference on Artificial Intelligence Planning Systems (AIPS), Pittsburgh, PA, USA, 1998, pp. 171–179. [20] G. Kaminka, D. Pynadath, and M. Tambe, “Monitoring teams by overhearing: A multi-agent plan-recognition approach,” Journal of Artificial Intelligence Research, vol. 17, pp. 83–135, 2002. [21] K. Lamine and F. Kabanza, “History checking of temporal fuzzy logic formulas for monitoring behavior-based mobile robots,” in Proceedings of the IEEE International Conference on Tools with Artificial Intelligence, Los Alamitos, CA, USA, 2000, pp. 312–319. [22] O. Pettersson, “Model-free execution monitoring in behavior-based ¨ mobile robotics,” Ph.D. Thesis, Orebro University, Department of Tech¨ nology, Orebro, Sweden, 2004. [23] E. Gat, M. Slack, D. Miller, and R. Firby, “Path planning and execution monitoring for a planetary rover,” in Proceedings of the IEEE International Conference on Robotics and Automation (ICRA), Cincinnati, OH, USA, 1990, pp. 20–25. [24] A. Saffiotti, K. Konolige, and E. Ruspini, “A multivalued-logic approach to integrating planning and control,” Artificial Intelligence, vol. 76, no. 1–2, pp. 481–526, 1995. [25] S. Parsons, O. Pettersson, A. Saffiotti, and M. Wooldridge, “Robots with the best of intentions,” in Artificial Intelligence Today: Recent Trends and Developments, ser. Lecture Notes in Artificial Intelligence, M. Wooldridge and M. Veloso, Eds. Berlin, Germany: Springer-Verlag, 1999, no. 1600, pp. 329–338. [26] R. Dearden, F. Hutter, R. Simmons, S. Thrun, V. Verma, and T. Willeke, “Real-time fault detection and situational awareness for rovers: Report on the mars technology program task,” in Proceedings of the IEEE Aerospace Conference, Big Sky, MT, USA, 2004, pp. 826–840. [27] J. Hertzberg, H. Jaeger, and F. Sch¨onherr, “Learning to ground fact symbols in behavior-based robots,” in Proceedings of the European Conference on Artificial Intelligence (ECAI), Amsterdam, Netherlands, 2002, pp. 708–712. [28] R. Arkin, Behavior-Based Robotics. Cambridge, MA, USA: MIT Press, 1998. [29] R. Isermann, “Supervision, fault-detection and fault-diagnosis methods: An introduction,” Control Engineering Practice, vol. 5, no. 5, pp. 639– 652, 1997. [30] A. Saffiotti, “The Thinking Cap official home page,” Available: http://www.aass.oru.se/˜asaffio/Software/TC/, December 2005. [31] S. Theodoridis and K. Koutroumbas, Pattern Recognition. London, UK: Academic Press, 2003.
12
[32] R. Johnson and D. Wichern, Applied Multivariate Statistical Analysis. Upper Saddle River, NJ, USA: Prentice-Hall, 1998. [33] S. Ross, Introduction to Probability and Statistics for Engineers and Scientists. San Diego, CA, USA: Academic Press, 2000. [34] C. Bishop, Neural Networks for Pattern Recognition. Oxford, UK: Oxford University Press, 1995. [35] S. Chen, C. Cowan, and P. Grant, “Orthogonal least squares learning algorithm for radial basis function networks,” IEEE Transactions on Neural Networks, vol. 2, no. 2, pp. 302–309, 1991. [36] E. Applebaum, “Fuzzy classification for fault isolation in gas turbine engines,” in Proceedings of the International Fuzzy Systems Association Congress (IFSA), Vancouver, BC, Canada, 2001, pp. 292–297. [37] Nomadic, User’s Manual, Nomadic Technologies, Inc., Mountain View, CA, USA, March 1997. [38] K. Fukunaga and D. Hummels, “Leave-one-out procedures for nonparametric error estimates,” IEEE Transactions on Pattern Analysis and Machine Intelligence, vol. 11, no. 4, pp. 421–423, 1989. [39] O. Pettersson, L. Karlsson, and A. Saffiotti, “Steps towards modelfree execution monitoring on mobile robots,” in Swedish Workshop on Autonomous Robots (SWAR 02), Stockholm, Sweden, 2002, pp. 45–52. [40] R. Isermann and P. Ball´e, “Trends in the application of model-based fault detection and diagnosis of technical processes,” Control Engineering Practice, vol. 5, no. 5, pp. 709–719, 1997. [41] M. Ghallab, “On chronicles: Representation, on-line recognition and learning,” in Proceedings of the International Conference on Principles of Knowledge Representation and Reasoning, Cambridge, MA, USA, 1996, pp. 597–606. [42] L. Chiang, E. Russell, and R. Braatz, Fault Detection and Diagnosis in Industrial Systems. London, UK: Springer-Verlag, 2001. [43] D. Aha, Lazy Learning. Berlin, Germany: Springer-Verlag, 1997. [44] S. Thrun, “A lifelong learning perspective for mobile robot control,” in Proceedings of the IEEE International Conference on Intelligent Robots and Systems (IROS), Munich, Germany, 1994, pp. 23–30.
Ola Pettersson is currently employed at Saab Underwater Systems in Motala, Sweden. Here he is involved in the development of autonomous underwater vehicles. He received a M.S. in Electrical Engineering from the Halmstad University, Sweden, in 1995. In 2004 he received a Ph.D. in Computer ¨ Science from the Orebro University, Sweden. His research interests include autonomous mobile robotics, execution monitoring, and pattern recognition.
Lars Karlsson is a senior researcher at the AASS ¨ Mobile Robotics lab at Orebro University, Sweden, since 1999. In his research, he applies artificial intelligence techniques, in particular planning, to mobile robotics. He received a M.S. in Computer Science in 1993 and a Ph.D. in Computer Science in 1999, both at Link¨oping University.
Alessandro Saffiotti is full professor of Computer ¨ Science at the Orebro University, Sweden, where he heads the AASS Mobile Robotics lab since 1998. He received a M.S. in Computer Science from the University of Pisa, Italy, and a Ph.D. in Applied Science from the Universit´e Libre de Bruxelles, Belgium. His research interests encompass artificial intelligence, autonomous robotics, and soft computing. He has published more than 100 papers in international journals and conferences, and co-edited the book “Fuzzy logic techniques for autonomous vehicle navigation” (Springer, 2001). He is a senior member of IEEE.