Model Oriented Programming: An Empirical Study of Comprehension Omar Badreddin, Andrew Forward, Timothy C. Lethbridge School of Electrical Engineering and Computer Science University of Ottawa, Canada IBM Canada CAS Research, Markham, Ontario, Canada
[email protected], {aforward,tcl}@site.uottawa.ca
Abstract
1 Introduction
Many tools and approaches support the use of modeling abstractions in textual form. However, there have been few studies about whether textual models are as comprehensible as graphical models. We present an experiment investigating the understandability of three different notations: Systems modeled in UML, and the same systems in both Java and Umple. Umple is a modeloriented programming technology that enhances languages like Java and PHP with textual modeling abstractions. It was designed to bridge the gap between textual and graphical modeling. Our experiment asked participants to answer questions reflecting their level of comprehension. The results reveal that for simple comprehension tasks, a visual model and a textual model are comparable. Java’s comprehension levels were lowest of all three notations. Our results align with the intuition that raising the abstraction levels of common object-oriented programming languages enhances comprehensibility.
UML has emerged as the defacto standard for representation of software engineering models. It is widely accepted that using visual modeling approaches, such as UML, gives favorable results in the creation and maintenance of software. At the same time, there is evidence that the adoption of visual modeling in software engineering remains low [1]. The open source community remains almost entirely code centric. The following are some modeling notations that use a textual form. Object Management Group (OMG), the organization that manages the UML standards, has proposed in the past HUNT, a textual notation for UML class diagrams [2]. More recently it proposed Alf [3], a concrete textual syntax for UML action semantics, Ruby, Ruby on Rails ActiveRecord, and some Ruby ‘Gems’, support certain UML modeling abstractions in textual form, [4] [5] [6]. Other textual modeling approaches includes MetaUML [7], yUML [8], TextUML [9], State Machine Compiler (SMC) [10], AsmL [11], and Executable UML [12]. This growing number of textual modeling tools reflects the increasing recognition of the value of textual modeling paradigms. However, such trends are faced with little to no scrutiny. Very little, if any, of the tools have been empirically evaluated. Umple [13], to be discussed and evaluated in this paper, is the textual modeling approach developed in our lab, with the objective of being highly usable and easy to adopt by all types of developers, including programmers and modelers.
1
Copyright 2012 Omar Badreddin, Andrew Forward and Timothy C. Lethbridge. Permission to copy is hereby granted provided the original copyright notice is reproduced in copies made.
There is little evidence about the extent to which the various approaches enhance or hinder comprehension. For example, there are a number of studies that indicated gains in comprehensibility when using visualizations while others report that graphics were significantly slower than text in experimental comprehension tasks [14]. In this paper we empirically evaluate understandability of Umple by comparing systems written in Umple to the equivalent UML, as well as equivalent systems implemented in Java. Our objective is to investigate whether the UML diagrammatic form has a comprehensibility advantage (or vice-versa), compared to their textual form in Umple. We used Java versions as a third point of comparison. If Umple was less understandable than UML, we wanted to see where its understandability fits on the scale between pure model (UML) and pure code (Java). We created representations of semanticallyequivalent small systems using UML, Umple and Java. These were presented to participants who were asked to answer straightforward comprehension questions. By measuring the participants’ response times, we should be able to infer the extent to which each notation aided the subjects’ comprehension of the system. The literature is rich with theoretical work on notation comprehension. The Cognitive Dimensions framework [15], for example, provides valuable perspective on notation and comprehension. The work presented in this paper complements this with empirical results.
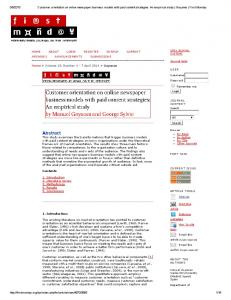
2.1 UML Models Used UML class diagrams (e.g. Figure 1) were used to describe the static view of the systems used in this experiment. The main elements of the class diagram are classes and associations. State machine diagrams (e.g. Figure 2) were used to describe the behavioral aspects of the systems. The main elements are states and transitions.
hold : Boolean
Figure 1: UML class diagram for a system used in the experiments
2 Experiment Goals and Definitions The goal of this experiment is to evaluate the Umple textual modeling notation in comparison with UML and Java. An objective of Umple is that it should have advantages of both visual modeling (UML) and textual programming (i.e. Java). This experiment, seeks to validate the hypothesis that Umple has retained the advantages of UML with respect to comprehension. We leave it as separate research to assess whether Umple has also retained any advantages of textual programming such as ease of editing and searching.
Figure 2: UML state machine diagram for the Student class
class Person { } class Supervisor extends Person { List mentees = new ArrayList(); Supervisor() {} } class Student extends Person { private int stNum; boolean hold; private int status; private Supervisor mySupervisor;
public Student(int stNum) { this.stNum= stNum; status=0; } public int stNum() {return stNum;} public void enroll() { if (!hold){ if(status ==0) status=1;} } public void graduate() { if(status==1) { removeSupervisor(); status=2; } } public void quit(){ removeSupervisor(); status=3; } public boolean setSupervisor(Supervisor newSupervisor) { } public boolean removeSupervisor(){ } }
Listing 1: Sample Java implementation of the same system given in Figures 1 and 2
2.2 Java Representation of
the Systems Listing 1 shows now the UML models in (Figure 1) and (Figure 2) are represented in Java. The semantics are the same as in the UML, so Supervisor and Student inherit from Person. The association between supervisor and student is implemented as a List of students.
2.3 The Umple Modeling
Approach Listing 2, below, is the UML model represented in Umple, including both the class diagram (corresponding to Figure 1), and the state machine (corresponding to Figure 2): Umple uses a notation similar to Java to add modeling abstractions to Java and other languages, with the objective of attracting programmers to modeling, and also speeding up modeling for those who currently use diagrams. Listing 2 includes both a state machine called ‘status’ (from Figure 2)
and an association of many (*) Students to an optional (0..1) Supervisor. We designed Umple’s syntax to be as intuitive as possible to those who know UML. The experiment in this paper was designed to gather evidence about whether we have been successful at making Umple usable.
class Person { } class Student { isA Person; Integer stNum; status { Applied { quit -> Quit; enroll [!hold] -> Enrolled; } Enrolled { quit -> Quit; graduate-> Graduated; } Graduated {} Quit {} } * -- 0..1 Supervisor; } class Supervisor { isA Person; }
Listing 2: Umple notation for Figures 1 and 2
2.3.1 Umple Essentials To enable the reader to better understand this paper, we provide here a few additional details about Umple. Several core philosophies have guided the development of Umple [16] [17]. The first of these is that programming is a form of modeling and vice-versa, with modeling simply allowing greater abstraction. Umple has made this concrete by enabling programming using modeling concepts (e.g. associations and state machines) directly in existing programming languages. Umple allows the developer to use both a diagrammatic form of his or her model (UML diagrams) or the Umple textual form simultaneously and interchangeably, with instant conversion of one form to the other, keeping both visible on the screen.
Umple generates code following UML semantics in all but a few exceptional cases (which are not of relevance in this study). Umple has many features that are beyond the scope of this paper. The reader is urged to visit the Umple User manual [18] to learn about the complete set of features. However, below we will briefly explain two key features of relevance: associations and state machines. A programmer using Umple can start by creating a pure model, using just UML elements. Then he or she can write methods in the base programming language (here Java) that are interspersed with the UML modeling elements. These methods would call the API [19] Umple generates from each UML element, in order to do such tasks as adding a link of an association, or triggering an event in a state machine. Umple can also be used in the reverse manner: Starting with an existing system, and converting (umplifying) parts of the code to raise its level of abstraction [17].
2.3.2 Umple’s Rendering of UML
parsimoniously with variables, methods and other language features. Listing 2 shows the Status state machine. Within its body are four states, each shown as the state name and the state body within curly brackets. States can be nested indefinitely, and indeed each state is a state machine in its own right if it has nested sub-states. A state machine can be treated as a variable: The state can be accessed programmatically and has an enumerated type (one value per state). But the key benefit of a state machine is that changes in state occur in response to events. Transitions from state to state are shown using the syntax: event-name -> destination-state-name;
This results in a method being generated for each event name. Such event methods can be called by any method that the user writes. Various other UML constructs can be added to a transition. The following is the syntax for a transition with transition action code:
Associations A UML association is rendered in Umple using a notation that appears as close as possible to the visual notation in a UML class diagram. An example can be seen in the last line of class Student in listing 2. The ‘--’ indicates an association textually (shown as a line in Figure 1). The UML multiplicity is given at either end of this, and the class at the ‘other end’ of the association (Supervisor in this case) follows. The association in Listing 2 is embedded directly in the class Student. Umple allows other possibilities, such as embedding the association in class Supervisor, having the association ‘on its own’ (not embedded in either class), using role names (as specified in UML), and making the association navigable in one direction only using the notation ‘->’ instead of ‘--’.
2.3.3 Umple Rendering of UML State Machines As shown in Listing 2, a state machine in Umple is declared using the state machine name, with its body in curly brackets. This notation is distinct from other syntactic elements in languages such as Java, so it allows state machines to blend in
event-name -> /{transition-action-code} destinationstate-name;
In our example, the transition action code is written in Java. The ‘Applied’ state in Listing 2 also shows the use of a UML guard in square brackets. Please refer to [13] for more details about Umple. Tutorial videos can be found at [20] [21]. Additional peer-reviewed papers about Umple can be found at [22] [23] [24] [25]; the latter two are a grounded theory study and an empirical study into teaching with Umple.
3 Experiment Design The evaluation of notation comprehension was achieved using a controlled experiment. The treatment was the modeling notation with three possible values: UML, Java, and Umple. Each participant was presented with an instance of each modeling notation. To minimize any learning effect, participants were presented with different systems for each of the three notations, and the order of the modeling notation and other factors were varied among
participants. This is discussed in more detail in the following sections. 2.
3.1 Design Considerations We discuss some design considerations that will clarify the philosophy behind the experiment design and aid replication of this study.
3.1.1 Fairness of Comparing UML, Umple, and Java At first sight, the comparison performed in this experiment may seem ‘unfair’ due to the mixing of visual and textual notations, one of which (Umple) will be new to participants. Let’s consider the comparison pair wise, starting with Umple-Java. Both Umple and Java are programming languages that support the implementation of complete running systems. As a matter of fact, in the extreme case, any Umple code without any modeling abstractions is the same as Java and can be compiled using a Java or an Umple compiler. Expressed another way, Umple is Java with additional modeling abstractions. Therefore, comparing Umple to Java should reveal whether adding modeling abstractions to a programming language like Java would enhance comprehensibility. Now we consider the pair UML and Umple. There are two differences with respect to this pair. First, Umple is a textual notation while UML is a mainly visual notation. The second difference is that Umple has additional implementation code, while UML is model-only. In fact, Umple without any Java code (modeling abstractions only) is semantically equivalent to UML. In our experiment, we used Umple with Java implementation code. And since the UML questions are only model-related, this design puts Umple at a disadvantage compared to UML. This disadvantage does not affect our hypotheses as discussed in later sections.
by participants reflects cognitive processing of the notation. We place emphasis of the notation rather than the technical expertise of the participants.
During the pilot study, we tested longer and more complex questions and noted that participants spent more time understanding the questions themselves, and in some cases had misunderstandings about some of the more complex questions. Consequently, the number of incorrect responses was excessive. This led is to focus on shorter, simpler questions for greater validity.
3.1.3 System Example Complexity The system examples used in the experiment are notably simple. Just like with the questions, we piloted the experiment with more complex system examples and noted the following. First, not all participants were aware of some of the modeling notations of UML that are also found in Umple, particularly certain aspects of state machines. Using simple examples meant that the training videos could be kept shorter and simpler. Second, using more complex examples would have meant that question and answer sessions would have taken a longer time. We targeted an experiment duration of a maximum of one hour to avoid the threat of participants’ boredom. Third, complex system examples would have meant that the experiment may be measuring the participant’s technical skills rather than measuring notation comprehension. Fourth, one of the experiment design principles is to minimize the number of incorrect answers. Complex examples would have resulted in more incorrect answers by participants. However, we see the value of conducting additional experimentation with more realistic complex system examples. We leave this for future work.
3.1.2 Question Length
3.1.4 Handling of Incorrect Answers
Questions are on purpose short and are expressed in as simple language as possible. This aspect of the experiment serves two purposes.
Despite the system examples and questions being relatively simple, there were still incorrect responses by participants. We measured the number of incorrect responses, which were to a large extent equally distributed across notations, system examples, and participants. There was no
1.
Participants spend negligible amount of time understanding the question itself. This enhances our confidence that the time taken
evidence of any significant effect of a certain experiment treatment on the number of errors. When a participant gave an incorrect answer, he was informed that his answer is incorrect and that he should try again. The time duration starting from posing an incorrect response to the time the participant is informed of the incorrect response is excluded when analyzing the results.
3.2 Experiment Objects The set of experimental objects consisted of nine artifacts which were comprised of three example systems of comparable complexity, written in the three notations (UML, Java, and Umple). Three of the system examples used names derived from the domain (student-supervisor domain), while the remaining six models used abstract names (i.e. a, b, c as variable and class names). Abstract names were used since we wanted to test the ‘pure’ comprehensibility of the notations, and wanted to avoid the threat to validity that people might understand the system simply because they understand the underlying domain. On the other hand, we also used names derived from the domain for one system to reduce the opposite threat to validity, which is that systems with abstract names are less realistic. Prior to use in the experiment, the example systems and the renderings of the systems in each notation were reviewed by three professionals independent of the research team to validate that were all of roughly similar complexity. Tables 1 and 2 provide summaries of the number of modeling elements in each example system.
Figure 1, Figure 2, Listing 1, and Listing 2 together show the reader what the first example system of this experiment looked like.
3.3 Question Lists The experiment included 9 question lists, one question list per example system. Listing 3 is the question list for the first example system. Questions posed for Java versions of the systems used slightly different wording than was used for UML and Umple versions, to reflect the way people would naturally speak about constructs in Java vs. UML. For example, the Java version for question number 4 below is phrased as ‘Assume the value of the attribute status is Applied, and the value of hold is true. What happens when the method enroll is invoked?’ Q 1
2
3 4
5
Table 1. : Class diagram concept summary System
Classes
Associations
Attributes
One
3
3
3
Two
3
3
3
Three
3
2
1
6 7
8
Table 2. State machine concept summary
9
System
State
Transition
Guard
Event
Action
One
4
4
1
3
1
10
Two
4
4
1
3
1
11
1
5
5
Three
3
5
Question Let’s assume the state machine is in the Applied state and hold is false. Also assume the following events occurred in sequence, enroll, quit, enroll. What is the resulting state? Assume the student has one supervisor. Can you add another supervisor to the same student? Assume a supervisor has 6 students. Can we add another student to this supervisor? Assume the state machine is in the Applied state, and the value of hold is true. What happens when the event enroll occurs? How many students can a supervisor have? What are the possible states the state machine status can have? What actions are called when the following transition occurs : From Applied to Enrolled Can the state machine go directly from Quit to Enrolled? Can the state machine go from Graduated to Applied? Assume we are in the Applied state, what happens when the event graduate occurs? Can you create a Person Object?
12
Assume the state machine is in the Applied state. Also assume the following events occur in sequence: graduate, quit, quit, enroll. What is the resulting state?
Listing 3: Question list for the first example system The full set of question lists, all experimental objects (code, models, diagrams), plus the raw result data are publicly available [26], with identifying data removed, to allow for additional analysis by others.
The experiment, by design, tends to keep the second dependent variable (number of incorrect responses) zero, or close to zero, by making the questions reasonably straightforward, keeping the example systems small, and allowing the participants adequate time to give a correct response. This is to make sure that we are not measuring the technical competency of subjects, but rather, the notation’s effect on comprehension. There are a number of extraneous variables whose effect we tried to eliminate or minimize. These variables are: •
3.4 Experiment Participants The study reported here was carried out using software engineering and computer science students, as well as software engineering industry professionals. In total, nine participants were recruited; seven had a PhD degree in a related field, one had a master’s degree, and one had bachelor’s degree. Their average knowledge of Java was the highest (3.3/5.0) followed by UML (2.7/5.0) followed by Umple (1.7/5.0). None of the participants reported being more familiar with Umple than UML or Java. Most participants were more familiar with Java than UML (5/9) and some were as familiar with UML as with Java (4/9). At the beginning of the experiment, participants were shown two short videos [21, 27] introducing UML and Umple concepts. Given this familiarity background, we should not expect participant’s background to influence the experiment results in favor of Umple. Participants were recruited randomly. Participation was both anonymous and voluntary. Participants were not compensated for their participation.
3.5 Experiment Variables The independent variable is the notation with values: ‘UML’, ‘Java’, and ‘Umple’. The example is varied to minimize the learning effect. Comprehension was measured by two dependent variables: • •
Time: the time taken to respond to a question on the example system measured in seconds. Number of incorrect responses: The number of incorrect trials to get to the right answer.
•
•
•
•
Domain knowledge: participants’ knowledge of the domain of the example systems might vary. We therefore used very simple example systems where the amount of domain knowledge needed was extremely small and any programmer should be able to more-orless immediately understand the concepts. Example system complexity levels: example systems were reviewed by three researchers to make sure their complexity levels were comparable. Notation background: participant may respond more positively or quickly to notations that they are more familiar with. All participants were more familiar with Java and UML than Umple. Notation background in this experiment does not invalidate our hypothesis or conclusion; it would simply make our conclusions more conservative, should Umple ‘do well’. Learning during the experiment: we used three different examples with domain names and abstract names to minimize the impact of learning during the experiment. Environmental variables, such as noise and interruptions: experiment sessions were conducted within an environment where noise and interruptions were minimized.
4 Hypotheses The experiment seeks to consider the following hypotheses:. H1: A system written in Umple is more comprehensible than an equivalent Java implementation of the system.. In other words, participants take on average less time to respond to questions when presented
with an Umple version of a system as opposed to a Java version. The corresponding null hypothesis is: H1o: Umple and Java comprehensibility.
do
not
differ
in
H1 sets a baseline. If we can reject the null hypothesis then we can be confident, going forward that it is worthwhile adding modeling elements to Java. The next hypothesis is similar, comparing Umple and UML diagrams: H2: A system written in Umple has a different comprehensibility level than an equivalent UML diagram of the system. H2o: Umple and UML diagrams do not differ in comprehensibility A priori, we had not designed Umple to be better than UML and don’t know if it would be more or less comprehensible than UML. It has been argued by some that perhaps we should have simply had one hypothesis, that there is some difference between the treatments. This is recommended practice when comparing three treatments, and has the advantage of avoiding pairwise-comparisons which can increase the chance of a Type I error randomly occurring. However, it is essential to our work to investigate whether Umple is better than Java, merely interesting to determine whether it is different from UML in terms of comprehensibility. We need the separate hypotheses to ascertain this, and will consider the risk from pairwise comparison in the threats to validity.
5 Instrumentation The main experiment instruments were three rounds of comprehension questions that measure the effectiveness of the notation. Each round contained 12 questions. It was expected that participants would be able to provide responses within 30 seconds of posing the question. Some questions addressed the concept of associations as present in a class diagram or a textual notation. For example, question #2 “Assume the student has one supervisor. Can you add another supervisor to the same student?” requires the participant to look at the class diagram or the Umple or Java code and consider the association relationship between student and
supervisor. Other questions addressed comprehension of a state machine. For example, question #8 “Can the state machine go directly from Quit to Enrolled?” requires the participant to investigate state transitions, either in class diagram or equivalent code. Participants were not given a paper or pen to write down notes. They were also not given the question list, to minimize the risk they would look at other questions while attempting to answer the current question. The questioning sessions were audio recorded. Time was measured starting from the end of posing a question until the participant correctly answered the question. At the onset of the experiment, participants were asked a number of profiling questions about their background, prior knowledge of UML, Java and Umple, software engineering courses and work experience.
6 Experiment Operation In the course of the experiment, each participant was given three rounds of questions posed about three example systems, each using a different notation. Each round took approximately 12 minutes. Participants were presented with a different system using a different notation in each round. This was required to minimize or eliminate possible learning during the experiment. Table 3 summarizes the distribution of example systems for the first three participants. For example, the first participant is presented with an Umple model of the first example, a UML model of the third example, and a Java model of the second example. Table 3. Experiment operation Subject 1 Subject 2 Subject 3
Umple One Two Three
UML Three One Two
Java Two Three One
The distribution of artifacts was balanced, so that equal number of participants answers questions on equal number of notations. Please refer to [26] for the full experiment operation.
6.1 Design Validation – Pilot
Study In order to initially verify and validate the design of the experiment, as well as identify potential flaws in the design, we conducted a pilot study. The pilot study was done with three participants, who were selected based on convenience and software engineering background. From the pilot study it was found that some of the original question wording was not clear. It was also found that participants tend to get bored by the end of the experiment. The question wording was corrected and reviewed independently again. The boredom was mitigated by reducing the number of questions, and giving participants a 2 minute break between rounds.
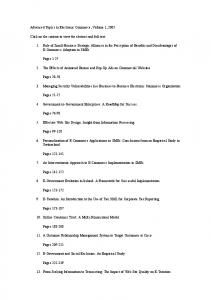
7 Results and Analysis In total, each participant provided answers to 36 questions; 12 answers for each notation. We measured the time the participant took to provide the answers for each question. Figure 3 summarizes the average response time per notation for each of the participants.
The overall average time to answer the questions for UML was 3.6 seconds. For Java it was 6.9, and Umple was 3.6 seconds. The standard deviation was 5.0 for Umple, 4.0 for UML, and 9.6 for Java. A box plot appears in Fig. 4. Additional descriptive analysis in tabular form is published in [26]. The average response time per example system (for all three notations) was as follows: • • •
These almost identical values for the average response times per example system support our claim that the example variations did not overly impact the participants’ response times. Note that time is measured starting after the question is fully read out to the participants. Therefore, variations of the length of the question itself (if there are any) should have minimal impact on the results. It is our intention that the questions be straightforward and participants should be able to provide correct answer at the first attempt. However, it was not always the case; there were a total of 37 incorrect responses out of the 324 questions posed. Incorrect responses were distributed among all three notations as follows: Umple with 8, UML 12, and Java 17. Incorrect responses were distributed over the examples as follows. • • •
Fig. 3. Average response time
Time Fig. 4: Box plot of response time to questions
Example one: 4.67 seconds. Example two: 4.74 seconds. Example three: 4.67 seconds.
Example one: 14. Example two: 11. Example three: 12.
These results further reduce the threat that system examples had influenced the number of incorrect responses or the final results. We also noticed that in some cases, a particular participant gave an incorrect answer for the analogous questions across the three different examples in three different notations (2 incidents accounting for 6 incorrect responses). We were able to identify the learning effect, where a participant gave incorrect response to a particular question, and then in subsequent examples gave correct responses (7 incidents). This indicates that the participant was able to learn from his incorrect answers. This learning effect does not affect our final results since the examples and notations were evenly distributed in terms of the order they were presented.
7.1 Examining Data for Java
and Umple Using a two-tailed t-test to measure the statistical significance, the comprehension time required for Umple is lower than that of Java (p=1.5x10⁻⁸). So we reject null hypothesis H1o. As confirmatory evidence (in case of significant departure from the normality requirements of the T-test), we also applied the Mann-Whitney test (U-test), Umple is still better than Java (p = 8.9x10⁻⁹) with a W value of 2722. So using this test we also reject null hypothesis H1o. Using the sign-test [28], Umple was better than Java in 83 occurrences, while Java was better than Umple in 13 occurrences. The sign test results indicate Umple is better than Java (p=6.0x10⁻¹⁴), again leading to rejection of null hypothesis H1o.
7.2 Examining Data for
UML and Umple Using a two-tailed t-test to measure the statistical significance, Umple does not have a significantly different average comprehension time than UML (p=0.9). So we do not reject null Hypothesis H2o Using a Mann-Whitney test (U-test) Umple is not significantly different from UML (p = 0.2) and a W value of 4477.5. Again we do not reject H2o Using the sign-test, Umple was better than UML in 53 occurrences, while UML was better than Umple in 30 occurrences. The sign test results indicate Umple is not significantly better than UML (P=0.864). We also conducted mean and standard deviation analysis. For each participant’s results, we test to see if the mean comprehension time of Umple lies in the range of the mean of UML, plus or minus one standard deviation. The answer was positive in all nine participants’ results. This technique is used to show whether or not two data sets come from different populations [29]. Here, we use it to show that the two data sets (Umple and UML) are not significantly different, so we cannot conclude that they come from the different populations. Elsewhere in the literature, this technique is also used to identify outliers [30].
8 Threats to Validity Threats to validity of the experiment and how we tackled them are described in this section.
8.1 Number of Participants Nine participants is relatively small, however the statistical analysis for Hypothesis 1 nonetheless gives very strong evidence that Umple is better than Java, regardless of the number of participants. We might have obtained significant results for Hypothesis 2 if we used more participants; we intend to do so in the near future.
8.2 Participant Experience There is a threat that expertise and background of the participants may have an impact on how fast they respond to questions. To mitigate this risk we collected profiling information to validate our claim that our participants have backgrounds that were not significantly biased towards a specific modeling notation. We also took steps to analyze the data to see if such a bias was manifested in the data and would affect our hypotheses; it was shown not to. We analyzed data for each of the nine participant independently and verified that participants’ experience do not have an impact on our experimental results. For example, we analyzed the data by running the t-test on the average response time of each participant. We achieved similar conclusions; Umple was not significantly better than UML (P = 0.9), Umple was significantly better than Java (P = 4.3x10⁻⁵), and UML was significantly better than Java (P = 3.5x10⁻⁵). Similar results were achieved using the sign test. We also used very straightforward modeling examples and questions. This has the effect of shifting the focus on the notation, rather than the subject’s technical expertise. In addition, the distribution of modeling artifacts (Table 3) means that subjects with higher technical expertise will most likely provide quicker responses to all three treatments.
8.3 Non-Representative
Examples There is an external validity threat that the examples are not a good representation of the real software engineering modeling examples because they were so simple. This threat should be taken into consideration when drawing conclusions from this study. However, it is essential to always establish a baseline of research on simple cases before moving on to a study of more complex cases.
8.4 Question Interpretation There is a threat to internal validity that the specific questions or example systems may have an impact on the time participants take to respond. This was mitigated by the distribution of participants and treatments. Piloting the study and the independent reviewers increased our confidence that this threat is properly mitigated. The authors are also involved in the Umple technology development. The use of independent reviewers of the systems and questions was to help overcome any bias the authors might have introduced due to their familiarity with and interest in Umple.
8.5 Use of Pairwise
Comparison As mentioned in Section 4, we used pairwise comparison, i.e. separately comparing Umple with Java and Umple with UML. The more such pairwise comparisons performed, the greater the likelihood of a Type 1 error by ‘chance’ (i.e. rejecting the Null hypothesis when it is true). A multi-way comparison such as ANOVA us usually recommended when there are three or more treatments. But this only becomes relevant when p values are relatively close to the threshold for significance. In the current study, the p value for the comparison of Umple with Java (which is our main interest) is extremely small, and there are only two pairwise comparisons. As a result, this threat is not an issue.
9 Discussion The study provides evidence that Umple performs significantly better in comprehensibility than Java as expected. Furthermore we have evidence that Umple as a textual language retains the advantage of UML neither exceeding nor being worse than UML’s comprehensibility. The tasks involved in this experiment focused on simple model comprehension and tracing questions. These tasks resemble realistic software engineering tasks [31], but, do not cover the wide spectrum of tasks performed by software engineers. In particular, the tasks do not address model creation, tuning, implementation, and maintenance tasks. Therefore, interpretation of the results must take into consideration the scope on which conclusion can be drawn. We can therefore infer that Umple is better than Java in understanding a system. We can also infer that Umple is not significantly better or worse than UML visual models in this regard, although gathering additional data is warranted. Umple is not meant to replace UML, but to complement it. Indeed, the UmpleOnline tool [32] allows both to be used interchangeably. The results of this experiment were analyzed quantitatively, not qualitatively. This is because by design, the experiment did not collect qualitative data. Sessions were audio recorded and participants were not instructed or encouraged to think aloud or explain their thought process so as not to affect the timing. However, the researcher who conducted the sessions took note of some patterns. When a question required some tracing (i.e. questions 4, 10, and 12) the participants used their finger to point at the system example and moved their finger as they proceeded to the next step in their thought process. When the tracing was sequential, the textual notations seemed to perform better. Also, participants seemed to take a little bit more time to respond to the first few questions. This is expected since participants may not have constructed a complete mental model of the system examples yet. It seems, however, that UML performed better at those early stages. Participants seemed to respond more quickly and confidently in the first few questions when the system examples is presented in a visual notation. These insights suggest that program comprehension may be
enhanced if software engineers are presented with both a textual and visual notation. Software engineers may then be able to use the notation that is most appropriate for their comprehension task at hand. There is some evidence that these insights are grounded in the data. It is left as future work to validate such insights. A core lesson from this paper is that people whose program development approach is primarily textual, for any reason, should with confidence consider Umple as a viable textual technology. It retains the advantages of text, while being easier to understand than Java, and being just as comprehensible as UML diagrams when it comes to UML concepts such as state machines and associations.
10 Related Work One of the challenges with the evaluation of textual and visual modeling is the wide variety of textual and visual modeling approaches available. The work of Hendrix [14] adopts a similar approach towards measuring comprehensibility levels. In his work, Hendrix evaluated textual code and control structure diagrams by measuring the time subjects took to respond to questions. We, on the other hand, evaluated UML, Java, and Umple. Our work is the first that provides empirical evaluation of the Umple modeling approach. Briand el al. [33] evaluated two types of object-oriented documents. Similar to our experiments, Briand et al’s work evaluates two different ways of presenting equivalent information. They conclude that, “Good objectoriented design is easier to understand than good structured design”. They also found no evidence that “good structured design is easier to understand than bad structured design”.
11 Future Work This experiment cannot be a final word on model notation effectiveness, and it is not intended to be so. Future work to replicate this experiment can be of great value in two ways. First, by increasing the number of participants; second, by recruiting more professional software engineers and make conclusions on this group of subjects; and third, by using a variety of more complex systems.
It is yet to be seen in future studies how Umple, UML, and Java compare in the performance of other, possibly more elaborate, software engineering tasks. One variant of this experiment can ask participants to spot flaws or defects in model elements, or match pieces of Umple models and Java artifacts to UML models. Such tasks can shed more light on the nature of comprehension of textual modeling paradigms.
About the Authors Omar Badreddin is a postdoctoral fellow at University of Ottawa. He graduated from the University of Ottawa with a PhD in 2012. Prior to his PhD he worked at IBM in the areas of Model Driven Engineering and Process Management. Andrew Forward graduated from the University of Ottawa with his PhD in 2010. He has consulting experience in a variety of companies. Timothy Lethbridge has been a professor of Software Engineering and Computer Science at the University of Ottawa since 1994, where he leads the Complexity Reduction in Software Engineering Lab. He is a Professional Engineer and a member of the IEEE and ACM.
References [1] Forward, A. and Lethbridge, T. C. "Problems
and opportunities for model-centric versus code-centric software development: A survey of software professionals," in MiSE '08: Proc. 2008 International Workshop on Models in Software Engineering, 2008, pp. 27-32. [2] OMG. "UML Human-Usable Textual Notation (HUTN)" accessed 2012, http://www.omg.org/spec/HUTN/ [3] OMG. "Concrete Syntax for a UML Action Language, (Action Language for Foundational UML – ALF)," accessed 2012, http://www.omg.org/spec/ALF/ [4] Yukihiro Matsumoto. “Ruby programming language”. Available: http://www.rubylang.org/en/, Accessed 2012 [5] M, Martin, “StateMachine: A Ruby Library, Gem and Rails Plugin”, http://slagyr.github.com/statemachine/, Accessed 2012.
[6] RubyOnRails.org, “Active Record — Objectrelation mapping put on rails”, http://ar.rubyonrails.org/, Accessed 2012 [7] MetaUML. Open source; Accessed 2012. http://metauml.sourceforge.net, Accessed 2012 [8] T. Harris, "yUML," accessed 2012. Available: http://yuml.me/ [9] "TextUML," accessed 2012. Available: http://sourceforge.net/projects/textuml/ [10] State Machine Compiler (SMC). Accessed 2012,.http://smc.sourceforge.net/ [11] Y. Gurevich, B. Rossman and W. Schulte. "Semantic essence of AsmL". 2005. Theor.Comput.Sci. vol 343, pp. 370-412. [12] Chris Raistrick. "Model Driven Architecture with Executable UML (TM)". Cambridge University Press New York, NY, USA, 2004 [13] CRuiSE Group University of Ottawa, “Umple Model Oriented Programming”, http://www.umple.org, accessed 2012. [14] D. Hendrix, J. H. Cross II and S. Maghsoodloo. "The effectiveness of control structure diagrams in source code comprehension activities". 2002. IEEE Trans.Software Eng.pp. 463-477. [15] T. R. G. Green. "The cognitive dimension of viscosity: a sticky problem for HCI". 1990. Hum.-Comput.Interact.pp. 79-86. [16] CRuiSE Group, “Philosophy and Vision for the Umple Language and Model-Oriented Programming”, http://philosophy.umple.org/ Accessed 2012 [17] T.C. Lethbridge, A. Forward, O. Badreddin. 2010 Proc. 17th Working Conference on Reverse Engineering (WCRE), pp. 220-224. http://dx.doi.org/10.1109/WCRE.2010.32 [18] CRuiSE Group, “Umple User Manual”, http://manual.umple.org, Accessed 2012. [19] CRuiSE Group, “Umple API Summary”, http://api.umple.org/, Accessed 2012 [20] T. Lethbridge. “Umple - Creating a Library System Using Model-Oriented Programming” http://www.youtube.com/watch?v=HLWML9 YSD_U. Accessed 2012.
[21] T. Lethbridge. “Umple – State Machine Details”: http://www.youtube.com/watch?v=mFczzVkT Z9g. Accessed 2012. [22] A. Forward, O. Badreddin, T.C. Lethbridge, Solano, J., (2011) “Model-Driven Rapid Prototyping with Umple”, Software Practice and Experience, 42: pp. 781-707 [23] A. Forward, T.C. Lethbridge, and D. Brestovansky, (2009), “Improving Program Comprehension by Enhancing Program Constructs: An Analysis of the Umple language”, International Conference on Program Comprehension (ICPC) 2009, Vancouver, IEEE Computer Society, pp. 311312 [24] O. Badreddin, and T.C. Lethbridge, T. (2012) “Combining Experiments and Grounded Theory to Evaluate a Research Prototype: Lessons from the Umple Model-Oriented Programming Technology”, 2012 First International Workshop on User evaluation for Software Engineering Researchers (USER 2012), in conjunction with ICSE 2012 [25] T.C. Lethbridge, G. Mussbacher, A. Forward and O. Badreddin, (2011) “Teaching UML Using Umple: Applying Model-Oriented Programming in the Classroom”, CSEE&T 2011, pp. 421-428 [26] O. Badreddin. (2012) "A Manifestation of Model-Code Duality: Facilitating the Representation of State Machines in the Umple Model-Oriented Programming Language". PhD. Thesis, University of Ottawa, Available: http://www.site.uottawa.ca/~tcl/gradtheses/ob adreldin/ [27] T.C. Lethbridge . “Umple – Associations and Generalizations”, http://www.youtube.com/watch?v=HIBo0ErC VtU. Accessed 2012. [28] W. J. Dixon and A. M. Mood. "The statistical sign test". 1946. Journal of the American Statistical Association pp. 557-566. [29] S. Mohammad. "From once upon a time to happily ever after: Tracking emotions in novels and fairy tales". 2011. ACL HLT 2011pp. 105.
[30] S. M. Mohammad and P. D. Turney. "Crowdsourcing a word--emotion association lexicon". 2011. In submission. [31] Sjoberg, D. I. K., Anda, B., Arisholm, E., Dyba, T., Jorgensen, M., Karahasanovic, A., Koren, E. F. and Vokác, M. "Conducting realistic experiments in software engineering," in Empirical Software Engineering, 2002. Proceedings. 2002 International Symposium n, 2002, pp. 17-26.
[32] CRuiSE group, “Umple Online”, http://try.umple.org, Accessed 2012 [33] L. C. Briand, C. Bunse, J. W. Daly and C. Differding. "An experimental comparison of the maintainability of object-oriented and structured design documents". 1997. Empirical Software Engineering vol 2, pp. 291-312.