Microbial enhanced oil recovery remains the most environmental friendly, cost effective recovery ... EOR is an of aspect biotechnology, utilizing the potentials of.
IJRET: International Journal of Research in Engineering and Technology
eISSN: 2319-1163 | pISSN: 2321-7308
MODELING A WELL STIMULATION PROCESS USING THE MEOR TECHNIQUE Nmegbu C.G.J.1, Pepple D.D2 1, 2
Department of Petroleum Engineering, Rivers State University of Science and Technology, Rivers State, Nigeria
Abstract Microbial enhanced oil recovery remains the most environmental friendly, cost effective recovery technique in oil production, particularly for wellbore stimulation. This research investigates the effects of microbial growth rate, microbial and nutrient concentrations for well stimulation purposes. A representative model incorporating microbial concentration, its growth rate and skin factor is developed, validated and discussed. An explicit formulation which poses a solution to the equation for the model is used to describe the reservoir pressure responses. It is observed through plots of reservoir pressure against reference distances that flow and production rates improved as a result of an improved BHP when the microbial parameters were incorporated to the fluid transport equation at same injection rates and same reservoir parameters. The trend followed by the pressure profile plots correlates with that expected of a well stimulation pressure profile.
Keywords: Well Stimulation, MEOR, Permeability, MEOR stimulation ----------------------------------------------------------------------***-----------------------------------------------------------------------1. INTRODUCTION The current need for maximizing oil recovery from the reservoir has prompted the evaluation of improved oil recovery methods and various EOR techniques. Microbial EOR is an of aspect biotechnology, utilizing the potentials of microbes to significantly influence oil flow and its recovery. However, a sound and reliable engineering technique in optimizing microbial formulations are required to maximize these potentials. The use of microbes for hydrocarbon recovery has been credible, and loss of crude during the process can be considered insignificant compared to the amount of increased recovery. Pressure, salinity, pore structure and mainly temperature often limit the functionality of microbes during any MEOR application. The patented process described by ZoBell showed that bacterial products such as gases, acids, solvents, surfactants and cell biomass released oil from sand packed columns in a laboratory test [1]. Subsequent studies have shown that [2]; 1. Viable bacteria and various nutrients required for growth can be transported through cores. 2. Insitu growth of bacteria results in significant reduction in formation permeability. 3. Permeability reduction is selective for high permeability cores and improves sweep even under conditions where cross flow of fluids between regions occur. Taylor et al conducted a theoretical and experimental investigation to effectively quantify reduction in permeability
as a result of enhanced microbial growth in a porous media [3]. They observed that enhanced biological activities in sand column reactors can significantly reduce permeability. An analytical relationship was then established between the biofilm thickness and resulting permeability reduction. A one-dimensional, two-phase, compositional numerical simulator to model the transport and growth of bacteria and oil recovery in MEOR process was developed by Sarkar et al. [4]. In their model, permeability reduction was modeled using the effective medium theory an implicit-pressure, explicitconcentration algorithm was used to solve pressure and mass concentration equations. Islam presented a mathematical formulation to describe and explain microbial transport in a multiphase multi directional flow through a porous media [5]. In his formulation, physical dispersion terms were neglected in the component transport equation, since metabolic product actions were not included in the model, considerations which relate biomass to metabolic and their activities were defined. Nielson et al used a correlation between IFT and surfactant concentration. Usually, a reduction in IFT causes a decrease in residual oil saturations, therefore affecting the permeability curve end points [2]. They investigated the following methods [2, 6, 7]; 1. Capillary number and normalized residual oil saturation correlations. 2. Coats interpolated between 𝐾𝑟 and the interpolation of factors of core types relative to permeability curves.
__________________________________________________________________________________________ Volume: 03 Issue: 03 | Mar-2014, Available @ http://www.ijret.org
153
IJRET: International Journal of Research in Engineering and Technology They recommended the latter, in which more parameters can be estimated in order to obtain a better fit with experimental data. Knapp et al also developed a 1 –Dimensional mathematical model to effectively describe the microbial plugging process [8]. The impact of cellular growth and microbial retention on temporal reduction in permeability of porous media were the main objectives investigated by this model. They assumed the development of stationary phase is solely due to the biomass retention therefore convective transport is the dominant mechanism for microbial mobilization. Their governing equation included a convection dispersion equation for bacteria and nutrient transport, and a mass conversion equation for stationary phase development. Zhang et al presented a three-phase, multiple species, onedimensional mathematical model to simulate biomass growth, bioproduct formation, and substrate consumption during insitu microbial growth, and to predict permeability reduction as a result of in-situ growth and metabolism in porous media [9]. All the model parameters considered by respective authors are ideal for successful MEOR implementation. They are considered the most relevant as a result of multiple microbial oil recovery studies and mainly include microbial transport, microbial concentration, Interfacial Tension (IFT) reduction parameters, microbial kinetics, mobility control, viscosity reduction etc. This study basically aims at examining microbial formulations that can be applied as well stimulation alternatives and permeability alteration agents.
2. MATERIALS AND METHOD The fundamental theories of Fluid flow and Monod growth kinetics would serve as a basis for modeling well stimulation processes by MEOR application as a result of permeability alteration caused by metabolite production by the choice microbe (clostridium sp).
eISSN: 2319-1163 | pISSN: 2321-7308
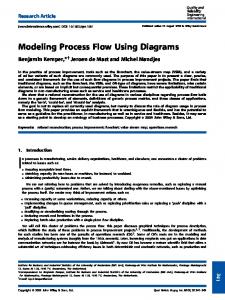
Region A is the damaged region, while region B is the undamaged region.
2.1 Choice of Microbe Having the ability to effectively withstand reservoir with the most challenging conditions, particularly temperature and salinity, Clostridium sporonges proves the best stimulation microbe, prior to its metabolite production (butanolCH3(CH2)3OH and acetones(2𝐶𝐻3 𝐶𝑂𝑂𝐻) that alters the absolute permeability of reservoir rock after reaction to produce calcium acetate, carbon dioxide and water. Being a thermophile, with a temperature tolerance range of about 50 – 700C (122 – 1580F), this microbe can thrive in relatively high reservoir temperature condition, averaging about 600C (1400F) Pores must be twice the diameter of the microbe for effective transportation to occur. Ideally, clostridium sp records about 4.0𝜇𝑚 length and 0.6𝜇𝑚 thick. This proves convenient enough to be transported in a carbonate pore throat averaging 1.16𝜇𝑚 minimum. An optimum pH for microbial existence and transport in the porous media lies between 4.0 – 9.0, and clostridium sp lies between this limit (4.5 - 4.7).
3. MATHEMATICAL MODELING 3.1 Microbial Growth Rate The growth rate expression applied for bacteria are often the Monod expression based on the Michelis-Menten enzyme kinetics [2, 5, 11]. The Monod expression with one limiting substrate is widely used, but it is empirical in the context of microbial growth. The Monod growth rate for one limiting substrate without any inhibition will be used in this work:
𝐺 = 𝐺𝑚𝑎𝑥
𝐶𝑛 𝑘 𝑠 + 𝐶𝑛
(1)
Where Gmax is the maximum growth rate obtained in excess nutrient (hr-1) ks is the substrate concentration to half G max (mg/l) Cn is the nutrient concentration (mg/l)
3.2 Fluid Transport Equation The most general form of a single phase fluid flow equation in a porous media is presented below in equation (2), making no assumptions regarding fluid type or pressure dependency on rock and fluid properties [12]; Fig -1: Effects of well bore vicinity damage on the pressure profile and BHP levels [10]
__________________________________________________________________________________________ Volume: 03 Issue: 03 | Mar-2014, Available @ http://www.ijret.org
154
IJRET: International Journal of Research in Engineering and Technology 𝜕 1 𝜕 𝑈𝑥 ∆𝑥 + 𝜕𝑥 𝐵 𝜕𝑦 𝑣𝑏 𝜙𝑆𝑖 𝐶𝑡 𝜕𝑃 𝜕 1 𝑈𝑥 ∆𝑥 𝛼 𝐵 𝜕𝑡 𝜕𝑥 𝐵 𝑐 𝑜
1
𝑈𝑦 +
𝐵
𝜕
∆𝑦 +
𝑈𝑦
𝜕𝑦
1 𝐵
𝜕 𝜕𝑧
∆𝑦 +
𝐵
𝜕 𝜕𝑧
𝑣𝑏 𝜙𝑆𝑖 𝐶𝑡 𝜕𝑃 𝛼 𝑐 𝐵𝑜
1
𝑈𝑧
∆𝑧 + 𝑞 =
𝑈𝑧
1 𝐵
Formation volume factor, B =
∆𝑧 + 𝑞 =
𝐵𝑜 1+𝑐 𝑃−𝑃𝑜
For initial boundary conditions,
(2)
𝜕𝑡
eISSN: 2319-1163 | pISSN: 2321-7308
P = Po, therefore B = Bo.
3.3 Assumptions for Model Development 1. 2. 3. 4. 5. 6. 7. 8. 9. 10.
11. 12. 13.
Fluid flow is one-dimensional single phase, and takes place in a uniform porous medium. Metabolite production mostly bioacids [2] Isothermal system as reservoir fluctuations in temperature is regarded minimal [4] A change in temperature will alter the individual values of 𝐶𝑡 , 𝜇𝑜 , 𝐵 𝑎𝑛𝑑 𝑃 No break in injection rates of nutrient and bacteria during the process Microbial decay not considered. No indigenous bacteria present. Flow in the reservoir is in the direction of the wellbore. Chemotaxis (movement of microbes towards an increasing concentration of substrate) not considered. No substrate and metabolite adsorption on the pore walls, so Langmuir equilibrium isotherm not considered. Flow is laminar (reservoir contains only oil). Unsteady state flow conditions. Other factors affecting growth rates such as salinity and pH remain constant.
With these assumptions imposed on equation (2) the flow of fluid in the reservoir was Representing a 1-dimensional, single phase flow system as:
Neglecting the negative sign on the LHS of equation (6), the equation is reduced to: 𝜕 𝜕𝑥
𝐴𝑥 𝑘 𝑥 𝐶𝑏 𝑑𝑃 𝜇 𝑜 𝐵 𝑑𝑥
𝛽𝑐
∆𝑥 + 𝑞𝐶𝑏 =
𝑣𝑏 𝜙𝐶𝑡 𝐶𝑏 𝜕𝑃 𝛼𝑐 𝐵 𝜕𝑡
(7)
Incorporating the Monod equation to account for microbial growth rate, we have; 𝜕 𝜕𝑥
𝛽𝑐
𝐴𝑥 𝑘 𝑥 𝐶𝑏 𝑑𝑃 𝜇 𝑜 𝐵 𝑑𝑥
∆𝑥 + 𝑞𝐶𝑏 + 𝐺 =
𝑣𝑏 𝜙𝐶𝑡 𝐶𝑏 𝜕𝑃 𝛼𝑐 𝐵 𝜕𝑡
(8)
For stimulation, skin factor must be considered (showing the relativity of permeability and radii of investigation ), and is represented as thus [10];
𝑆=
𝑘 𝑘 𝑠𝑘𝑖𝑛
− 1 𝑙𝑛
𝑟 𝑠𝑘𝑖𝑛
(9)
𝑟𝑤
Incorporating skin factor into equation (8), we have ∂ ∂x
βc
A x k x C b dP μ o B dx
∆x + qCb + G =
v b ϕC t C b S ∂P αc B ∂t
(10)
Equation (10) can be used to predict pressure in the reservoir after microbial injection.
4. SOLUTION TO MATHEMATICAL 𝜕 𝜕𝑥
1 𝑈𝑥 ∆𝑥 𝐵
+𝑞 =
𝑣𝑏 𝜙𝐶𝑡 𝜕𝑃 𝛼 𝑐 𝐵𝑜 𝜕𝑡
(3)
Rewriting equation (10) as a second order derivative, we have:
From Darcy’s law for a 1-dimensional flow system:
𝑈𝑥 = −
𝐴 𝑘 𝑑𝑃 𝛽𝑐 𝜇𝑥 𝑥 𝑑𝑥 𝑜
(4)
− 𝛽𝑐
𝐴𝑥 𝑘 𝑥 𝑑𝑃 𝜇 𝑜 𝑑𝑥
1 ∆𝑥 𝐵
+𝑞 =
𝑣𝑏 𝜙𝐶𝑡 𝜕𝑃 𝛼 𝑐 𝐵𝑜 𝜕𝑡
𝜕2𝑃 𝜕𝑥 2
𝛽𝑐
𝐴 𝑥 𝑘 𝑥 𝐶𝑏 𝜇𝑜 𝐵
∆𝑥 + 𝑞𝐶𝑏 + 𝐺 =
𝑣𝑏 𝜙𝐶𝑡 𝐶𝑏 𝑆 𝜕𝑃 𝛼𝑐 𝐵 𝜕𝑡
(11)
Applying central difference approximation in space (x) and forward difference approximation in time (t), we have [12];
Substituting equation (4) into (3), we have: 𝜕 𝜕𝑥
FORMULATION
(5)
∆𝑥
Accounting for microbial concentration[2]: 𝜕 𝜕𝑥
−𝛽𝑐
𝐴𝑥 𝑘 𝑥 𝐶𝑏 𝑑𝑃 1 ∆𝑥 𝜇𝑜 𝑑𝑥 𝐵
+ 𝑞𝐶𝑏 =
𝑣𝑏 𝜙𝐶𝑡 𝐶𝑏 𝜕𝑃 𝛼 𝑐 𝐵𝑜 𝜕𝑡
i-1
i
I +1
(6)
Equation (6) is known as the component transport equation for microbes. For slightly compressible fluids such as oil,
Fig -2: Discrete points representation (grid positions) 𝜕2𝑃 𝜕𝑥 2
=
𝑛 𝑛 𝑃𝑖+1 −2𝑃𝑖𝑛 +𝑃𝑖−1
∆𝑥 2
and
__________________________________________________________________________________________ Volume: 03 Issue: 03 | Mar-2014, Available @ http://www.ijret.org
155
IJRET: International Journal of Research in Engineering and Technology
𝜕𝑃 𝜕𝑡
=
𝑃𝑖𝑛 +1 −𝑃𝑖𝑛
Equation (17) can now be written as thus;
∆𝑡
Where ‘i’ is position and ‘n’ is the time step. Applying the approximations to Equation (11) gives: 𝑛 𝑛 𝑃𝑖+1 −2𝑃𝑖𝑛 +𝑃𝑖−1
𝛽𝑐
∆𝑥 2
𝑃𝑖𝑛 +1 −𝑃𝑖𝑛
𝑣𝑏 𝜙𝐶𝑡 𝐶𝑏 𝑆 𝛼𝑐 𝐵
eISSN: 2319-1163 | pISSN: 2321-7308
𝐴 𝑥 𝑘 𝑥 𝐶𝑏 𝜇𝑜 𝐵
∆𝑥 + 𝑞𝐶𝑏 + 𝐺
=
𝑛 𝑛 𝑃𝑖𝑛+1 = 𝑃𝑖𝑛 + 𝐶 𝑀𝑃𝑖+1 − 2𝑀𝑃𝑖𝑛 + 𝑀𝑃𝑖−1 + 𝐶 𝑞𝐶𝑏 + 𝐺 (18)
5. MODEL VALIDATION
(12)
∆𝑡
Rearranging equation (12) we have: 𝑃𝑛 𝐴 𝑥 𝑘 𝑥 𝐶𝑏 ∆𝑥 𝑖+12 − 2 𝜇𝑜 𝐵 ∆𝑥 𝑛 𝑃𝑖−1 𝐴 𝑥 𝑘 𝑥 𝐶𝑏 𝛽𝑐 𝜇 𝐵 ∆𝑥 ∆𝑥 2 𝑜 𝑃𝑖𝑛 +1 −𝑃𝑖𝑛 𝑣𝑏 𝜙𝐶𝑡 𝐶𝑏 𝑆 𝛼𝑐 𝐵 ∆𝑡
𝛽𝑐
𝛽𝑐
𝐴 𝑥 𝑘 𝑥 𝐶𝑏 𝜇𝑜 𝐵
∆𝑥
+ 𝑞𝐶𝑏 + 𝐺
𝑃𝑖𝑛 ∆𝑥 2
+
= (13)
The above can now be written as:
𝛽𝑐 𝛽𝑐
𝐴 𝑥 𝑘 𝑥 𝐶𝑏 ∆𝑥𝜇 𝑜 𝐵
𝐴 𝑥 𝑘 𝑥 𝐶𝑏 ∆𝑥𝜇 𝑜 𝐵
𝐴 𝑥 𝑘 𝑥 𝐶𝑏 𝑃𝑖𝑛 ∆𝑥𝜇 𝑜 𝐵 𝑣 𝜙𝐶 𝐶 𝑆 = 𝑏 𝑡 𝑏 𝛼𝑐 𝐵
𝑛 𝑃𝑖+1 − 2 𝛽𝑐
𝑛 𝑃𝑖−1 + 𝑞𝐶𝑏 + 𝐺
+ 𝑃𝑖𝑛 +1 −𝑃𝑖𝑛
Fig -3: Discretization of reservoir showing dimensions,production and injection points
∆𝑡
(14) Taking
𝛽𝑐
Table -1: Field parameters
𝐴 𝑥 𝑘 𝑥 𝐶𝑏
to be M, rewriting equation (14) gives:
∆𝑥𝜇 𝑜 𝐵
𝑛 𝑛 𝑀𝑃𝑖+1 − 2𝑀𝑃𝑖𝑛 + 𝑀𝑃𝑖−1 + 𝑞𝐶𝑏 + 𝐺 𝑣𝑏 𝜙𝐶𝑡 𝐶𝑏 𝑆 𝛼𝑐 𝐵
𝑃𝑖𝑛+1
−
=
𝑃𝑖𝑛
(15)
For initial boundary conditions, all pressure values at any position ‘i’ at present time step ‘n’ are the same, so the values 𝑛 𝑛 of 𝑃𝑖 𝑎𝑛𝑑 𝑃𝑖−1 are all equal and known. The only unknown is the pressure value at position ‘i’ at a new time step n+1. 𝑛+1 In order to make 𝑃𝑖 the subject, we first multiply through
equation (15) by the inverse of 𝛼 𝑐 𝐵∆𝑡 𝑣𝑏 𝜙𝐶𝑡 𝐶𝑏 𝑆 𝛼 𝑐 𝐵∆𝑡 𝑞𝐶𝑏 𝑣𝑏 𝜙𝐶𝑡 𝐶𝑏 𝑆
Let
𝛼 𝑐 𝐵∆𝑡 𝑣𝑏 𝜙 𝐶𝑡 𝐶𝑏 𝑆
𝑣𝑏 𝜙𝐶𝑡 𝐶𝑏 𝑆 , 𝛼 𝑐 𝐵∆𝑡
we have;
𝑛 𝑛 𝑀𝑃𝑖+1 − 2𝑀𝑃𝑖𝑛 + 𝑀𝑃𝑖−1 +
+𝐺
= 𝑃𝑖𝑛+1 − 𝑃𝑖𝑛
(16)
Total compressibility, 𝐶𝑡 Transmissibility coefficient Formation porosity Wellbore radius, 𝑟𝑤 Damaged radius, 𝑟𝑠𝑘𝑖𝑛 Formation permeability, k Volume conversion factor, 𝛼𝑐
= 𝑃𝑖𝑛+1 −
Values 1500 psi 30 ft 10*10-6 psi-1 1.127 20% 0.25 ft 2ft 160md 5.615
∆𝑥 ∆𝑦 ∆𝑧
1000 ft
Oil formation volume factor,
1.00 rb/stb
50 ft 200 ft
𝐵𝑜 Oil viscosity, 𝜇𝑜 Permeability of damaged zone,
= C, we can write;
𝑛 𝑛 𝐶 𝑀𝑃𝑖+1 − 2𝑀𝑃𝑖𝑛 + 𝑀𝑃𝑖−1 + 𝐶 𝑞𝐶𝑏 + 𝐺 𝑛 𝑃𝑖 (17)
Parameters Depleted reservoir pressure Permeability of damaged zone(𝐾𝑠𝑘𝑖𝑛 )
𝐾𝑠𝑘𝑖𝑛 ∆𝑡
10 cp 30md 30days
__________________________________________________________________________________________ Volume: 03 Issue: 03 | Mar-2014, Available @ http://www.ijret.org
156
IJRET: International Journal of Research in Engineering and Technology Table -2: Nutrient and microbial parameters [11] Parameters Max microbial growth rate, 𝐺𝑚𝑎𝑥 The substrate concentration at half Gmax, ks Nutrient concentration, 𝐶𝑛 Microbial concentration, 𝐶𝑏
Values 0.343hr-1
𝐾 𝐾𝑠𝑘𝑖𝑛
− 1 𝑙𝑛
45 𝑚𝑔/𝑙 𝑐𝑒𝑙𝑙𝑠 3.5 × 10−4 = 𝑚𝑙 3 10𝑐𝑒𝑙𝑙𝑠/𝑓𝑡
Constants, 𝐶 =
𝑟𝑤 𝐶𝑛 𝑘 𝑠 + 𝐶𝑛
For grid block 4, i=4 𝑃4𝑛 +1 = 1500 + 0.093 1.071(1500) − (2 × 1.071)(1500) + 1.071(1500) + 0.093 0 10 + 6.4 𝑃4𝑛 +1 = 1500.60𝑝𝑠𝑖
𝑃5𝑛 +1 = 1500.60𝑝𝑠𝑖 For grid block 6, i=6 𝑃6𝑛 +1 = 1500 + 0.093 1.071(1500) − (2 × 1.071)(1500) + 1.071(1500) + 0.093 100 10 + 6.4
𝛼 𝑐 𝐵𝑜 ∆𝑡 𝑣𝑏 𝜙 𝐶𝑡 𝐶𝑏 𝑆
Transmissibility term, 𝑀 =
𝑃3𝑛+1 = 1500.60𝑝𝑠𝑖
For grid block 5, i=5 𝑃5𝑛 +1 = 1500 + 0.093 1.071(1500) − (2 × 1.071)(1500) + 1.071(1500) + 0.093 0 10 + 6.4
𝑟 𝑠𝑘𝑖𝑛
Microbial growth rate,𝐺 = 𝐺𝑚𝑎𝑥
For grid block 3, i=3 𝑃3𝑛 +1 = 1500 + 0.093 1.071(1500) − (2 × 1.071)(1500) + 1.071(1500) + 0.093 0 10 + 6.4
12.8 (𝑚𝑔/𝑙)
5.1 Calculation of Constants Skin factor, S =
𝛽 𝐶 𝐴𝑥
𝐾 𝑎𝑣𝑔 𝐶 1000 𝑥 𝑏
𝜇 𝐵𝑜 ∆𝑥
We have; S=9.01 𝐺 =6.4 day-1 C = 0.093 M= 1.071
𝑃6𝑛 +1 = 1594.07
6. RESULTS AND DISCUSSION 1650 1600 pressure, psi
5.2 Calculation of Pressure Responses at Different Grid Blocks For time step 1, ∆𝑡 = 30𝑑𝑎𝑦𝑠 Setting initial boundary conditions, P i=1500psi Recalling, 𝑛 𝑛 𝑃𝑖𝑛+1 = 𝑃𝑖𝑛 + 𝐶 𝑀𝑃𝑖+1 − 2𝑀𝑃𝑖𝑛 + 𝑀𝑃𝑖−1 + 𝐶 𝑞𝐶𝑏 + 𝐺
= 1537.79𝑝𝑠𝑖
For grid block 2, i=2 𝑃2𝑛 +1 = 1500 + 0.093 1.071(1500) − (2 × 1.071)(1500) + 1.071(1500) + 0.093 −150 10 + 6.4 𝑃2𝑛 +1 = 1360.39𝑝𝑠𝑖
1550 1500 1450
1400 1350 1300
For grid block 1, i=1 𝑃1𝑛 +1 = 1500 + 0.093 1.071(1500) − (2 × 1.071)(1500) + 1.071(1500) + 0.093 40 10 + 6.4 𝑃1𝑛 +1
eISSN: 2319-1163 | pISSN: 2321-7308
0
2
4 Grid point
6
8
Fig -4: Pressure profile with MEOR model The plot above shows a BHP of 1360.4psi at the production point at grid block 2
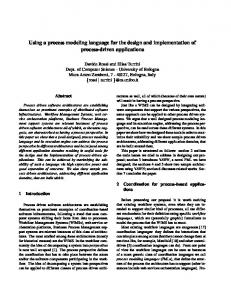
6.1 Comparison with Fluid Flow Equation Excluding Microbial Parameters and Skin Factor General fluid flow equation is given as: 𝜕 𝜕𝑥
𝐴 𝑘 𝑑𝑃
𝛽𝑐 𝜇 𝑥 𝐵𝑥 𝑑𝑥 ∆𝑥 + 𝑞 = 𝑜 𝑜
𝑣𝑏 𝜙𝐶𝑡 𝜕𝑃 𝛼 𝑐 𝐵𝑜 𝜕𝑡
(6)
__________________________________________________________________________________________ Volume: 03 Issue: 03 | Mar-2014, Available @ http://www.ijret.org
157
IJRET: International Journal of Research in Engineering and Technology 2500
Applying finite difference approximation to the above, we have: 𝛼 𝑐 𝐵∆𝑡 𝑣𝑏 𝜙𝐶𝑡
𝑞+
𝛼 𝑐 𝐵∆𝑡 𝑣𝑏 𝜙𝐶𝑡
2000
𝑛 𝑀𝑥 𝑖 +1 𝑃𝑖+1 − 2
𝑀𝑥𝑖+12+𝑀𝑥𝑖−12𝑃𝑖𝑛+𝑀𝑥𝑖−12𝑃𝑖−1𝑛
pressure, psi
𝑃𝑖𝑛+1 = 𝑃𝑖𝑛 +
1500
(7)
model
1000
Where: 𝛼 𝑐 𝐵∆𝑡 𝑣𝑏 𝜙𝐶𝑡
eISSN: 2319-1163 | pISSN: 2321-7308
normal
is the injection or production rate factor,
𝑀𝑥 𝑖 ±1 fluid transmissibility term, 𝑀 = 2
500
𝛽 𝐶 𝐴𝑥 𝐾𝑥 𝜇 𝐵𝑜 ∆𝑥
Solving for constants, C=8.4225 𝑀 =0.107
0 0
2
4
6
8
Grid point
2500
Fig -6: Pressure profiles comparison
pressure, psi
2000
7. CONCLUSIONS
1500 1000 500 0 0
2
4
6
8
Grid point
The BHP levels in 1, 2 and 3 in fig 1.1 represents bottom hole pressure level at improved, ideal and reduced permeability respectively. The comparison of both models as shown in fig (1.6) correlates with the pressure profile for an improved wellbore vicinity as shown in fig (1.1). It is observed that the BHP records about 240psi before the Meor formulation. A bottom hole pressure of 1360.39psi is established after MEOR treatment, this pressure increase of about 1120.39psi implies that there is an improved oil flow towards the wellbore, prior to the improvement in permeability and damage reduction around the wellbore vicinity. It is recommended that an optimum microbial concentration must be investigated so as to ascertain a concentration limit to prevent microbial plugging or clogging.
Fig -5: Pressure profile (with water) without MEOR
ACKNOWLEDGEMENTS Field result 230psi
Model prediction 240 psi
Deviation 10 psi
It is shown from figure 5 that a BHP of 240psi exists at the production point in grid block 2, with same injection and production rates, field parameters etc. used in the MEOR model. it is observed that there is a significant increase of pressure at the boundaries and injection points, but minimal pressure response at the production point. This implies that there is a resistance to fluid flow around the wellbore region, possibly skin effect which is responsible for the existence of a low pressure response at the BHP at the production point
The authors would love to appreciate the department of petroleum engineering RSUST for her relentless guidance and support in course of this research. The contributions of Dr. Jackson Akpa and Ohazuruike Lotanna, amongst others, are highly recognized.
REFERENCES [1]. Lazar, I. and Constantinescu, P. (1997): Field trials results of MEOR. Microbes and Oil Recovery, 1: pp. 122-131. [2]. Nielson, S.M., Shapiro, A.A., Michelsen, M.L. and Stenby, E.H. (2010). 1D simulations for microbial enhanced oil recovery with metabolite partitioning. Transp. Porous Media. 85: pp. 785-802. [3]. Taylor SW, Milly PCD, Jaffe PR. (1990). Biofilm growth and the related changes in the physical-properties of a porousmedium. 2. Permeability. Water Resour Res 26:pp. 2161– 2169.
__________________________________________________________________________________________ Volume: 03 Issue: 03 | Mar-2014, Available @ http://www.ijret.org
158
IJRET: International Journal of Research in Engineering and Technology
eISSN: 2319-1163 | pISSN: 2321-7308
[4]. Sarkar, A., G. Georgiou, and M. Sharma (1994). Transport of bacteria in porous media: II. A model for convective transport and growth. Biotechnol Bioeng 44, pp. 499–508 [5]. Islam, M. (1990). Mathematical modeling of microbial enhanced oil recovery. SPE-20480 presented at ATCE, New Orleans, Louisiana, USA, 23–26 September [6]. Coats, K. H. (1980). An equation of state compositional model. SPE J 20, pp. 363–376. [7]. Al-Wahaibi, Y. M., C. A. Grattoni, and A. H. Muggeridge (2006). Drainage and imbibition relative permeabilities at near miscible conditions. J Petrol Sci Eng 53, pp. 239–253 [8]. Knapp RM, McInerney MJ, Coates JD, Chisholm JL, Menzie DE, Bhu-pathiraju VK. (1992). Design and Implementation of a Microbially Enhanced Oil Recovery Field Pilot, Payne County, Oklahoma. SPE 24818, Presented at the 1992 Annual Technical Conference and Exhibition, October 22–25, 1992, Dallas, Texas [9]. Zhang, X., Knapp R., and McInerney M. (1992). A mathematical model for enhanced oil recovery process. SPE-24202 presented at IOR Symposium, 22–24 April, Tulsa, Oklahoma, USA. [10]. Ahmed, T (2010) Reservoir Engineering Handbook , 4th edition Massachusett, Gulf Professional Publishers, pp. 431434 [11]. Chang M.M., Chung, F., Bryant, R., Gao, H., and Burchfield T. (1991): Modeling and laboratory investigation of microbial transport phenomena in porous media. In: SPE 22845 presented at 66th Annual Technical Conference and exhibition of SPE in Dallas Texas. [12]. Ertekin .J.T, Gregory E .R, Jamal.H.(2001) Basic Applied Reservoir Simulation .Henry Doherty memorial fund of AIME, Society Of Petroleum Engineers, Richardson, Texas.
__________________________________________________________________________________________ Volume: 03 Issue: 03 | Mar-2014, Available @ http://www.ijret.org
159