Chen et al. / Malaysian Journal of Fundamental and Applied Sciences Special Issue on Some Advances in Industrial and Applied Mathematics (2017) 315-324
RESEARCH ARTICLE
Modeling and estimation on long memory stochastic volatility for index prices of FTSE Bursa Malaysia KLCI Kho Chia Chen a,*, Arifah Bahar a,b, Chee-Ming Ting c and Haliza Abd Rahman a a b c
Department of Mathematical Sciences, Faculty of Science, Universiti Teknologi Malaysia, 81310 UTM, Johor Bahru, Johor, Malaysia UTM Centre for Industrial & Applied Mathematics (UTM-CIAM), Universiti Teknologi Malaysia, 81310 UTM, Johor Bahru, Johor, Malaysia Center for Biomedical Engineering, Universiti Teknologi Malaysia, 81310 UTM, Johor Bahru, Johor, Malaysia
* Corresponding author:
[email protected]
Article history Received 24 October 2017 Accepted 8 November 2017
Modeling and Estimation on LMSV
Graphical abstract
Modeling of LMSV Data transformation Parameters Estimation Simulation Assesment
Abstract Long memory and volatility have been used to measure risks associated with persistence in financial data sets. However, the persistence in volatility cannot be easily captured because some mathematical models are not able to detect these properties. To overcome this shortfall, this study develops a procedure to construct long-memory stochastic volatility (LMSV) model by using fractional OrnsteinUhlenbeck (fOU) process in financial time series to evaluate the degree of persistence property of the data. Procedures for constructing the LMSV model and the estimation methods were applied to the real daily index prices of FTSE Bursa Malaysia KLCI over a period of 20 years. The least square estimator (LSE) and quadratic generalised variations (QGV) methods were used to estimate the drift and diffusion coefficient of the volatility process respectively. The long memory parameter was estimated by the detrended fluctuation analysis (DFA) method. The findings show that the volatility of the index prices exhibited a long memory process but the returns of the index prices did not show strong persistence properties. The root mean square errors (RMSE) obtained from various methods indicated that the performances of the model and estimators in describing returns of the index prices were good. Keywords Long memory stochastic volatility, fractional Ornstein-Uhlenbeck, least square estimator, quadratic generalized variations; detrended fluctuation analysis
© 2017 Penerbit UTM Press. All rights reserved
INTRODUCTION A typical financial time series of returns has many common empirical properties or so-called “stylized facts”, such as excess kurtosis, volatility clustering and almost no serial correlation in the level but with a persistent correlation in the squared returns and absolute returns, which can be explained by an appropriate volatility model. The volatility of the prices has significant influence on the dynamics of the financial time series. The very first success and famous mathematical option pricing model namely the Black-Scholes option pricing model which assumed that the volatility is constant had been argued by many studies [1, 2]. The constant volatility assumption is inconsistent with the empirical observation of varying volatility across different times. Volatility is an essential factor in measuring the variability in price movements. This is because volatility is affected by unpredictable changes such as the performance of the industry, political stability of a particular country, news about new technology, natural disaster, product recalls and lawsuits that shall have both positive and negative impacts to the relevant company stocks. Thus, an appropriate model for volatility will help to improve the measurement and provide useful information to the investors and economist. Over the past two decades, many stochastic volatility (SV) models and estimation methods have been introduced to explain the market tendency. Stochastic volatility models have become popular for derivative pricing and hedging since the existence of a non-constant volatility surface has been classified. Recent studies have shown that some of the financial data exhibit the properties of long-range
dependence. However, these properties cannot be captured by the ordinary stochastic models. The long memory in the volatility of the financial data had been discovered in the early 1990s. Ding, Granger [3] were among the first to investigate that there is a strong correlation between absolute returns of the daily S&P 500 index prices. The fractional power transformations of the absolute returns showed high autocorrelations for high lags which provide the evidence of long-range dependence [46]. Besides that, the long term correlation is also found in the squared returns on various financial markets [7-9]. The early study of SV models was mainly focusing on short memory volatility process. The long memory stochastic volatility (LMSV) model which is appropriate for describing series of financial returns at equally-spaced intervals of time had received extensive attention for the last few years. Breidt, Crato [10] and Harvey [11]were among the first who suggested that a long memory stochastic volatility (LMSV) in discrete time where the log-volatility is modeled as an autoregressive fractional integrated moving average (ARFIMA) process. Comte and Renault [12] proposed a continuous time fractional stochastic volatility model which adopts the fractional Brownian motion to replace the Brownian motion. The estimation of the volatility process is one of the most difficult and complicated problems in econometrics. There are no ideal volatility simulation techniques or volatility data collections. The main difficulties is the fact that volatility itself is never directly observed. Therefore, in practice, one would be restricted to use the values of asset at discrete time even for the most liquid indexes or assets. Thus, we
315
Chen et al. / Malaysian Journal of Fundamental and Applied Sciences Special Issue on Some Advances in Industrial and Applied Mathematics (2017) 315-324
propose a procedure to estimate the volatility process of the financial data series. In this study, a long memory stochastic volatility model will be constructed in the state space form using fractional OrnsteinUhlenbeck process that can capture the characteristic observed in the financial time series. The LMSV model is more flexible assuming the volatility follows an autonomous and latent stochastic process. This model can provide a useful way of modeling the relationship between the returns and the volatility of the series exhibiting strong persistence in its level yet with varying time. The estimated parameters on drift, diffusion coefficient and Hurst parameter in the model are practically useful for investor to have a clear picture on characteristics of the index prices. This study aims to determine the properties of FTSE Bursa Malaysia KLCI index prices via the long memory stochastic volatility models to solve the problem of excessive persistence in the composite linear and nonlinear models by introducing a probabilistic approach in allowing different volatility states in time series. METHODOLOGY This section introduces the modeling and parameters estimation of long memory stochastic volatility. First, the LMSV model specification is presented. Next, the methods for testing the existence of long memory are discussed. Then, the methods of parameters estimation on the drift and diffusion coefficient of the volatility process in LMSV models are also discussed. Lastly, the performance of the model and parameters estimation methods are assessed. LMSV Model specification Using existing approach, assume that is a complete probability space. The long memory stochastic volatility model can be specified in the state space form, as follows:
X t k t t
t ~ N (0, n2 )
(1)
dYt Yt dt dBtH
(2)
where X t , t 0 is the series of returns at time t, t exp(Yt 2 ) and k is a constant coefficient. The
t
given
is mutually
independent Gaussian white noise process with variance, n . The 2
volatility process
H Yt , t 0 is modelled to follow th {Bt , t 0} e
fractional Ornstein-Unlenbeck process (fOU), where is the drift, β is the volatility of the volatility, and is the fractional Brownian motion with Hurst index H (0,1) . The fractional Brownian motion, H t
stationary increments which imply that {B } H H Var[ Bt Bs ] | t s |2H , and this relation defines its covariance structure:
s ,
Thus, for H
(3)
1 the fOU process is neither Markovian nor 2
semimartingale but still remains Gaussian and ergodic. For H 1 ,
2
t
a
e s dBsH , t a, exist as a Riemann-Stieltjes path-
wise integral which is almost surely continuous in t, and t
Z tH , y0 : e t ( y0 e s dBsH ),
t 0,
0
the unique almost surely continuous process that solves equation (4). In particular, the restriction to positive t’s of the almost surely continuous process t 𝑡 ∈ ℝ, Z H : e ( t s ) dB H ),
t
s
H
solves (2.4) with initial condition y0 Z0H . Clearly, the ( Zt )tR is a Gaussian process that follows the stationarity of the increments of fractional Brownian motion that it is stationary. In addition, for every initial condition
y0 L0 ()
as in the Brownian motion case,
ZtH ZtH , x0 et (Z0H y0 ) 0, as t , almost surely, which implies that every stationary solution of (2.4) has the same distribution as ( ZtH )t 0 . The (ZtH , x )t 0 is mentioned as a 0
fractional Ornstein-Uhlenbeck process with initial condition (Z
H t
)t
y0
and
a stationary fractional Ornstein-Uhlenbeck process where
( ZtH )t is ergodic, and it exhibits as long range dependence for 1 H . Due to the fact that one can estimate H and without 2
having the knowledge on , the procedure to estimate the unknown parameter (, , H ) will be carried out in several steps. The theorem of the covariance of the fOU is shown in Appendix A.
Estimation on long memory using Detrended Fluctuation Analysis Peng, Buldyrev [13] proposed the detrended fluctuation analysis (DFA) to examine the long range power law correlation of DNA nucleotides. DFA employs measurements of dispersion which take the squared fluctuations around the trend of time series. DFA is used to estimate power law scaling (Hurst exponent, H) of a series in the presence of nonstationary, besides eliminating spurious detection of long-range dependence. Detrending operation performed on the sub period gives protection against nonstationaries effect. However, DFA is also an ideal method to investigate both long-range and short range correlation in stationary and non-stationary series. The steps of DFA method are as follows: 1.
Integrate the time series (with N samples) to be analysed. Next, the integrated time series is divided into n nonoverlapping segments.
2.
Calculate the local trend, n for each of the segments using least-square regression. Next, we detrend the integrated time series, y(k ) , by subtracting the local trend, yn (k ) , in each segmentation. The root-mean-square fluctuation of this integrated and detrended time series is calculated by
has
1 Cov ( BtH , BsH ) (| t | 2 H | s | 2 H | t s | 2 H ) 2
y (k )
F ( n)
1 N
N
[ y (k ) y k 1
n
(k )]2
(5)
the fOU process will exhibit long memory property. where N is the total of sample size.
Equation (2.2) can be explicated t
Yt y0 e t e (t s ) dBsH , t 0, 0
Let (𝐵𝑡𝐻 )𝑡∈ℝ be a fractional Brownian motion with
y0 L (). 0
316
Let
a
X 0 x0 .
H (0,1)
(4)
and
and , 0. Then for all
This process is repeated for the whole signal at a range of different window sizes n, and a log-log graph of n against F(n) is constructed to test the self-similarity (fractal properties). A linear relationship on a log-log plot indicates the presence of power law scaling. Then, the fluctuations are characterized by a scaling exponent, , which is calculated as the slope of a straight line is related to log F(n) against log n.
Chen et al. / Malaysian Journal of Fundamental and Applied Sciences Special Issue on Some Advances in Industrial and Applied Mathematics (2017) 315-324
F (n) Cn
T
ˆT
log F (n) log n log C
YT2 T
2 Yt 2 dt
2
H 0
0.5 1
=1
1/ f
1
non-stationary, correlation exists but not to be of a power-law form
ˆ
1 N
Bardet and Kammoun [14] suggested the asymptotic properties of DFA for the fractional Gaussian noise which are also extended to a general class of stationary long range dependent processes. The asymptotic behaviour of the DFA for the FGN can be written as 𝐹(𝑛) ≃ 𝑐(𝜎, 𝐻). 𝑛𝐻 ,
Let
where c is a positive function and depends only on and H. They claimed that the estimator of the long range dependence parameter is convergent with reasonable convergence rate in the semi-parametric frame of long memory stationary process but do not converge in numerous cases of trended long range dependent process. In addition, Løvsletten [15] had showed the consistency of detrended fluctuation analysis where the scaling function 𝐹(𝑛)~𝑛𝐻 for both stationary stochastic process with 0 H 1, and non-stationary processes with
1 H 2. Drift estimation on the volatility process using least square estimator The least square estimator was used to estimate the drift parameter,
as in Equation (2.2). By considering that Equation (2.4) is driven by H fBm, B with H 1 . Let y0 0 and 0, then the solution is
X n 1
n
a k 0
k
for 0
k 0
which can be normalised as
0
T
0
where
0
,
a ak2 k ' 0
Since
a k
1 k
0
L
k
ak 1. The expanded filter
if
2K
a k k 0
2 k
k 2k ' otherwise
for
0 k 2K
K
r
2 2r k r ak , a is filtered similar to a . Istas and
k 0
Lang [19] showed that the generalized quadratic variations associated to the filter a are denoted as 2
K ak X i k . i 0 k 0 N K
(6) Consequently, denote
(7)
Yt 2 dt
(i ) mK
am ,an H
k 0
Yt dBtH is a divergence-type integral (see Biagini, Hu [17]
nK 0
akm a n mk n i
(mn) H k , ak a k
Then, the estimator of H and
2H
2H
.
can be defined as follows:
V ˆ 1 log N , a 2 H N 2 2 VN , a
and Duncan, Hu [18]). The alternative expression for ˆT is provided as
and
a 2 associated to a will be considered as
and . Hu and Nualart [16] proposed the least square estimator as
K
(1) k 0
The estimation of the can be done without the knowledge on both H
ˆT
K
L 1
k 0
VN , a 0
T
.
a (a0 ,..., ak ) be a discrete filter of K 1, 𝐾 ∈ ℕ, with order
given as
Yt dBtH
(8)
is the empirical moment of order 2, given as The asymptotic distribution is given in Appendix 2
N
2
T
1 ˆ 2H N
L 1, K L , i.e. K
t
Diffusion Coefficient Estimation on the Volatility Process using Quadratic Generalized Variations Diffusion coefficient, in the discretely observed fractional Ornstein-Uhlenbeck process can be estimated using quadratic generalized variations (QGV). In this section, the Hurst exponent, H can be alternatively estimated simultaneously with the diffusion coefficient, as follows:
noise (pink noise)
Yt e ( t s ) dBsH .
is given as
B.
Brownian noise (integral of white noise)
= 1.5
Therefore, the estimator of
where correlated sequence, long range power-law correlation
Yt 2 dt
1 t 2 2(2 H 1) Yt dt lim Var (Yt ) t t 0 t 2 2 H
ˆ 2 ˆN ˆ 2 (2 H ˆ 1) N N
Uncorrelated sequence ,white noise
T
0
lim
anti-correlated sequence
= 0.5
2 H 2 e d dt
Consequently, the authors showed that
Table 1 Summary of scaling exponent, .
0 0.5
t
0
0
where C is constant. The scaling exponent is a measure of correlation in the noise and simply represents the estimation of Hurst exponent, H. When 0 1 , it shows the properties of fractional Brownian motion. The values of scaling exponent, which explain the series of self-correlations are summarised in Error! Reference source not found..
(9)
and
317
Chen et al. / Malaysian Journal of Fundamental and Applied Sciences Special Issue on Some Advances in Industrial and Applied Mathematics (2017) 315-324
ˆN
VN , a 2 a a k, k k
1
ˆ 2H N
ˆ
2NH N
2
(10) The asymptotic distribution is shown in Appendix C. Simulation of LMSV model After estimating all the parameters, (, , H ) in the model is based on the real data, the Monte Carlo simulation method was employed to simulate the path of LMSV process. The sequence of the LMSV process as proposed by Euler Maruyama discretization in Equation (1) and Equation (2) is defined below:
X i : X i 1 X i keYi /2 i
(11)
Yi : Yi 1 Yi Yi t ( BtHi1 BtHi )
(12)
The following algorithm can be used to show the numerical illustrations of the LMSV model on the real data of FTSE Bursa Malaysia KLCI index prices Step 1: Generate stationary fractional Gaussian noise via fast Fourier transform and obtain the fractional Brownian motion, where fBm is defined as partial sum of fGn. Step 2: Simulate the process Y (.) as in Eq. (12) using EulerMaruyama method for different values of , and H for fixed length t 1 of samples particles, nT 2 ^12. Step 3: A sample path of p=100 is simulated. Then, the average of each point of the sample path will be taken. Step 4: Generate Gaussian white noise. Then, the processes X () are simulated using the result of Y () for different values of k with assumption that k 1. Step 5: Calculate the root mean square error (RMSE) between the estimated returns (the processes of X () ) and the empirical returns (log returns).
1500 1000 500
closing index prices
RESULTS AND DISCUSSION This section discusses the FTSE Bursa Malaysia KLCI index prices data and its transformation. Then, there is a discussion on the results of the parameters estimation on the LMSV model. Lastly, the numerical illustration on the LMSV model is presented by comparing the empirical returns with estimated returns.
1995
2000
2005
2010
0.4 0.0
ACF
0.8
Time
0
50
100
150
200
Lag
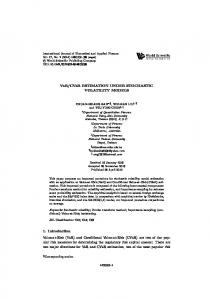
Fig. 1 Index prices of FTSE Bursa Malaysia KLCI (3rd December 199331st December 2013) and ACF.
318
Data Description and Transformation The historical prices of FTSE Bursa Malaysia KLCI, beginning from 3rd December 1993 until 31st December 2013, containing 4954 data, were analyzed through graphical representation of the time series data which was carried out using the scatter plot. Figure 1 shows the closing index prices of FTSE Bursa Malaysia KLCI which were volatile during this period. The index prices decreased sharply and reached the lowest point at 262.7 on 1st September 1998. It might be due to the implementation of exchange control on 1st September 1998. The index prices fell sharply again after the burst of the U.S. housing bubble in year 2008. Nevertheless, the trend of index prices from May 2009 started to pick up and eventually surpassed 1872.52 points in December 2013, which was the highest point among these periods. Meanwhile, the autocorrelation plot of the closing index prices shows it decayed rather quickly along the period. Table 2 shows the statistical properties of the index prices of FTSE Bursa Malaysia KLCI. It can be observed that the value of standard deviation is very high which indicates that the fluctuation of the price is very volatile. The positive value of the skewness indicates that the distribution is right-skewed, which can also be interpreted that the mass of the distribution is concentrated on the right. The positive kurtosis shows a leptokurtic condition, which has a more significant peak around the mean and fatter tails than normal. This phenomenon indicates that the inflation rate was higher than expected during that period. Table 2 Descriptive statistics of index prices. Mean
1037.53
Median
966.83
Standard deviation
339.0608
Skewness
0.4368
Kurtosis
2.4183
From the plot as shown in Figure 1, it is easy to recognize the apparent trend where the prices may be non-stationary. Usually, the common practice in handling financial data analysis is to construct stationary processes. Box and Jenkins [20] suggested that a nonstationary time series can often be made stationary by differencing the series until stationarity is reached. Analysis on the difference of the logarithm of the closing index prices, which is also known as returns or sometimes simply returns, is carried out as explained below. The following part explains how data is transformed into a logarithmic form to achieve weakly stationary time series. Analysis is conducted on different logarithmic of closing index prices, known as returns. Relatively, the proxies of volatility are represented by the absolute returns and squared of returns. Consequently, their descriptive statistics and their autocorrelation will be evaluated. The autocorrelation function (ACF) is applied to provide preliminary information corresponding to the internal organisation of each time series data. As stated by Beran [21], a long memory process is a stationary process with a hyperbolically decaying autocorrelation function. Accordingly, the returns is defined as X t log(St ) log(St 1 ) log(St / St 1 ) (13) where { X t , t 0} is the returns and {St , t 0} is the closing index prices of FTSE Bursa Malaysia KLCI. Next, the statistical properties of the data were analysed based on their mean, standard deviation, skewness, kurtosis and coefficient of variation (CV). CV is the ratio of the standard deviation to the mean, which is a statistical measure of the distribution of data points in a series around the mean. The CV measures how far away the data is from the mean. Series with CV 1 are considered to have low-variability, whereas those with CV 1 are considered to have high variability.
Chen et al. / Malaysian Journal of Fundamental and Applied Sciences Special Issue on Some Advances in Industrial and Applied Mathematics (2017) 315-324 Table3 Descriptive statistics for the series of X t , | X t | and X t2
Median
Standard deviation
Skewness
Kurtosis
CV
Xt
0.000121
0.000274
0.015111
0.4058
56.5694
124.8843
| Xt |
0.008318
0.005000
0.012615
7.4107
91.0846
1.5165
X t2
0.000228
0.000025
0.001702
21.5715
557.0169
7.4649
Log-returns Log-returns
Mean
-0.2-0.1 -0.10.00.0 0.10.1 0.20.2 -0.2
Data
ACF ACF
2000 2000
Time Time
2005 2005
2010 2010
0.00.00.20.20.40.40.60.60.80.81.01.0
1995 1995
0 0
50 50
100 100 Lag Lag
150 150
200 200
Fig. 2 The returns of the FTSE Bursa Malaysia KLCI index and ACF
0.04 0.00
0.02
Squared returns
0.06
0.15 0.20 0.25
Squared Returns
0.00 0.05 0.10
Absolute returns
Absolute Returns
0
1000
2000
3000
4000
5000
0
1000
2000
3000
4000
5000
Day
0.3 ACF
0.0
0.0
0.1
0.2
0.2 0.1
ACF
0.3
0.4
0.4
0.5
Day
0
50
100
150
200
Lag
0
50
100
150
200
Lag
Fig. 3 The proxies of volatilities of the FTSE Bursa Malaysia KLCI index and ACF
Table 3 summarizes the statistical properties for the series of X t , 2 t
| X t | and X . From the results, it can be seen that the standard deviations for all data set were greater than the corresponding mean values. Therefore, the CV values were all greater than 1, indicating that the returns and the volatility of returns fluctuated significantly through
time. All data sets presented positive values for skewness and kurtosis, which had the same statistical properties as the closing index price of FTSE Bursa Malaysia KLCI. However, the kurtosis of squared returns,
X t2 showed an extreme high value, indicating that there was sharp peak around the mean with fatter tails distribution.
319
Chen et al. / Malaysian Journal of Fundamental and Applied Sciences Special Issue on Some Advances in Industrial and Applied Mathematics (2017) 315-324
Figure 2 shows the plot of returns and its ACF, while, Figure 3 shows the plot of the proxies of volatilities and their ACF. Autocorrelation function provides a measure of temporal correlation between the time series data with different time lags. For a purely random process, all autocorrelation coefficients ρ shall be set to zero, except for ρ (0) which is equal to 1. If the variables of a time series are strongly correlated, it can be referred as series with long range dependence, generated by stochastic processes. As seen in Figure 2, the ACF plot shows a slightly correlated structure of the returns. The plots indicate that the returns were weakly stationary and perhaps as uncorrelated sequence (white noise). Thus, it is hard to determine if the series fulfilled the long memory property to describe the high-order correlation structure of a time series. However, there are some empirical evidences which claim that the volatility of the price may exhibit long memory [3, 10, 11, 22]. Ding, Granger [3] were among the first to observe that there is a substantial correlation between absolute returns of the daily S&P 500 index prices. Also, Breidt, Crato [10] and Lobato and Savin [23] found that long term correlation exist in the squared returns on various US indexes. Therefore, absolute returns, | X t | and squared returns, X t2 had been employed as the proxies for volatilities in our study. Figure 3 shows the plot of the volatilities and their ACF. Apparently, the autocorrelation plots in Figure 3 were positive correlated which could decay up to 200 long lags. The ACF plot of the
absolute returns decayed slowly at hyperbolic rate. This can be considered as the main characteristic of long-range dependence appearance in time series data. However, the hyperbolic decay rate in the ACF plot of squared returns was not apparent. Thus, the following section will discuss the estimation of the long memory parameter and the parameters of the LMSV model. Parameters Estimation of the LMSV In this section, the DFA method is employed to estimate the long memory parameter which is also known as the Hurst parameter, H. Next, the drift and diffusion coefficient parameters of the volatility process which are constructed by the fOU model will be estimated using the LSE and the QGV methods respectively. Figure 4(a-c) present the plot of the magnitude of detrended fluctuations at different scales (window sizes: t) for X t , | X t | and X t2 whose scaling exponents were approximately 0.52, 0.76 and 0.67 respectively. The results showed that the proxies of volatilities, | Xt | and X t2 exhibited as long memory where H>0.5. Meanwhile, the persistence of the long memory is not very obvious in the returns, as H 0.5.
Scaling exponent estimate = 0.52 20
50
100
0.10 0.05 0.02 0.01
0.03
0.05
Fluctuation function: F(t)
Detrended fluctuation analysis
0.02
Fluctuation function: F(t)
Detrended fluctuation analysis
10
Xt
Scaling exponent estimate = 0.76 10
200
20
50
Window size: t
100
200
Window size: t
(b) Absolute returns, | X t |
(a) Returns, X t
0.010 0.005 0.002
Fluctuation function: F(t)
Detrended fluctuation analysis
Scaling exponent estimate = 0.67 10
20
50
100
200
Window size: t
(c) Squared returns, X t2 Fig4(a-c) DFA plots with estimated Hurst Exponent for X t , | X t | and X t2 respectively
Table 4 Parameters estimation of
and with known H and
RMSE between simulated fOU process and data
320
(QGV)
Data
| Xt |
0.38476
0.01932
0.7637
0.0217
X t2
0.49944
0.00215
0.6671
0.0022
(LSE)
H
(DFA)
RMSE
As shown by the results in Table 4, the value of the drift parameter indicates the volatility process was ergodic where 0 for our LMSV model as shown in Eq.2. Meanwhile, the diffusion coefficient of the volatilities had a quite small value, implying that the fluctuation of index prices was not very significant over the period. Therefore, it can be described that the FTSE Bursa Malaysia KLCI is not a high risk investment. Simulation of the fOU process using the parameter estimated had been conducted as well. The root mean square error (RMSE) between the simulated fOU process and the empirical data had also been calculated. The RMSE between the squared returns and its simulated fOU process was smaller than the absolute returns. This indicates that squared returns were more suitable to be chosen as the proxy of volatility for the estimation of the LMSV model. The
Chen et al. / Malaysian Journal of Fundamental and Applied Sciences Special Issue on Some Advances in Industrial and Applied Mathematics (2017) 315-324
assessment of the LMSV model with the parameters estimated will be explained in the next section. Numerical illustrations of LMSV model This section explains the numerical simulation for different values of , , and H to illustrate the performance of the estimators. The constant value, k had been selected empirically so that the simulated data from the LMSV model would be closer to the true values based on visual inspection. The estimation procedures by Monte Carlo simulation method are described in detail below. The method of circulant embedding proposed by Dietrich and Newsam [24] was applied to generate the stationary fractional Gaussian noise via fast Fourier transform. Then, the fBm was obtained, defined as partial sums of the fGn. The processes Y () as in Equation (12) were simulated using Euler-Maruyama method for different values of , , and H as shown in Table 4. Then, the processes X () as in Equation (11) were simulated using the result of Y () for different values of k with assumption that k 1. A sample path of p=100 were simulated for a fixed length t 1 of samples particles, nT 2 ^12. Then, the average of each point of each sample path was taken. The root mean square error (RMSE) between the simulated returns and the empirical returns was calculated to illustrate the performance between the estimators and the LMSV model.
kurtosis. It is worth to notice that when k 0.01 , the values of mean and median of the estimated returns were closer to the empirical returns, X t as shown in Table 3. Overall, the skewness and kurtosis of the estimated returns were different from the empirical returns. The value of skewness was near to 0 and the kurtosis of the estimated returns was smaller, indicating the peaks were not very significant around the mean and near normal distribution. This scenario might be due to the Gaussian white noise contained in the simulation of the estimated returns. When compared the absolute returns (Table 5) with square returns (Table 6), the volatility proxies for the estimation of the volatility process for our estimated returns showed only little difference between the results. This indicates that both proxies are suitable to be used for estimating the volatility process of the FTSE Bursa Malaysia KLCI index prices. Figure 5(a-d) illustrates the volatility process based on fOU model, which was estimated using X t for different constant, k with sample path, p 100 , and the comparison between the empirical returns and estimated returns. Meanwhile, Figure 6 (a-d) depicts the volatility process described by fOU model using X t2 for different constant, k with sample path, p 100, and the comparison between the empirical returns and estimated returns. Volatility Process based on fOU model
Table 5 Descriptive statistics of estimated returns, and the RMSE between estimated returns and empirical returns from | X t | with
p 100 .
0.02 0.01 0 -0.01
0.38476, 0.01932, H 0.7637
p
-0.02
0
500
100
1000
1500
2000
2500
3000
3500
4000
4500
5000
Estimated returns based on LMSV model 0.4
k Mean
0.001
0.010
2.1119 10
5
5
1.0802 10
4
1.0589 10
4
0.100 -0.0034
1.000 0.0068
0.2
-0.0053
0.0133
-0.2
Median
3.2332 10
Standard Deviation
9.9259 104
0.0098
0.0999
1.0002
Skewness
-0.0568
0.0449
0.0722
-0.0134
Kurtosis
3.1196
2.9453
2.9966
2.9582
RMSE
0.0151
0.0182
0.1010
1.0004
Empirical Estimated
0
-0.4
0
500
1000
1500
2000
a)
2500
3000
3500
4000
4500
5000
k=0.01
Volatility Process based on fOU model 0.02 0.01 0
Table 6 Descriptive statistics of estimated returns, and the RMSE between estimated returns and empirical returns from X t2 with p 100
-0.01 -0.02
0
500
1000
1500
2000
2500
3000
3500
4000
4500
5000
Estimated returns based on LMSV model
0.49944,
p
0.00215,
0.4
H 0.6671
Empirical Estimated
0.2
100
0
k
0.001
0.010
0.100
1.000
-0.2
Mean
7.0294 106
7.0289 105
6.9002 104
0.0069
-0.4
Median
9.1828 106
9.7787 105
0.0010
0.0100
Standard Deviation
0.0010
0.0100
0.0994
0.9943
Skewness
0.0114
0.0017
0.0018
0.0018
0.02
Kurtosis
3.0233
2.9450
3.0932
3.0932
0.01
RMSE
0.0151
0.0178
0.1009
0.9947
0
500
1000
1500
2000
b)
2500
3000
3500
4000
4500
5000
k=0.01
Volatility Process based on fOU model
0 -0.01 -0.02
Table 5 and Table 6 show the results of root mean square using the parameters estimation from the absolute returns, | Xt | and squared returns | X t | as proxies of volatility for a sample path of p=100 and different values of k, respectively. As shown in the results, the RMSEs between the estimated returns and the empirical returns were small. These results showed that the estimators applied in the LMSV model were good. The results also demonstrates the descriptive statistics which include mean, median, standard deviation, skewness and
0
500
1000
1500
2000
2500
3000
3500
4000
4500
5000
Estimated returns based on LMSV model 0.5 Empirical Estimated 0
-0.5
0
500
1000
1500
2000
c)
2500
3000
3500
4000
4500
5000
k=0.1 321
Chen et al. / Malaysian Journal of Fundamental and Applied Sciences Special Issue on Some Advances in Industrial and Applied Mathematics (2017) 315-324 Volatility Process based on fOU model
Volatility Process based on fOU model
-3
0.02
2
x 10
0.01
1
0 -0.01 -0.02
0 0
500
1000
1500
2000
2500
3000
3500
4000
4500
5000
-1
0
500
1000
1500
2000
2500
3000
3500
4000
4500
5000
Estimated returns based on LMSV model
Estimated returns based on LMSV model
4
5
Empirical Estimated
2
Empirical Estimated
0
0 -2 -4
0
500
1000
1500
2000
d)
2500
3000
3500
4000
4500
5000
Xt
Volatility Process based on fOU model
-3
1000
1500
2000
2500
3000
3500
4000
4500
5000
d) k=1 Fig 6(a-d) FOU volatility process based on X 2 , and the comparison t between the empirical returns and estimated returns for different k
As shown by Figure 5(a-d) and Figure 6(a-d), when k 0.01, the estimated returns followed the trend of empirical returns closely. It can be seen that the range of k value was close to the value of standard deviation of the empirical returns, where X 0.015111. Therefore,
1 0 -1 -2
500
, and the comparison
between the empirical returns and estimated returns for different k
x 10
0
k= 1
Fig 5(a-d) FOU volatility process based on
2
-5
t
0
500
1000
1500
2000
2500
3000
3500
4000
4500
5000
Estimated returns based on LMSV model 0.4 Empirical Estimated
0.2
the constant, k can be considered to replace with the X in the LMSV t model.
0
CONCLUSION
-0.2 -0.4
0
500
1000
1500
2000
2500
a)
3500
4000
4500
5000
k=0.001
Volatility Process based on fOU model
-3
2
3000
x 10
1 0 -1 -2
0
500
1000
1500
2000
2500
3000
3500
4000
4500
5000
Estimated returns based on LMSV model 0.4
This study demonstrates that the volatility of financial time series is characterized by long memory behavior. The development of a general framework had been proposed for detection of long memory process on the financial time series of the FTSE Bursa Malaysia KLCI index prices for the period from 3rd December 1993 to 31st December 2013. The procedures have been established to construct the LMSV model and the estimation methods are appropriate to explain the market tendency in Malaysia. This study presents the results of the estimated volatility process based on the proxies of volatilities, where the parameters of the LMSV model have been correspondingly estimated. The proposed LMSV model has been shown effective in modeling the behavior of the returns of FTSE Bursa Malaysia KLCI index prices.
Empirical Estimated
0.2 0
ACKNOWLEDGEMENT
-0.2 -0.4
0
500
1000
1500
2000
2500
3500
4000
4500
5000
k=0.01
b)
I would like to express my gratitude to the Ministry of High Education (MOHE), STEM Grant with vote no. A. J091002.5600.07397 and Universiti Teknologi Malaysia under vote 4f440 and flagship statistical literacy 3g054 for the financial support in carrying out this research.
Volatility Process based on fOU model
-3
2
3000
x 10
REFERENCES 1
[1]
0
-1
0
500
1000
1500
2000
2500
3000
3500
4000
4500
5000
[2]
Estimated returns based on LMSV model 0.5 Empirical Estimated
[3]
0
[4] -0.5
0
500
1000
1500
2000
2500
3000
3500
4000
4500
5000
[5]
c) k= 0.1
322
Chronopoulou, A. and F.G. Viens. Stochastic volatility and option pricing with long-memory in discrete and continuous time. Quantitative Finance. 2012. 12(4): 635-649. Casas, I. and J. Gao. Econometric estimation in long-range dependent volatility models: Theory and practice. Journal of Econometrics. 2008. 147(1): 72-83. Ding, Z.X., C.W.J. Granger, and R.F. Engle. A long memory property of stock market returns and a new model. Journal of Empirical Finance. 1993. 1(1): 83-106. Crato, N. and P.J. de Lima. Long-range dependence in the conditional variance of stock returns. Economics Letters. 1994. 45(3): 281-285. Deo, R.S. and C.M. Hurvich. On the log periodogram regression estimator of the memory parameter in long memory stochastic volatility models. Econometric Theory. 2001. 17(04): 686-710.
Chen et al. / Malaysian Journal of Fundamental and Applied Sciences Special Issue on Some Advances in Industrial and Applied Mathematics (2017) 315-324 [6]
[7] [8]
[9]
[10]
[11]
[12] [13]
[14]
[15]
Ezzat, H.2013. Long Memory Processes and Structural Breaks in Stock Returns and Volatility: Evidence from the Egyptian Exchange. University Library of Munich, Germany. Casas, I. Estimation of stochastic volatility with LRD. Mathematics and Computers in Simulation. 2008. 78(2–3): 335-340. Xie, L. Long-Memory Stochastic Volatility Models: A New Method for Inference and Applications in Option Pricing. in Department of Statistics. Carnegie Mellon University. 2008. p. Günay, S. Long Memory Property and Structural Breaks in Volatility: Evidence from Turkey and Brazil. International Journal of Economics and Finance. 2014. 6(12): 119. Breidt, F.J., N. Crato, and P. De Lima. The detection and estimation of long memory in stochastic volatility. Journal of econometrics. 1998. 83(1): 325-348. Harvey, A.C. Long Memory in Stochastic Volatility. In Forecasting Volatility in The Financial Markets Oxford ,Boston: Butterworth Heinemann. 307-320. 1998. Comte, F. and E. Renault. Long memory in continuous-time stochastic volatility models. Mathematical Finance. 1998. 8(4): 291-323. Peng, C.K., et al. Mosaic organization of DNA nucleotides. Physical review.E, Statistical physics, plasmas, fluids, and related interdisciplinary topics. 1994. 49(2): 1685. Bardet, J.-M. and I. Kammoun. Asymptotic properties of the detrended fluctuation analysis of long-range-dependent processes. IEEE Transactions on information theory. 2008. 54(5): 2041-2052. Løvsletten, O. Consistency of detrended fluctuation analysis. arXiv preprint arXiv:1609.09331. 2016.
[16] Hu, Y. and D. Nualart. Parameter estimation for fractional Ornstein– Uhlenbeck processes. Statistics & Probability Letters. 2010. 80(11): 10301038. [17] Biagini, F., et al. Stochastic calculus for fractional Brownian motion and applications: Springer Science & Business Media. 2008. [18] Duncan, T.E., Y. Hu, and B. Pasik-Duncan. Stochastic calculus for fractional Brownian motion I. Theory. SIAM Journal on Control and Optimization. 2000. 38(2): 582-612. [19] Istas, J. and G. Lang. Quadratic variations and estimation of the local Hölder index of a Gaussian process. in Annales de l'IHP Probabilités et statistiques. 1997. [20] Box, G.E.P. and G.M. Jenkins. Time series analysis: forecasting and control. 2nd ed: Holden-Day. 1976. [21] Beran, J. Statistics for long-memory processes Vol. 61. CRC Press. 1994. [22] Comte, F. Long memory in continuous-time stochastic volatility models. Mathematical finance. 1998. 8(4): 291-323. [23] Lobato, I.N. and N.E. Savin. Real and spurious long-memory properties of stock-market data. Journal of Business & Economic Statistics. 1998. 16(3): 261-268. [24] Dietrich, C. and G.N. Newsam. Fast and exact simulation of stationary Gaussian processes through circulant embedding of the covariance matrix. SIAM Journal on Scientific Computing. 1997. 18(4): 1088-1107. [25] Cheridito, P., H. Kawaguchi, and M. Maejima. Fractional ornsteinuhlenbeck processes. Electron. J. Probab. 2003. 8(3): 14. [26] Brouste, A. and S. Iacus. Parameter estimation for the discretely observed fractional Ornstein–Uhlenbeck process and the Yuima R package. Computational Statistics. 2013. 28(4): 1529-1547.
323
Author et al. / Malaysian Journal of Fundamental and Applied Sciences Special Issue on Some Advances in Industrial and Applied Mathematics (2017) 315-324
APPENDICES
H2 (4 H 1) 1
(1 4 H )(4 H 1) . (2 2 H )(2 H )
Appendix A: Covariance of fOU [25] The proof of consistency and asymptotic distribution of the Least Squares Estimator had been studied by Hu and Nualart [16]. Theorem 2.1 Let H (0, 1 ) ( 1 ,1] and 𝑁 ∈ ℤ+ . Then for fixed 𝑡 ∈ ℝ and 2 2
s ,
Appendix C: Asymptotic distribution of QGV
Theorem 2.3: Let
be a filter of order L 2. As proposed by
a
Brouste and Iacus [26], the strong consistency of both estimators Hˆ N Cov(Yt H , Yt Hs )
1 2 N 2 n 2 n 1 ( (2 H k ) s 2 H 2 n O( s 2 H 2 N 2 ). 2 n 1 k 0
and ˆN is given as
Hˆ The next corollary which has been proven by Cheridito, Kawaguchi [25] shows that the solution value of
(Yt H , x )t 0
of (4) with the deterministic
Y0H , x 𝑥 ∈ ℝ, Cov(Yt H , x , Yt Hs, x ),
for
s ,
N
For all H (0,1), as N property is defined as
decays like a power function of the order 2 H 2 as well.
t0
for fixed
and
It is worth to notice that the decay of Cov(Yt H , Yt Hs ), for
Cov( BH (h t ) BH (h), BH (h s t ) BH (h s )) ,
for H
for
is ergodic, and it exhibits long range dependence
1 . 2
Theorem 2.2: Let H 1 , 3 , 2 4 and
a
mesh
Yt , 0 t T
condition
NqN 0,
as given by Eq
q 1, and
N (log N )2 0 as N . Then, as N , a. s ˆN
and
L TN ˆN N 0, H2 2 (2 H )
where
324
The 1 ( , a ) and 2 ( , a ) are symmetric definite positive matrices, which depend on , H and the filter
a , which are written as
2 2 2 1 Ha,a (i)2 Ha ,a (i)2 2Ha,a (i)2 2log(2)2 i
2 and , a , a . 2 1
4
Appendix B: Asymptotic distribution of LSE
(2.6),
1 ( , a)
s
)t
N ˆ L N N 0, 2 , a . log N
s ,
it is very similar to the decay of
H
the asymptotical normality
And
s ,
1 N 2n1 Cov(Yt H , x , Yt Hs, x ) 2 2n (2H k ) s 2 H 2n et (t s)2 H 2n O(s 2 H 2 N 2 ). 2 n1 k 0
Therefore, (Yt
,
L N Hˆ N H N 0, 1 (, a)
Let H (0, 1 ) ( 1 ,1] , 𝑥 ∈ ℝ and 𝑁 ∈ ℤ+ . Then 2 2
Corollary 2.1
a.s . , ˆN H , as N .