sustainability Article
Modeling and Multi-Objective Optimization of Engine Performance and Hydrocarbon Emissions via the Use of a Computer Aided Engineering Code and the NSGA-II Genetic Algorithm Richard Fiifi Turkson 1,2,3, *, Fuwu Yan 1,2 , Mohamed Kamal Ahmed Ali 1,2,4 , Bo Liu 1,2 and Jie Hu 1,2 Received: 6 November 2015; Accepted: 8 January 2016; Published: 13 January 2016 Academic Editors: Muge Mukaddes Darwish and Marc A. Rosen 1
2 3 4
*
School of Automotive Engineering, Wuhan University of Technology, Wuhan 430070, China;
[email protected] (F.Y.);
[email protected] (M.K.A.A.);
[email protected] (B.L.);
[email protected] (J.H.) Hubei Key Laboratory of Advanced Technology for Automotive Components, Wuhan University of Technology, Wuhan 430070, China Mechanical Engineering Department, Ho Polytechnic, P.O. Box HP 217, Ho 036, Ghana Automotive and Tractors Engineering Department, Faculty of Engineering, Minia University, El-Minia 61111, Egypt Correspondence:
[email protected] or
[email protected]; Tel.: +86-136-2725-0700 or +233-2489-51963
Abstract: It is feared that the increasing population of vehicles in the world and the depletion of fossil-based fuel reserves could render transportation and other activities that rely on fossil fuels unsustainable in the long term. Concerns over environmental pollution issues, the high cost of fossil-based fuels and the increasing demand for fossil fuels has led to the search for environmentally friendly, cheaper and efficient fuels. In the search for these alternatives, liquefied petroleum gas (LPG) has been identified as one of the viable alternatives that could be used in place of gasoline in spark-ignition engines. The objective of the study was to present the modeling and multi-objective optimization of brake mean effective pressure and hydrocarbon emissions for a spark-ignition engine retrofitted to run on LPG. The use of a one-dimensional (1D) GT-Power™ model, together with Group Method of Data Handling (GMDH) neural networks, has been presented. The multi-objective optimization was implemented in MATLAB® using the non-dominating sorting genetic algorithm (NSGA-II). The modeling process generally achieved low mean squared errors (0.0000032 in the case of the hydrocarbon emissions model) for the models developed and was attributed to the collection of a larger training sample data using the 1D engine model. The multi-objective optimization and subsequent decisions for optimal performance have also been presented. Keywords: engine modeling; NSGA-II genetic algorithm; optimization; emissions
1. Introduction There is a growing global concern over depleting fossil fuel reserves and climate change issues resulting from industrial activities and the use of automobiles. The environmental footprint of automobiles is a result of an increase in the global fleet of vehicles, creating a high demand for fossil-based fuels. It is therefore feared that if this trend should continue, transportation and other activities that rely on fossil fuels may not be sustainable in the long term. In the search for these alternatives as a result of the concerns mentioned earlier, liquefied petroleum gas (LPG) has been
Sustainability 2016, 8, 72; doi:10.3390/su8010072
www.mdpi.com/journal/sustainability
Sustainability 2016, 8, 72
2 of 15
identified as one of the viable alternatives that could be used in place of gasoline in spark-ignition engines. The use of LPG as fuel leads to the reduction of emissions including Nitrogen oxides (NOX ) and Sulphur dioxide (SO2 ). Carbon dioxide emission reduction per kilowatt could also be associated with the use of LPG as fuel. LPG is cheaper to produce than gasoline, reduces the frequency of engine maintenance and facilitates a quick engine start from cold. Against a background of tightening emission legislation around the world coupled with rising fuel costs, the use of LPG as an alternative fuel is becoming widespread [1–9]. The objectives of modeling internal combustion engines may include the design of new engines, design of control systems and the prediction of engine performance without the extensive use of real dynamometer tests which may be expensive in terms of time and resources [10]. According to Tumelaire et al. [11], the use of simulation during the engine development process also facilitates the investigation of operational modes that could have a damaging effect on the engine if real dynamometer tests were used. On the other hand, engine calibration and testing is a process of adjusting the input parameters of an engine with the aim of improving driveability and fuel economy to satisfy customer demand or homologation [12–14] to ensure compliance with emission regulations [15,16]. In the calibration of an engine, an engineer is often faced with the problem of maximizing or minimizing certain engine responses, some of which may be conflicting as may be dictated by market demand and/or legislation. For example, two conflicting objectives may be to maximize the brake power while keeping carbon monoxide emissions at a minimum over the entire operating range of the engine. One way of dealing with this problem is the use of multi-objective genetic algorithms. The Group Method of Data Handling (GMDH) polynomial neural networks were used by Atashkari et al. [17] to model the effects of variable valve timing and engine speed on the engine torque output and fuel consumption, while the Non-dominating Sorting Genetic Algorithm (NSGA-II) was used for the multi-objective optimization process. In the study [17], an attempt was made to solve the conflicting objective problem of trying to maximize engine output torque while minimizing fuel consumption. In another study [18], a multi-objective optimization of output torque and NOx emissions was carried out for a single-cylinder gasoline engine for a motorcycle using a 1D fluid-dynamics model. The multi-objective optimization was carried out by comparing the performance of the ε-constraint and the NSGA-II algorithm methods of optimization. It was found in the study [18] that the multi-objective optimization solution for the NSGA-II algorithm was better than that of the ε-constraint method. In the work of Martinez-Morales et al. [19], artificial neural networks were used for the non-linear identification of a gasoline engine for the purpose of evaluating objective functions used within an optimization framework involving the use of the NSGA-II algorithm and the Multi-Objective Particle Swarm Optimization (MOPSO) algorithm. The objective of the study [19] was to optimize carbon monoxide (CO), unburnt hydrocarbons (HC) and nitrogen oxides (NOx ) emissions for the gasoline engine used for the study. It was observed, again, that the NSGA-II algorithm performed better than the MOPSO algorithm in the Pareto based optimization process. In the current study, the modeling and multi-optimization of brake specific hydrocarbon emissions and brake mean effective pressure for a gasoline engine, retrofitted to run on liquefied petroleum gas (LPG), is presented. The study involved the modelling of the target engine using the GT-Power™ 1D engine simulation code. Engine identification via the use of design of experiments (DoE) and trained GMDH polynomial neural networks is presented. The main inputs to the models were intake manifold length and fuel-air ratio (decision variables) and the outputs were brake mean effective pressure and hydrocarbon emissions. The NSGA-II genetic algorithm was chosen for the optimization because it has proven to give better optimal results compared to other optimization methods as observed in references [18,19]. Intake manifold length and fuel-air ratio were chosen as the decision variables because the design and optimization of engine performance relies on the tuning of the intake manifold system and fuel-air ratio [20]. A number of research activities have been conducted to demonstrate the effect of variable intake manifold length on the performance of gasoline engines and are well documented in references [21–24].
Sustainability 2016, 8, 72
3 of 15
2. Experimental Set-Up and Methods 2.1. Data Collection and Engine Modelling Data was collected for the study by running a four-cylinder, four-stroke Wuling B15 spark-ignition engine retrofitted to run on liquefied petroleum gas (LPG) using an AVL AC dynamometer, under wide-open throttle conditions. The data collected by testing the target engine (Wuling B15 engine) was used to calibrate a GT-Power™ version of the target engine to ensure that the 1D model of the engine Sustainability 2016, 8, 72 3 of 15 exhibited characteristics close to that exhibited by the target engine. Correlation between the model and 2.1. Data Collection and Engine Modelling was carried out by comparing the brake mean effective pressure and brake specific fuel consumption of the engine modelData andwas thecollected target engine, the model’s parameters for the and study adjusting by running a engine four‐cylinder, four‐stroke Wuling until B15 it exhibited spark‐ignition engine retrofitted run on This liquefied gas (LPG) using an AVL AC contained in characteristics close to that of the targetto engine. waspetroleum based on the recommendations dynamometer, under wide‐open throttle conditions. The data collected by testing the target engine GT-Power™ (Wuling B15 engine) was used to calibrate a GT‐Power™ version of the target engine to ensure that engine performance manual. Table 1 contains information that describes the target engine. the 1D model of the engine exhibited characteristics close to that exhibited by the target engine. Correlation between the model and was carried out by comparing the brake mean effective pressure Table 1. Target engine description. and brake specific fuel consumption of the engine model and the target engine, and adjusting the engine model’s parameters until it exhibited characteristics close to that of the target engine. This Description Details was based on the recommendations contained in GT‐Power™ engine performance manual. Table 1 contains information that describes the target engine. Engine type/Number of cylinders Four-stroke/four cylinders
Number of valves per cylinder 4 Table 1. Target engine description. Cylinder bore 74.7 mm Stroke 84.7 mm Description Details Engine type/Number of cylinders Four‐stroke/four cylinders Compression ratio 10.2:1 Number of valves per cylinder 4 Rated Power/Speed 79 KW@5400 rpm Cylinder bore 74.7 mm Idle speed 750 +/´ 50 rpm Stroke Compression ratio Rated Power/Speed the output of the Idle speed
84.7 mm 10.2:1 79 KW@5400 rpm engine and the GT 750 +/− 50 rpm
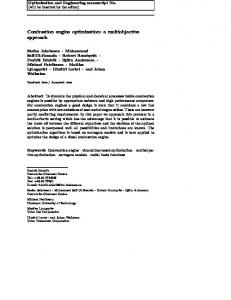
A comparison between target Power™ model results are shown in Figure 1. The compared results for brake mean effective pressure, brake specific fuel consumption, brake specific hydrocarbon emissions and brake power are represented by the graphs A comparison between the output of the target engine and the GT Power™ model results are shown in Figure 1. The compared results for brake mean effective pressure, brake specific fuel labeled a, b, c and d, respectively, in Figure 1. The trends indicated in the results for the engine model consumption, brake specific hydrocarbon emissions and brake power are represented by the graphs tracked the results obtained from testing the target engine reasonably well, with the average error labeled a, b, c and d, respectively, in Figure 1. The trends indicated in the results for the engine between experimental and simulated values being around 3%. This error margin was considered model tracked the results obtained from testing the target engine reasonably well, with the average error experimental and simulated values being around 3%. This error margin was reasonable for thebetween purpose of this study. considered reasonable for the purpose of this study.
Figure 1. Comparison between experimental and simulation results for (a) Brake mean effective pressure; (b) Brake specific fuel consumption; (c) Brake specific hydrocarbon emissions and; (d) Brake power.
Sustainability 2016, 8, 72
4 of 15
2.2. Design of Experiments and System Identification Using GMDH Polynomial Neural Networks The objective of using a statistical Design of Experiments (DoE) [25–27] is to use a few dynamometer measurements for the purposes of engine identification without losing vital information. The ultimate goal is to facilitate the reduction of the time spent on testing an engine on a dynamometer. This facilitates the collection of data to cover a wide operating range of the engine and decision variables. For the purpose of this study, the GT-Power™ model was used to generate data for 2000 engine operating points. This was considered sufficient for reducing the error of the engine models generated via the training of the GMDH polynomial neural networks. The primary aim of system identification in the current study was to obtain a function fˆ in place of an original function f for estimating the system’s output yˆ as close as possible to the actual output y for an input vector X “ px1 , x2 , x3 , . . . , xn q using trained GMDH polynomial neural networks. The GMDH is the most appropriate method for obtaining the polynomial description of a stochastic system from a small amount of experimental data [28]. In generic terms, the input–output relationship based on the decision variables could be expressed using the Volterra functional series otherwise known as the Kolmogorov-Gabor polynomial [29,30]. The aforementioned functional series could be represented as follows: y “ a0 `
n ÿ i “1
`ai xi `
n ÿ n ÿ
aij xi x j `
i “1 j “1
n ÿ n ÿ n ÿ
aijk xi x j xk ` . . .
(1)
j “1 j “1 k “1
Equation (1) can be expressed mathematically using a partial quadratic polynomial involving two decision variables (xi ,x j ) as shown in Equation (2). yˆ “ a0 ` a1 xi ` a2 x j ` a3 xi x j ` a4 xi2 ` a5 x2j
(2)
Equation (2) was used to repeatedly build the general mathematical relationship between the inputs (decision variables) and the outputs (brake mean effective pressure and hydrocarbon emissions) in a network of connected neurons in Equation (1). The coefficients {a0 , . . . , a5 } in Equation (2) were determined via regression techniques so that the error between the actual output y and the estimated output for each input pair xi and x j is minimized. For the GMDH trained neural network, the coefficients of Equation (2) were determined such that error, E, between the actual outputs and the estimated was given by Equation (3). E“
N 1 ÿ pyi ˘ yˆi q2 Ñ min N
(3)
i “1
For a GMDH neural network, a model can be represented by a set of neurons by having different pairs of neurons in each layer connected via a quadratic polynomial for the production of new neurons in the next layer [30]. This could be used in the modeling process to map inputs to outputs. Furthermore, in a GMDH algorithm, it is important to collect data about all the probable combinations of two decision variables (independent variables) for the construction of the regression polynomial Equation (2). For the purpose of this study, the Latin Hypercube Sampling [31–34] method was used to decide on the probable combinations of the decision variables (intake manifold length and fuel-air ratio). A total of 2000 possible combinations of the independent variables were used to generate outputs over the operating range (400–6000 rpm) of the GT-Power™ engine model. The total number of that could be contained in the first layer of the feedforward neural network is given by ˜ neurons ¸ n “ npn ´ 1q{2 using collected data in the form {(xki ,xkj ,yk )|k = 1,2, . . . ,N} involving the various 2 values for which, i, j P {1,2, . . . ,n}. With the collected data, it was possible to form N (2000 for this study) data triples as indicated in Equation (4). Furthermore, in this study, the independent variables
Sustainability 2016, 8, 72
5 of 15
xki and xkj represented intake manifold length and fuel-air ratio, respectively. The dependent variables yk considered for the engine models were brake mean effective pressure and hydrocarbon emissions. » — — D“— — –
x1i x2i .. . x Ni
x1j x2j .. . x Nj
y1 y2 .. . yN
fi ffi ffi ffi ffi fl
(4)
It was also imperative to form the N by 6 matrix based on Equation (2) as follows: »
1
x1i
x1j
x1i x1j
2 x1i
2 x1j
— — A“— — –
1 .. . 1
x2i .. . x Ni
x2j .. . x Nj
x2i x2j .. . x Ni x Nj
2 x2i .. . x2Ni
2 x2j .. . x2Nj
fi ffi ffi ffi ffi fl
(5)
The matrix equation based on Equations (2) and (5) could also be represented in Equation (6) as follows: Aa “ Y (6) where a = {a0 , a1 , a2 , a3 , a4 , a5 } is the vector of the coefficients to be determined for the partial quadratic polynomial and Y = {y1 , y2 , . . . , y N }T . Solving Equation (6) for a leads to the least squares estimation in the form of Equation (7). ´1
a “ pA T Aq
AT Y
(7)
The use of such an Equation (7) for determining the vector of coefficients for the N data triples is done recursively for each neuron in the hidden layers of the neural network. The downside of using these coefficients directly as obtained from Equation (7) is that it is prone to round-off errors, as well as the existence of singularities. 2.3. The Use of Singular Value Decomposition (SVD) for the Optimal Determination of Coefficients For linear least squares problems having some singularities in normal equations, the SVD method is normally used for obtaining the optimal coefficients. The singular value decomposition of the matrix A P