Jul 15, 2016 - Within the selected experimental design limits, the obtained ... roughness, Central Composite Design of Experiment, Response Surface ...
The International Journal Of Engineering And Science (IJES) || Volume || 5 || Issue || 7 || Pages || PP -34-44 || 2016 || ISSN (e): 2319 – 1813 ISSN (p): 2319 – 1805
Modeling and Optimization of Surface roughness and Machining Induced Vibration in 41cr4 Alloy Structural Steel Turning Operation Using Design of Experiment Christopher Okechukwu Izelu1, Samuel Chike Eze2, Olusegun David Samuel1 1
Department of Mechanical Engineering, Federal University of Petroleum Resources, Effurun, Nigeria 2 Samez Engineering and Consultancy Services Limited, Kaduna, Nigeria
-------------------------------------------------------- ABSTRACT----------------------------------------------------------This paper presents the machining induced vibration and surface roughness modeled, predicted and optimized as functions of the cutting tool overhang, feed rate and cutting speed during hard and high speed turning of 41Cr4 alloy structural steel on an engine lathe machine with a carbide tool. The response surface methodology, based on central composite design of experiment was adopted, and analysis facilitated by using the Design Expert 9 software to generate and validate the models, predict the effect of the process variables on the response variables as well as obtain the optimum setting of the process variables that would minimize the response variables. Quadratic regression models were suggested as best fit for the measured machining induced vibration and surface roughness data. All the model terms of the machining induced vibration are significant with exception of the square term of the tool overhang. Whereas, all those of the surface roughness are significant with exception of the linear term of the tool overhang. The optimum setting of the cutting tool overhang at 57.8784 mm, feed rate at 0.15 mm/rev and the cutting speed at 328.507 rev/min minimized the machining induced vibration to a value of 0.18 mm/s 2, and the surface roughness to a value of 4.399 µmm with desirability of 0.822. Within the selected experimental design limits, the obtained response surface models can be used to accurately predict and optimize the machining induced vibration and surface roughness as functions of the tool overhang, feed rate and cutting speed during hard turning of 41Cr4 alloy structural steel. Keyword: Cutting Speed, Depth of Cut, cutting Tool Overhang, Machining Induced Vibration, Surface roughness, Central Composite Design of Experiment, Response Surface methodology ----------------------------------------------------------------------------------------------------------------------------- -------Date of Submission: 17 May 2016 Date of Accepted: 15 July 2016 ----------------------------------------------------------------------------------------------------------------------------- ----------
I.
INTRODUCTION
High-speed machining has attracted the attention of stakeholders in manufacturing industry. This has been attributed to its enhanced production rate as well as desired product quality. However, surface roughness of work-piece and tool vibration isadversely affected by higher and arbitrarily selected values of cutting variables. Besides,the component precision and tool life are hampered by tool vibration (Bhogal et al., 2015). The application of empirical equation has been suggested by several researchers (Suresh et al., 2002; Kumar and Thirumurugan, 2012; Routara et al., 2009; Rahim et al., 2009; Ding et al., 2010). Use of modern techniques has also be suggested (Aggawal and Singh, 2005; Kumar and Uppai, 2013). Further survey of literatures shows that machining parameters like feed rate, cutting speed, and depth of cut influence both work-piece surface roughness and tool vibration. The researches were mainly targeted on investigating the cutting force, tool wear, power consumption, and surface roughness of the machining process.These works, which also support this work to a large extent, include the works of Ozcakar and Kasapoglu, 2009;, Abhang and Hameedullah, 2010;Sahoo, 2011;Abhang and Hameedullah, 2011;Sastry and Devi, 2011; Srinivasan et al, 2012;Ramudu and Sastry, 2012;Aruna and Dhanalaksmi, 2012;Chomsamutr and Jongprasithporn, 2012;Abhang and Hameedullah, 2012; Manu et al, 2013;Makadia and Nanavati, 2013; Kannan et al, 2013;Phate and Tatwawadi,2013;Bhuiyan and Ahmed, 2013; Manohar et al, 2013;Thiyagu et al, 2014; Saini and Parkash, 2014;Saini et al, 2014;Soni et al, 2014;Shunmugesh et al, 2014; Kumar, 2014;Sastry et al, 2015;Revankar et al, 2015; Mahajan et al, 2015;Shihab et al, 2015; Gupta and Kohli, 2015; Khan et al, 2015;Devkumar et al, 2015; Devi et al, 2015;Rajpoot et al, 2012;Khidhir et al, 2013; Agrawal et al, 2013;Ranganath et al, 2014; and Chandra and Prasad, 2014. Few other studies have been reported to have been conducted to minimize the tool vibration during turning operation. These include the works of Kassab and Khoshnaw, 2007; Han et al, 2009;Cahuc et al, 2010;Delijaicov et al, 2010;,Rogov and siamak, 2013 and 2014. Whereas no study is published on the application of design of experiment to investigate the surface roughness and machining induced vibration in 41Cr4 alloy structural steel
www.theijes.com
The IJES
Page 34
Modeling And Optimization Of Surface Roughness And Machining Induced Vibration In 41cr4… during turning operation except in a series turning experiment of which this is an aspect. Owing to great application of the structural steel, the study was aimed to find out the best combination of machining parameters in high-speed turning of 41Cr4 alloy structural steelto achieve minimum machining induced vibration and surface roughness. For this purpose, mathematical models have been developed for the machining induced vibrations ( V i ) and surface roughness ( R a ) as functions of the cutting tool overhang (A), feed rate (B) and cutting speed (C).Using the experimental data,the developed models are tested for adequacy, and finally, the optimum setting of the machining variables that would minimize the response variable are determined.
II.
MATERIALS AND METHODS
2.1 Materials and machine The YUCY 6240B Engine lathe machinewas employed for this research work in conjunction withtype F30 carbide cutting tool. The overall dimensions of the tool insert are 25 mm x 25 mm x 12.5 mm. Its back rake angle is 10o, side rake angle is 12o, side relief angle is 5o and side cutting edge angle is 15o. The work piece used was 41Cr4 alloy special steel as revealed by the chemical analysis and mechanical test of the work-piece material.The chemical composition and mechanical properties of 41Cr4 alloy special steel (Plate 1)was performed at Standards Organization of Nigeria, Emene, Enugu. The results are presented in Tables 1 and 2, respectively.
Plate 1: 41Cr4 Alloy Steel Bars Table 1: Chemical Composition of 41Cr4 Alloy Special Steel Quality of Type of Average elements % material material Carbon Silicon Manganese Chromium (C) (Si) (Mn) (Cr) Quenched and 41Cr4 0.40 0.25 0.65 1.00 Tempered Steel Table 2: Mechanical Properties of 41Cr4 Alloy Special Steel Sample ID Diameter Area BHN Peak load Uts (mm) (mm2) (kN) N/mm2 Solid, Round 10.00 78.55 278.48 70.92 902.83 2.2 Experimental Procedure The turning operation is conducted on a YUCY 6240B engine lathe at the Nigerian Defence Academy, Kaduna with a set up given in Plate 2. Themachining induced vibration ( V i ),measured acceleration amplitude,was determined using avibration transducer suchas given in Plate 3, while that of surface roughness ( R a ) was measured with a surface roughness tester such as given in Plate 4. The experimental was replicated, and the average results evaluated.
Plate 2: Setup for the Turning Experiment
www.theijes.com
The IJES
Page 35
Modeling And Optimization Of Surface Roughness And Machining Induced Vibration In 41cr4…
Plate 3: Vibration Meter with Transducer, 908 BE
Plate 4: Surface Roughness Tester, ISR-16 2.3 Experimental design A response surface methodology, based on central composite experimental design was selected. Also selected are three independent variables as well astwo response variables. The influence of the independent variables, A, (work-piece overhang, mm), B (feed rate, mm/rev) and C (depth of cut, mm) on the response variables, R a (surface roughness, µmm) and V i (machining induced vibration, mm/s2) is investigated in the turning experiment. The selected levels of the independent variables are given in Table 3. A total of 27 runs of the experiment were conducted separately for determining the surface roughness ( R a ) and machining induced vibration ( V i ). Table 3: Levels of the Independent Variables Variables Levels Lower Upper Tool Overhang (mm) (A ) 50 60 Feed rate(mm/rev) (B ) 0.15 0.30 Cutting speed (rev/min)(C ) 260 400 2.4 Statistical analysis The Design Expert 9.0.6.2 software was employed for analysis of the generated data. The surface roughness ( R a )and machining induced vibration ( V i ) were taken as the responses in the turning experiment defined as functions of the independent variables taken as cutting tool overhang (A), feed rate (B) and Cutting speed (C). The general form of the required regression modelsresulting as best fits for the experimental data is polynomial equation given as: k
Y
( predict
)
k
ix i i x i o i 1
i 1
k 2
i 1
k
i j xi x
j
e
(1)
j 1
Note that Y denotes the response variables; 0 , i , ii and ij are coefficients of the constant, linear, quadratic and cross product terms of the regression equation, respectively; x i and x j denotes the independent variables, k is the number of factors studied and optimized in the experiment.
www.theijes.com
The IJES
Page 36
Modeling And Optimization Of Surface Roughness And Machining Induced Vibration In 41cr4… III.
RESULT AND DISCUSSION
In the current study, optimization of hard turning operation on 41Cr4 alloy structural steel was carried out using the response surface methodology. An experimental plan with threefactorsof three levels each was chosen(Table 3). Table 4 depicts the design layout for the turning experiment in terms of actual values the independent variables, and observed responses. This includes all of the 27 runs of the experiment conducted. Analysis and optimization based on this result was achieved using Design expert 9.0.6.2 software and the outcome documented as follows:. 3.1 RegressionModels The quadratic regression models were suggested for both the machining induced vibration ( V i ) and surface roughness ( R a ) data. For the machining induced vibration ( V i )data, V i is given as a function of the coded and actual factors, A, B and C in the form of Eqns. (2) and (3), respectively. V i 0 . 18 0 . 016 A 0 . 017 B 0 . 021 C 0 . 024 AB 0 . 029 AC 0 . 028 BC 0 . 005 A 0 . 015 B 2
2
0 . 011 C
(2)
2
V i 0 . 58467 0 . 038222 A 0 . 79312 B 0 . 00895 C 0 .. 064444 AB 0 . 000083 AC 0 . 005397 BC 0 . 0002 A 2 . 66667 B 0 . 0000228 2
2
C
(3)
2
Whereas, for the surface roughness ( R a ) data, R a is given as a function of the coded and actual factors of A, B and C in the form of Eqns. (4) and (5), respectively. R a 10 . 33 0 . 002389 A 1 . 8 B 1 . 87 C 0 . 61 AB 1 . 41 AC 0 . 72 BC 1 . 36 A
2
4 . 27 B
2
2 . 77 C
(4)
2
R a 304 . 19381 7 . 65441 A 231 . 14386 B 0 . 65258 C 1 . 61667 AB 0 . 00402548 0 . 13762 BC 0 . 054207
Standard
1 2 3 4 5 6 7 8 9 10 11 12 13 14 15 16 17 18 19 20 21 22 23
Run
26 22 8 5 7 2 23 25 17 3 12 16 13 10 18 19 14 1 4 15 24 6 27
www.theijes.com
A
2
758 . 84444 B
2
0 . 000565884
C
0.15 0.15 0.15 0.225 0.225 0.225 0.3 0.3 0.3 0.15 0.15 0.15 0.225 0.225 0.225 0.3 0.3 0.3 0.15 0.15 0.15 0.225 0.225
260 260 260 260 260 260 260 260 260 330 330 330 330 330 330 330 330 330 400 400 400 400 400
The IJES
0.21 0.24 0.25 0.23 0.28 0.32 0.20 0.28 0.32 0.20 0.19 0.19 0.15 0.16 0.21 0.09 0.14 0.18 0.37 0.35 0.29 0.33 0.31
(5)
2
Table 4: Response for the turning operation of 41 Cr4 alloy steel bars A B C Vi Tool Feed Rate Cutting Speed Acceleration Overhang [mm per rev] [rev per min] Amplitude [mm] [mm per min square] 50 55 60 50 55 60 50 55 60 50 55 60 50 55 60 50 55 60 50 55 60 50 55
AC
Ra
Surface Roughness [micro mm] 12.857 9.000 8.780 18.010 15.860 15.350 14.193 11.125 12.080 6.790 4.403 5.430 11.000 9.830 11.180 8.319 8.170 10.335 4.839 4.088 6.905 11.570 11.345
Page 37
Modeling And Optimization Of Surface Roughness And Machining Induced Vibration In 41cr4… 24 25 26 27
21 20 9 11
60 50 55 60
0.225 0.3 0.3 0.3
400 400 400 400
0.28 0.24 0.26 0.27
13.560 8.560 10.142 12.561
3.2 Evaluation of the models Presented in Tables5 is the precision index values of the different models derived from the model statistics, and analysis of variance (ANOVA) employed to validate the stability of the models for the various responses.As demonstrated in Table 5, there are indications that the observed quadratic regression modelsare significant since p values are less than 0.0001, and the adjusted and predicted of R2 are more than 90%. The regression statistics 2
of fits ( R ),that is, goodness of fit for V i (0.9735),and that of R a (0.9842), are very close to unity. There are also indications that over 97.35% and 98.42% of the data are adequately captured for V i and R a , respectively.Besides, the predicted R-square of 0.9317 for V i and 0.9637 for R a are in reasonable agreement with the adjusted R-square of 0.9595 for V i and 0.9758 for R a , since the difference of 0.0278 for V i
and
0.0121 for R a are less than 0.2. The adequacy precision of 32.219 for V i and 40.123 for R a , greater than 4, are desirable signal to noise ratios. These indicate that there are adequate signals, and that these models can be used to navigate the design space.The predicted values indicated fits the data appropriately. Table 5: Precision Index Values of the Different Models Model Vi Ra Mean Standard Deviation C. V. (%) PRESS Model degree R2 Adjusted R2 Predicted R2 Adequacy Precision
0.24 0.014 5.74 0.008471 Quadratic 0.9735 0.9595 0.9317 32.219
10.23 0.55 5.39 11.89 Quadratic 0.9842 0.9758 0.9637 40.123
Table 6: ANOVA for Response Surface Quadratic Model for Acceleration Amplitude ( V i ) Sum of Degree of Mean F p-value Source Squares Freedom Square Value Prob > F Model 0.12 9 0.013 69.49 < 0.0001 significant A-Tool Overhang 4.672E-003 1 4.672E-003 24.19 0.0001 B-Feed Rate 5.339E-003 1 5.339E-003 27.64 < 0.0001 C-Cutting Speed 7.606E-003 1 7.606E-003 39.38 < 0.0001 AB 7.008E-003 1 7.008E-003 36.29 < 0.0001 AC 0.010 1 0.010 52.86 < 0.0001 BC 9.633E-003 1 9.633E-003 49.88 < 0.0001 A^2 1.500E-004 1 1.500E-004 0.78 0.3905 B^2 1.350E-003 1 1.350E-003 6.99 0.0171 C^2 0.075 1 0.075 387.38 < 0.0001 Residual 3.283E-003 17 1.931E-004 Cor Total 0.12 26 Analysis of variance of Table 6 shows that all the model terms have significant influence on V i with exception of the square of the cutting tool overhang (A). For the linear terms, the C has dominant influence on V i followed by B and then A. For the square terms, C2 has much more dominant influence on V i followed by B2, and then, A2. Whereas, for the cross product terms, AC has dominant influence on V i followed by BC, and then, AB. Analysis of variance of Table 7 reveals that all the model terms have significant influence on R a with
www.theijes.com
The IJES
Page 38
Modeling And Optimization Of Surface Roughness And Machining Induced Vibration In 41cr4… exception of the linear form of cutting tool overhang (A). For the linear terms, C has a dominant influence on R a , followed by B, and then, A. For the square terms, B 2 has a dominant influence on R a , followed by C2, and then, A2. For the cross product terms, AC has dominant influence on R a , followed by BC, and Then, AB. Table 7: ANOVA for Response Surface Quadratic Model for Surface Roughness ( R a ) Sum of Degree of Mean F p-value Source Squares Freedom Square Value Prob> F Model 322.30 9 35.81 117.61 < 0.0001 significant A-Tool Overhang 1.027E-004 1 1.027E-004 3.374E-004 0.9856 B-Feed Rate 58.29 1 58.29 191.45 < 0.0001 C-Cutting Speed 63.04 1 63.04 207.03 < 0.0001 AB 4.41 1 4.41 14.49 0.0014 AC 23.82 1 23.82 78.23 < 0.0001 BC 6.26 1 6.26 20.57 0.0003 A^2 11.02 1 11.02 36.19 < 0.0001 B^2 109.32 1 109.32 359.04 < 0.0001 C^2 46.13 1 46.13 151.51 < 0.0001 Residual 5.18 17 0.30 Cor Total 327.48 26 3.3 Machining Induced Vibration Model The plot of the predicted versus actual V i , given in Fig. 1, depicts that the predicted datais quite close to the experimental data, thereby validating the reliability of the model developed for the correlation between the turning variables, A, B, and C,and the machining induced vibration, V i .The plot of perturbation,also given in Fig. 1,shows the effect of A, B and Con V i . It shows that V i increased with increase in A, but decreased with increase in B. It also shows that V i decreased with increase in C,and later, increased. The contour and response surface plots of Fig. 2 show the impacts of A and B on V i . They show that increasing A would lead to increasein V i . Whereas, as B increases, V i decreases. The contour and surface plots of Fig. 3 show the interaction between A and Con V i . It can be seen from the plots that
Vi
steadily increased as A increases, but decreased as C
Design-Expert® Software Acceleration Amplitude
Design-Expert® Software
Predicted vs. ActualFactor Coding: Actual
Acceleration Amplitude (mm per min square)
Color points by value of Acceleration Amplitude: 0.37
0.40
Actual Factors A: Tool Overhang = 55 B: Feed Rate = 0.225 C: Cutting Speed = 330
0.09
P r e d ic t e d
0.30
0.20
0.10
A c c e le r a t io n A m p lit u d e ( m m p e r m in s q u a r e )
increases, and later increased. Similar trend was observed in Fig. 4 about the interaction of B and C on V i .
0.00
Perturbation 0.40
C 0.30
C
0.20
A
B A
B
0.10
0.00
0.00
0.10
0.20
0.30
0.40
-1.000
Actual
-0.500
0.000
0.500
1.000
Deviation from Reference Point (Coded Units)
Figure1.Predicted vs Actual, and Perturbation plots for V i
www.theijes.com
The IJES
Page 39
0.09
X1 = A: Tool Overhang X2 = B: Feed Rate Actual Factor C: Cutting Speed = 330
Design-Expert® Software Acceleration Amplitude (mm per min Factorsquare) Coding: Actual
0.3
B : F e e d R a te (m m p e r re v )
Design-Expert® Software Factor Coding: Actual Acceleration Amplitude (mm per min square) Design Points 0.37
Acceleration Amplitude (mm per min square) Design points above predicted value Design points below predicted value 0.37
0.12
0.14 0.27
0.09 0.16
X1 = A: Tool Overhang X2 = B: Feed Rate Actual Factor C: Cutting Speed = 330
0.24
0.18
0.21
0.18
0.18
A c c e le ra tio n A m p litu d e (m m p e r m in s q u a re )
Modeling And Optimization Of Surface Roughness And Machining Induced Vibration In 41cr4…
0.4
0.3
0.2
0.1
0
0.3
60 0.27
58 0.24
0.15 50
52
54
56
58
56 0.21
60
54
B: Feed Rate (mm per rev)
0.18
A: Tool Overhang (mm)
52 0.15
50
A: Tool Overhang (mm)
C : C u t t in g S p e e d ( r e v p e r m in )
Design-Expert® Software Factor Coding: Actual Acceleration Amplitude (mm per min square) Design Points 0.37 0.09
X1 = A: Tool Overhang X2 = C: Cutting Speed Actual Factor B: Feed Rate = 0.225
Design-Expert® Software Acceleration Amplitude (mm per min Factorsquare) Coding: Actual
400
Acceleration Amplitude (mm per min square) Design points above predicted value Design points below predicted value 0.37
0.3
0.25
380
0.09 X1 = A: Tool Overhang X2 = C: Cutting Speed
360
0.2
Actual Factor B: Feed Rate = 0.225
340
320
300
0.2
280
0.25
A c c e le ra tio n A m p litu d e (m m p e r m in s q u a re )
Figure 2 Contour and Response Surface plots of V i against A and B with C set at 330 rev per min
0.4
0.3
0.2
0.1
0
400
60 380
58
360
0.3 260
56
340 50
52
54
56
58
320
60
54 300
C: Cutting Speed (rev per min)
A: Tool Overhang (mm)
52
280 260
50
A: Tool Overhang (mm)
0.09
X1 = B: Feed Rate X2 = C: Cutting Speed Actual Factor A: Tool Overhang = 55
Design-Expert® Software Acceleration Amplitude (mm per min square) Factor Coding: Actual
400
0.25
Acceleration Amplitude (mm per min square) Design points above predicted value Design points below predicted value 0.37
0.2
X1 = B: Feed Rate X2 = C: Cutting Speed
0.3
380
0.09 360
Actual Factor A: Tool Overhang = 55
340
320
300
0.2
280
A c c e le ra tio n A m p litu d e (m m p e r m in s q u a re )
Design-Expert® Software Factor Coding: Actual Acceleration Amplitude (mm per min square) Design Points 0.37
C : C u t t in g S p e e d ( r e v p e r m in )
Figure 3 Contour and Response Surface Plots of V i against A and C with B set at 0.225 mm/rev
0.4
0.3
0.2
0.1
0
400
0.25
0.3 380
0.27
360 260
0.24
340 0.15
0.18
0.21
0.24
0.27
320
0.3
C: Cutting Speed (rev per min)
0.21 300
0.18
280 260
B: Feed Rate (mm per rev)
0.15
B: Feed Rate (mm per rev)
Figure 4 Contour and Response Surface Plots of V i against B and C with A set at 55 mm 3.4 Surface roughness model Figure 5 depicts that the predictedand actual surface roughness datafits well with each other as the correlation is very close, thereby, validating surface roughness model. It shows, in a perturbation plot the effect A, B, and C have onthe surface roughness ( R a ). It shows that R a decreases with increase in A and C, and later slightly increased. Besides, R a increased with increase in B, and later, decreased.Figure. 6 shows the interactive effect of A and B over R a in contour and response surface plots. The plots reveal that R a increased asA and B increased, but decreased later as B increased. The interaction of A and C on R a is depicted in Fig. 7. As shown in the plots, R a decreased as Aincreases. On the same plots, increasing in C lead to increase in R a .The effect of B and C on R a is depicted in Fig. 8. The surface roughness ( R a ) was at the peak at feed rate of 0.225 mm/rev and cutting
speed of 330 rev/min.
www.theijes.com
The IJES
Page 40
Design-Expert® Software Surface Roughness
S u r f a c e R o u g h n e s s ( m ic r o m m )
Modeling And Optimization Of Surface Roughness And Machining Induced Vibration In 41cr4… Design-Expert® Software
Predicted vs. ActualFactor Coding: Actual
Surface Roughness (micro mm) Color points by value of Surface Roughness: 18.010
20.000
Actual Factors A: Tool Overhang = 55 B: Feed Rate = 0.225 C: Cutting Speed = 330
18.000
4.088
P r e d ic t e d
16.000
14.000
12.000
10.000
8.000
Perturbation 20.000
18.000
16.000
C 14.000
A C
A
12.000
10.000
B
8.000
6.000
6.000
B 4.000
4.000
4.000
6.000
8.000
10.000
12.000
14.000
16.000
18.000
20.000
-1.000
-0.500
Actual
0.000
0.500
1.000
Deviation from Reference Point (Coded Units)
Figure 5 Predicted vs Actual, and Perturbation Plotsfor R a
Actual Factor C: Cutting Speed = 330
Surface Roughness (micro mm) Design points above predicted value Design points below predicted value 18.01
0.27
4.088
10
X1 = A: Tool Overhang X2 = B: Feed Rate Actual Factor C: Cutting Speed = 330
0.24
10 0.21
8 0.18
S u rfa c e R o u g h n e s s (m ic ro m m )
4.088
X1 = A: Tool Overhang X2 = B: Feed Rate
Design-Expert® Software Surface Roughness (micro mm) Factor Coding: Actual
0.3
B : F e e d R a te (m m p e r re v )
Design-Expert® Software Factor Coding: Actual Surface Roughness (micro mm) Design Points 18.01
20 18 16 14 12 10 8 6 4
60 0.3
6
58 0.27 56
0.15
0.24 50
52
54
56
58
60
54
0.21
B: Feed Rate (mm per rev)
A: Tool Overhang (mm)
52
0.18 0.15
A: Tool Overhang (mm)
50
Figure 6 Contour and Response Surface Plots of R a against A and B with C set at 330 rev per min
4.088
X1 = A: Tool Overhang X2 = C: Cutting Speed Actual Factor B: Feed Rate = 0.225
Design-Expert® Software Surface Roughness (micro mm) Factor Coding: Actual
400
Surface Roughness (micro mm) Design points above predicted value Design points below predicted value 12 18.01
380
4.088 X1 = A: Tool Overhang X2 = C: Cutting Speed
360
10
Actual Factor B: Feed Rate = 0.225
340
320
300
12
S u rfa c e R o u g h n e s s (m ic ro m m )
C : C u t t in g S p e e d ( r e v p e r m i n )
Design-Expert® Software Factor Coding: Actual Surface Roughness (micro mm) Design Points 18.01
20 18 16 14 12 10 8 6 4
60
280
400
14
58
380
16
360 260
56 340
50
52
54
56
58
60
54
320 300
C: Cutting Speed (rev per min)
A: Tool Overhang (mm)
52 280 260
A: Tool Overhang (mm)
50
4.088
X1 = B: Feed Rate X2 = C: Cutting Speed Actual Factor A: Tool Overhang = 55
Design-Expert® Software Surface Roughness (micro mm)
Factor Coding: Actual Surface Roughness (micro mm) Design points above predicted value Design points below predicted value 18.01
400
380
4.088
4 360
X1 = B: Feed Rate X2 = C: Cutting Speed 8
6
Actual Factor 10 A: Tool Overhang = 55
340
8 10 320
300
12
Warning! Surface truncated by selected response (Y) range S u rfa c e R o u g h n e s s (m ic ro m m )
Design-Expert® Software Factor Coding: Actual Surface Roughness (micro mm) Design Points 18.01
C : C u t t in g S p e e d ( r e v p e r m in )
Figure 7 Contour and Response Surface Plots of R a against A and C with B set at 0.225 mm/rev
20 18 16 14 12 10 8 6 4
280
0.3 400
14
0.27
380 360
260
0.24 340
0.15
0.18
0.21
0.24
0.27
0.3
0.21
320 300
C: Cutting Speed (rev per min)
B: Feed Rate (mm per rev)
0.18
B: Feed Rate (mm per rev)
280 260
0.15
Figure 8 Contour and Response Surface Plots of R a against B and C with A set at 55 mm
www.theijes.com
The IJES
Page 41
Modeling And Optimization Of Surface Roughness And Machining Induced Vibration In 41cr4… 3.5 Parameter optimization The optimal turning conditions were calculated by solving the regression model (eqn. 1) according to the limit criterion of minimizing acceleration amplitude ( V i ) and surface roughness ( R a ). The outcomeis as depicted in Fig.9. Thus, the tool overhang of 57.87 mm; the feed rate of 0.15 mm/rev; and the cutting speed of 328.507 rev/mm, which resulted into minimalacceleration amplitude of 0.18 mm/s2 and surface roughness of 4.399 µmm.
50
60
0.15
0.3
A:Tool Overhang = 57.8784
260
B:Feed Rate = 0.15
400
0.09
C:Cutting Speed = 328.507
0.37 Acceleration Amplitude = 0.18
Desirability = 0.822
4.088
18.010 Surface Roughness = 4.399
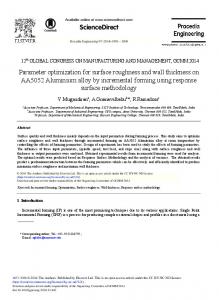
Figure 8: The optimal conditions with minimal surface roughness and acceleration amplitude 3.6 Surface Roughness versusMachining Induced Vibration If excessive, the machining induced vibration ( V i ) should have influence on surface roughness ( R a ) as it impacts negatively on the cutting zone in a turning operations. However, the plot of R a versus V i given in Fig 14, shows a nonlinear relationship, but no significant correlationbetween these process characteristics within the experimental design limits. This can be seen from the R-square value of the trend line of 0.1122, but there may be correlation outside these limits.
Figure 14: A plot of R a against V i
IV.
CONCLUSION
By using design of experiment, like the response surface methodology, an empirical relationship was developed to predict and optimize machining induced vibration and surface roughness defined as functions of the cutting tool overhang, feed rate and cutting speed during hard turning of 41Cr4 alloy structural steel. The results revealed the developed mathematical modelsto be accurate, effective and reliable, and therefore, can be employed in the prediction and optimization of the induced machining vibration and surface roughness, but within limits of the selected machining variables. It also indicated that design of experiment is an appropriate tool for this purpose.
www.theijes.com
The IJES
Page 42
Modeling And Optimization Of Surface Roughness And Machining Induced Vibration In 41cr4… REFERENCES [1]. [2]. [3]. [4]. [5].
[6]. [7]. [8]. [9]. [10]. [11].
[12]. [13]. [14].
[15].
[16]. [17]. [18]. [19]. [20]. [21]. [22]. [23]. [24].
[25]. [26].
[27].
[28]. [29]. [30].
[31].
[32].
Abhang, L. B. and Hameedullah, M., 2013, Optimal Machining Parameters for Achieving the Desired Surface Roughness in Turning of Steel, Technical Journal of Engineering Research (TJER), Vol. 9, No. 1,pp 37 – 45 Abhang, L. B. and Hameedullah, M., 2011, Optimization of Power Consumption by Desirability Function Approach, International journal on Resent Trends in Engineering and Technology. Vol. 6, No. 2,pp 287 – 290 Abhang, L. B. and Hameedullah, M., 2010, Power Prediction Model for Turning EN-31 Steel Using Response Surface Methodology, Journal of Engineering Science and Technology Review, Vol. 3, No. 1,pp 116 – 122 Aggarwal, A. and Singh, H., 2005, Optimization of Machining Techniques – A retrospective and literature review, Sadhana, Vol. 30, Part 6,pp 699 – 711 Agrawal, S., Guar, M. K., Kasdekar, D. K., Agrawal, S. and Malvi, C. S., 2015, Optimal Machining Condition for Turning of Hard Porcelain using Response Surface Methodology, European Journal of Advances in Engineering and Technology, Vol. 2, No. 5,pp 44 – 51 Aruna, M. and Dhanalaksmi, V., 2012, Design Optimization of Cutting Parameters when Turning Inconel 718 with Cermet Inserts, International Journal of Mechanical and Aerospace Engineering, vol. 6,pp 187 – 190 Bhulyan, T. H. and Ahmed, I., Optimization of Cutting Parameters in Turning Process, Journal of Production Engineering, Vol. 16, No. 2 (2013) 11 – 19 Cahuc, O., K’nevez, J Y., Gerard, A., Darnis, P., Albert, G., Bisu, C. F., and Gerard, C., 2010, Self-Excited Vibrations in Turning: Cutting Moment Analysis, International Journal of Advanced manufacturing Technology, version 1 – 9,pp 1 – 9 Chandra, B. S. and Prasad, M. V. R. D., 2015, Parameter Optimization while Dry Turning AISI 1045 Steel using CBN Tool by Response Surface Methodology, GE International Journal of Engineering Research, Vol. 3, Issue 7,pp 69 – 82 Chomamutr, K. and Jongprasithporn, S., 2012, Optimization Parameters of Tool Life Model using the Taguchi Approach and Response Methodology, International Journal of Computer Science Issues, Vol. 9, Issue 1, No. 3,pp 120 – 125 Delijaicov, S., Leonardi, F., Bordinassi, E. C., and Batalha, G. F., 2010,Improved Model to predict Machined Surface Roughness based on the Cutting Vibrations signal during Hard Turning, Archives of Materials Science and Engineering, Vol. 45, Issue 2, pp 102 – 107 Devi, K. D., Babu, K. S. and Reddy, K. H., 2015, Mathematical Modeling and Optimization of Turning process Parameters using Response Surface Methodology, International Journal of Applied Science and Engineering, Vol. 13, No. 1, pp 55 – 68 Devkumar, V., Sreedhar, E. and Prabakaran, M. P., 2015, Optimization of Machining Parameters on AL 6061 Alloy using Response Surface methodology, International Journal of Applied Research, Vol. 1, No. 7, pp 01 – 04 Ding, T. Zhang,S. Wang,Y. and Zhu,X., 2010, Empirical models and optimal cutting parameters for cutting forces and surface roughness in hard milling of AISI H13 steel, The International Journal of Advanced Manufacturing Technology, vol. 51, no. 1–4, pp 45–55 Gupta, U. and Kohi, A., 2014, Experimental Investigation of Surface Roughness in Dry Turning of AISI 4340 Alloy Steel using PVD- and CVD-Coated Carbide Inserts, International Journal of Innovations in Engineering and Technology, Vol. 4, Issue 1,pp 94 – 103 Han, X., Wang, M. and Ouyang, H., 2009, Vibration of Work-Pieces during Turning Operations, Journal of Physics: Conference Series 181, http://iopscience.iop.org/1742-6596/181/1/012032pp 1 – 7 Kannan, A., Esakkiraja, K. and Mataraj, M., 2013, Modeling and Analysis for Cutting Temperature in Turning of Aluminum 6063 using Response Surface Methodology, Journal of Mechanical and Civil Engineering, Vol. 9, Issue 4,pp 59 – 64 Kassab, S. Y. and Khoshnaw, Y. K., 2007, The Effect of Cutting Tool Vibration on Surface Roughness of Work-piece in Dry Turning Operation, Engineering and technology, Vol. 25, No. 7,pp 879 – 889 Khan, M. A., Kittur, J. K. and Kohir, V. D., 2015, Study and Analysis of Effect of Cutting Parameters on Cutting Forces and Surface Roughness, Advanced Engineering and Applied Sciences,: An International Journal, vol. 5, No. 3 pp 63 – 73 Khidhir, B. A., A-Oqaiel, W. and Kareem, P. M., 2015, Prediction Models by Response Surface Methodology for Turning Operation, American Journal of Modeling and Optimization, Vol. 3, No. 1,pp 1 – 6 Kumar, J. P. and Thirumurugan, K. 2012, Optimization of machining parameters for milling titanium using Taguchi method, International Journal of Advanced Engineering Technology, vol. 3, no. 2, pp. 108–113 Kumar, M. S., 2014, A Detailed Comparison among Dry, Wet and Gas Cooled Machining of Super Duplex Stainless Steel, Global Journal of Researches in Engineering: A Mechanical and Mechanics Engineering, Vol. 14, Issue 7,pp 17 – 25 Kumar, N. and Uppal, N., 2013, A Review on Various Optimization Techniques used in Turning Operation for Improving Surface Roughness, Mechanica Confab, Vol. 2, No. 4,pp 45 -51 Mahajan, C. K., Mote, M. L., Patil, B. V. and Patil, H. G., 2013, Formulation and Simulation of a Field Data Based Model for the Turning process by using Response Surface Method, International Journal of Advanced Scientific and Technical Research, Vol. 2, Issue 3,pp 355 – 370 Makadia, A. J. and Nanavati, J. I., 2013, Optimization of Machining Parameters for Turning Operations Based on Response Surface Methodology, Measurement, Elsevier, Vol. 46,pp 1521 – 1529 Manohar, M., Joseph, J., Selvaraj, T. and Sivakumar, D., 2013, Application of Box Behnken Design to Optimize the Parameters for Turning Inconel 718 using Carbide Tools, International Journal of scientific and Engineering Research, Vol. 4, Issue 4,pp 620 – 642 Manu, R., Akbar, B. S., and Sharmas, V. S., 2013, Predictive Machinability Model of Hardened Steel Material in Turning Operation by Response Surface Regression Method, International Journal of Applications or Innovation in Engineering and Management, Vol. 2, Issue 10,pp 330 – 334 Ozcakar, N. and Kasapogu, O. A., 2009, Modeling of Surface Roughness in Machining, Yontim, Yil 20, Saya 64 (2009) 27 – 40 Phate, M. and Tatwawadi, V. H., Formulation of a Field Data Based Model for a surface Roughness using Response Surface Method, International Journal of Science, Engineering and Technology Research, Vol. 2, Issue 4,pp 793 – 798 Rahim,I. A., Miskam, M. A., Sidek,O., Zaharudin, S. A.and Mohd,S. K. K.,2009, Development of a vibration measuring unit using a microelectromechanical system accelerometer for machine condition monitoring. European Journal of Scientific Research, vol. 35, no. 1, pp 150–158 Rajpoot, B. S., Moond, D. R. and Shrivastava, S., 2015, Investigating the effect of Cutting Parameters on the Average Surface Roughness and materials Removal Rate during Turning of Metal Matrix Composite using Response Surface Methodology, International Journal on Recent and Innovation Trends in Computing and Communication, Vol. 3, Issue 1,pp 241 – 247 Ramudu, C. and Sastry, M. N., 2012, Analysis and Optimization of Turning Process Parameters using Design of Experiment, International journal of Engineering Research and Applications, Vol. 2, issue 6,pp 020 -027
www.theijes.com
The IJES
Page 43
Modeling And Optimization Of Surface Roughness And Machining Induced Vibration In 41cr4… [33].
[34].
[35].
[36]. [37].
[38]. [39].
[40].
[41]. [42]. [43]. [44].
[45]. [46]. [47]. [48]. [49].
Ranganath, M. S., Vipin, Kumar, N., and Kumar, R., 2015, Experimental Analysis of Surface Roughness in CNC Turning of Aluminum using Response Surface Methodology, International Journal of Advanced Research and Innovation, Vol. 3, Issue 1,pp 45 – 49 Revankar, G. D., Shetty, R., Rao, S. S., and Gaitonde, V. N., 2013, Response Surface Model for Surface Roughness during Finish Turning of Titanium Alloy under Minimum Quantity Lubrication, International Conference on Emerging Trends in Engineering and Technology, Dec. 7 – 8,pp 78 – 84 Rogov, V. A. and Siamak, G., 2013, Optimization of Surface Roughness and Vibration in Turning of Aluminum Alloy AA2024 Using Taguchi Technique, International Journal of Mechanical, Aerospace, Industrial, Mechatronic and Manufacturing Engineering Vol. 7, No. 11,pp 2330 – 2339 Rogov, V. A. and Siamak, G., 2014, The Effect of Tool Construction and Cutting Parameters on Surface Roughness and Vibration in Turning of AISI 1045 Steel Using Taguchi Method, Modern Mechanical Engineering, 4, pp 8 – 18 Routara, B. C. Bandyopadhyay, A.and Sahoo, P., 2009, Roughness modeling and optimization in CNC end milling using response surface method: effect of workpiece material variation, International Journal of Advanced Manufacturing Technology, vol. 40, no. 11-12, pp. 1166–1180 Sahoo, P., 2011, Optimization of Turning Parameters for Surface Roughness using RSM and GA, Advances in Production Engineering and Management, Vol. 6, No. 3,pp 197 – 208 Saini, P. and Parkash, S., 2014, A Multi Response Optimization of Machining Parameters for Surface Roughness and MRR in High Speed CNC Turning of EN-24 Alloy Steel using Response Surface Methodology, International Journal of Engineering Science and Research Technology, Vol. 3, Issue 9,pp 333 – 345 Saini, P., Parkash, S. and Choudhary, D., 2014, Experimental Investigation of Machining Parameters for Surface Roughness in High Speed CNC Turning of EN-24 Alloy Steel using Response Surface Methodology, International Journal of Engineering Research and Applications, Vol. 4, Issue 5,pp 153 – 160 Sastry, M. N. and Devi, K. D., 2011, Optimization of Performance Measures in CNC Turning using Design of experiment (RSM), Science Insight: An International Journal, Vol.1, No. 1 (2011) 1 – 5 Sastry, M. N., Devi, K. D. and Reddy, K. M., Analysis and Optimization of machining Parameters using Design of Experiments, Industrial Engineering Letters, Vol. 2, No. 9,pp 23 – 32 Shihab, S. K., Khan, Z. A., 2014, Mohammad, A. and Siddiquee, A. N., Optimization of Surface Integrity in Dry Hard Turning using RSM, Sadhand, Vol. 39, Part 5,pp 1035 – 1053 Shunmugesh, K., Panneerselvam, K. and Amal, G., 2014, Optimization of Turning Parameters with Carbide Tool for Surface Roughness Analysis using Response Surface Methodology, International journal of research in Aeronautical and Mechanical Engineering, Vol. 2, Issue 6,pp 17 – 27 Soni, V., Mondal, S. and Singh, B., 2014, Process Parameters Optimization in Turning of Aluminum using a New Hybrid Approach, International Journal of Innovative Science, Engineering, and Technology, Vol. 1, Issue 3,pp 418 – 423 Srinivasan, A., Arunachalam, R. M., Ramesh, S. and Senthilkumaar, J. S., 2012, Machining Performance Study on Metal matrix Composites – A Response Surface Methodology Approach, American Journal of Applied Science, Vol. 9, No. 4,pp 478 – 483 Sukhdev S. Bhogal, Charanjeet Sindhu, Sukhdeep S. Dhami, and B. S. Pabla, 2015, Minimization of Surface Roughness and Tool Vibration in CNC Milling Operation. Journal of Optimization Volume 2015, Article ID 192030, 13 pages. Suresh,P. V. S. Rao,P. V. and Deshmukh,S. G. 2002, A genetic algorithmic approach for optimization of surface roughness prediction model,” International Journal of Machine Tools and Manufacture, vol. 42, no. 6, pp. 675–680 Thiyagu, M., Karunamoorthy, L. and Arunkumar, N., 2014, Experimental Studies in machining Duplex Stainless Steel using Response Surface Methodology, International Journal of Mechanical Engineering, Vol. 14, No. 3,pp 48 – 61
www.theijes.com
The IJES
Page 44