Modeling and Simulation of Ecological Footprint of Macao Kampeng Lei 1, Shek Kiu Chan 2, Jing Cao 3, Shaoqi Zhou 1 1. College of Environmental Science and Engineering, South China University of Technology, China. 2. Center for Research in the Environmental Sciences, University of Saint Joseph., Macao, China. 3. College of Life Science, Sun Yat-sen University, Guangzhou 510275, China. Telephone: +853 66875146 Email:
[email protected] Abstract:In this paper, the ecological footprint of Macao from 2000 to 2020 is studied using Stella modeling and theories of system dynamics. From our modeling, the value of EF per capita of Macao increases from 3.3ha/capital in 2000 to 4.6ha/capital in 2020. It is the first time that such values are reported and they are valuable to policy makers in Macao. In details, the model consists of three modules—ecological footprint (EF), city and tourism modules. According to the simulation results, the EF per capita is increasing continuously. Population increases from 434, 070 in 2000 to 562,600 in 2020, and tourists increase from 2,175,800 in 2000 to 9,731,180 in 2020.It is shown that fossil energy land is the key factor influencing the EF of Macao and is affected mainly by city development. Besides, city development is limited by two factors, namely population and available land. The available land for business and housing is becoming scarce. On the contrary, energy price has limited affect on city development. Consequently, it also has limited effect on fossil energy land. Key Words: Macao; STELLA; ecological footprint; model 1.
Introduction
The theory of Ecological Footprint (Ecological Footprint, referred to as EF) was first used by Canadian ecological economist William Rees (William Rees, 1992), and his doctoral student Wackernagel proposed the ecological footprint concept (Wackernagel and Rees, 1996). EF gradually became a measure of the human consumption of natural resources and the life supporting capacity provided by nature. The so-called ecological footprint is the amount of biologically productive land and sea area required to regenerate the resources a human population consumes and to absorb the waste produced. Ecological footprint analysis involves both the demand side of the ecological footprint and the supply side of the ecological carrying capacity. Through the comparison of these two sides one may evaluate the sustainable development of a target. If the ecological carrying capacity is less than the ecological footprint, then ecological deficit appears, indicating a region is in a relatively non-sustainable state. If the ecological carrying capacity is greater than the ecological footprint, then ecological surplus appears, and the mode of development in that region is in a relatively sustainable state. Many nations have completed their footprint assessments even done them several times under different methods (Bagliani et al., 2005; Medved, 1
2006). Macao is an urban ecosystem, largely dependent on outside to provide material, energy and water resources to maintain its survival, and therefore, can not be independent and self-sustaining. In Macao, population, society, economy, information is highly dense, driving material, energy and information to a high-strength exchange and consuming much resource. At the same time, the above processes emit a lot of waste. After 2000, Macao’s population expansion and the high speed of economical development increased consumption of natural resources and Macao’s ecological environment was faced with huge pressure. Then, how is the sustainable condition of Macao? What will happen in the future? All these are important factors for Macao’s urban ecosystem appraisal, as well as for policy-makers, for making sustainable development plans. 2.
Modeling and simulation of ecological footprint of Macao
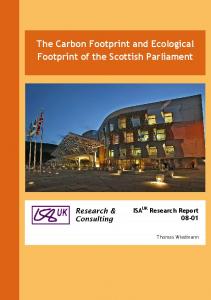
The modeling of Ecological footprint of Macao is composed of three modules which are ecological footprint module, the urban module and the tourist module. They become a triangle relation. First of all, urban module is employed to describe the urban development condition, analyze the energy demand of the urban and the population growth trend, then in turn reflecting the per capita ecological footprint of the ecological footprint module. The tourist module is used to describe the development of tourism and analysis of the interaction between tourism and urban development, thereby affecting the ecological footprint. Finally, the energy change in the ecological footprint module has an impact on urban development and tourism, so all these modules are inter-related and may influence each other. The variables and the relationship between them are described in the following paragraphs. 2.1 Ecological footprint module Through analyzing six kinds of ecologically productive land from 1977 to 2008 (selecting ten analysis points, one point for every three years) one finds that fossil energy land accounted for the largest proportion of the ecological footprint and is also the most important constituent, even though sometimes fluctuation exists. Ecological production land, besides construction land, is at steady state. To simplify the model, the mean value of crop land, grazing-land, forest and water are presented. They are 0.25ha/person, 0.12ha/person, 0.02ha/person and 0.09ha/person, respectively. The fossil energy land and construction land are the main factor affecting in ecological footprint, and are connected with urban development and tourism. Fossil energy consumption mainly reflects the value of fossil energy land. A number of studies have shown that if the price of a barrel of oil increases ten dollars, China’s GDP will drop 0.8 % (Jiang X.Q. et al., 2006). Although these studies are not perfect, their findings would be suitable for model construction. Moreover, the energy consumption is connected with urban development. The construction land accounts for only part of 2
the whole of Macao, and mainly is used for commercial and residential construction. So its change is less obvious not like the fossil energy land. Special note here is that fresh water footprint, according to its specificity, should be relegated to part of trade adjustment, and finally is integrated to fossil energy footprint. Water is scarce in Macao, and fresh water is imported from the mainland China. For the purpose of model simplification, the value of fresh water would be set to 0.064ha/person. Fig. 1 represents the frame of the model. Ecological Footprint Energy Supply
fraction of different qtr ~
Fossil Energy Land
quarter counter energy consumption
Population
actual supply rate
Quarterly supply
EF of energy stay days
lagged time effect of energy consumption of urban city
~
effect of building consumption on energy supply lagged time effect of energy price to supply rate
~
time effect
Pasture EF per person
effect of house consumption on energy supply
Builtup area The last DT value of average EF
land occupied by business
energy price ~
Cropland
Tourist
actual building construction rate actual housing construction rate
land occupied by houses
Tap water
effect of energy price on city Sea
Forest
Fig.1 Sub-module of ecological footprint
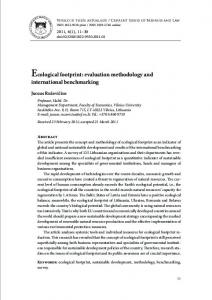
2.2 Urban module In the study of ecological footprint, the city is not only the producer of natural resources, but also the bearer of the environmental impact, an important part of the research and analysis of ecological footprint. Its three sub-modules: commerce, housing, population, are linked to multiple feedback loops in the simulation model. They represent the three aspects of dynamic development of a city. Fig. 2 represents the relationship between them.
3
Urban City normal business construction rate
Deaths land zoned for buildings
lagged time effect of land fraction on building construction
fraction of building land
actual immigration rate demolished rate
Population
?
~
effect of land fractiion on construction land occupied by business Business Buildings Building demolished
effect of energy price on city
Immigration
Emigration
lagged time effect of jobs occupancy
lagged time effect of emigration lagged time effect of housing for emigration birth rate
Building constructed Population
actual building units accommodated construction rate with per building ~
tourism effect on city development
fraction of labor of population
~
labor to jobs' ratio jobs accommodated with per unit effect of labor to job ratio on construction lagged time effect of attraction of jobs
Births
actual emigration rate ~
the maximum population lagged time effect of immigration
Houses
initial emigration rate
Housing construction
~
~ ~
effect of jobs occupancy
attraction from jobs
Housing debolished normal housing construction rate
lagged time effect of housing for emigration
attraction of housing initial immigration rate the ratio of population to units actual immigration rate units accommodated with per house
housing demolished rate
effect of population density
lagged time effect of labor to job on construction
actual growth ratetime effect of lagged attraction of housing
death rate
population to housing ratio
actual housing construction rate lagged time effect of land ~ fractionon housing construction effect of energy price on city land occupied by houses effect of housing for emigration land zoned for housing
~
effect of the ratio on housing construction
lagged time effect of pop to hou ratio fraction of house land
effect of land fraction on housing construction
~
Fig. 2 Urban sub-module 2.2.1 Business sub-module Business sub-module focuses on urban commercial construction. Urban development consists of two dynamic states: firstly, business can create more business; secondly new business development occupies new urban space. In 2000, one could assume that there were 1,200 commercial buildings, each building provided 15 sets of office units, and each office unit gave 20 jobs. The average rate of the completion of new buildings was 4%, and the average lifetime of a building was 70 years, and the building must be demolished when time was due. Supposing there were 100 hectares of land available for commercial construction in Macao, then each building should consume 0.035 hectare of land. 2.2.2 Housing sub-module The deduction behind the housing sub-module is comparable to that of business. First of all, the increase of housing will attract more people to move into Macao, and the population in turn will affect the increase and decrease of the demand of residential houses. Secondly, the available land is a restricting factor for house construction. In 2002, when the simulation began, there were 4,200 residential buildings in Macao, and each building provided 20 sets of housing units, and each housing unit could accommodate five people. An annual average growth rate of housing construction was 4%, and the average lifetime of a building was 70 years and the building must be demolished when time was due. The total land available for house construction was 3,000 hectares, and each building needed 0.025 hectares. 2.2.3 Population sub-module In this study, the population sub-module is only an integrated and simple model. According to the data from Macao Special Administrative Region Statistics and Census Service (2008), the birth rate was 0.2%, and mortality rate 0.075%, 4
immigration rate 0.1%, and emigration rate 0.4%. The starting value of simulation was 434,700 people from the year 2,000. 2.2.4 Mutual connection between three sub-modules In the model, the labor to job’s ratio is used to connect the commercial sub-module and population sub-module. As population increases, labor force also increases, leading to increase of the proportion of labor force to the job, making the city with less attraction. Comparing to job vacancies, the labor supply exceeds demand, so the actual immigration ratio will be correspondingly reduced and the potential population growth also slowed down. In the module, it is assumed that 60% of the population is in the paid labor force. Each commercial building can provide 15 office units, and each office providing 20 jobs. Fig. 3 presents a negative feedback loop between commercial sub-module and population sub-module.
Population +
Vacancies of work position
Immigration
+
+ Actual immigration ratio
+
Attraction of work position
Fig.3 Business system sub-module I Urban development is affected by living condition, making housing sub-module and population sub-module forming another feedback loop. If each suite can accommodate five people and when the housing has increased, the proportion of the population to housing will cause the effect of the ratio on housing construction to decrease. Since house construction reduces, it will reduce the annual number of new houses. As the completion rate of new houses decreases, it slows down the increase of houses. As a result, a negative feedback loop is formed. Fig. 4 presents a negative 5
feedback loop.
Housing +
+
Completion rate of new housing
+
Attraction of vacancy housing
Actual completion rate of new housing
-
Fig. 4 Business system sub-module II With the published data of Macao Special Administrative Region Statistics and Census Service, it is assumed that the ratio between the surface area for houses and commercial buildings is around 3:1. Hence the business sub-module and the housing sub-module are inter-connected. Although there is a conflict between the competition for land for business and housing, the government should have enough power to regulate urban development, particularly in field of urban planning. Therefore, this study can assume as follow: not only housing and commercial building are affected by demographic impact but also the land area used for construction. The Macao government will allocate the land area based on the proportion of housing to commercial building.
2.3 Tourism module Case study analyses have been completed on the footprint of tourism in various nations and regions (Hunter, 2002).In recent years, with the opening of new casinos, the entertainment industry is developing at an alarming pace. For example, the total number of tourists was 22,907,724 in 2008. The non-shopping spending per person was 1082 MOP in the fourth quarter of 2008, increasing slightly by 0.8% than that of 2007 under the global financial crisis. The gambling gross revenue (excluding gratuities) was MOP 109.83 billion in 2008. Apparently, Macao is becoming a tourist 6
city. There are too many factors affecting the behavior of tourists and insufficient information on tourism, especially detailed information of the gambling industry. Consequently, only tourism, business and hotel can information and can be inter-connected in the field of tourism industry. Fig. 5 presents the three parts’ inter-relationship. Tourism ~
lagged time effcet of tourism economy
quarter counter effect of quarter on tourist ~
attraction from hotel Supplied rooms destruction rate supplied rooms per hotel
fraction of stayed tourists the maximum tourists
actual growth rate effect of tourist density
Destrcution
effect of occupancy
~
normal growth rate
Hotel
~
lagged time effect of tourist density
Construction
Tourist
Business Buildings
lagged time effect of construction
Quarterly visit
~
Disturbance constructed rate
actual building construction rate
effect of hotel proportion
Fig. 5 Tourism sub-module
2.4 The linkages between the urban module, the ecological footprint module and the tourism module As a whole model, the operation between the modules is not independent. They are interrelated and complex, so it is necessary to briefly describe about the important link between the modules. Fig. 6 presents their inter-relationships. Fossil ener gy consum ption
Fossil energy price
+
+
Commerce
+
Fossil energy importion
+ +
Tourist 1
+
Forest ecological footprint per person
Fossil energy use land per person
-
+ +
+ + +
+
Population 1
Fresh water ecological footprint per person
+
+ Housing
+
+ Area of Macao
-
+
+
Crop land ecological footprint per person
Tourrist 2 + Consumption of biological resources
+ -
+
Immigration
Grazing land ecological footprint per person
+ +
Hotel
+
Ecological footprint per person
+
Average yield of global biological resources
+
Built-up land per person
+ Population 2
water ecological footprint per person
+
Fig. 6 Inter-relationships among the urban, ecological footprint and tourism sub-modules
2.4.1 The linkage between the urban module and the ecological footprint module First of all, the two modules are linked by population, affecting the ecological 7
footprint per person. Secondly, construction consumption- energy supply converter and residential housing consumption-energy supply converter are used to describe how the commercial development and housing development have an impact on energy use. This study assumes that both commercial construction rate and energy demand are positively proportional to each other. When commercial construction rate falls to 0.05, the city’s energy demand begins to decline. As long as commercial construction rate continues to decline, the city’s energy demand goes down until their converter’s value reaches zero. Finally, energy supply also affects city. In the model the impact of energy price on the market is used for simulations. As long as energy price rises to more than 2.2 times the original, the rate of commercial construction and the rate of housing construction will drop to 80% of the original.
2.4.2 The linkage between the urban module and the tourism module Their relationship is in the following: as long as the number of hotels accounts for a certain proportion of the total number of commercial buildings, the rate of hotel construction will make a corresponding change.
2.4.3 The link between the tourism module and the ecological footprint module These two modules may be related through tourists. Using of the formula: tourist * 1000 * stay_days/365, the tourist population converted to local residential population in order to calculate the ecological footprint per person, then the stay duration of tourists is 1.1 days.
3.
Model test
The model test should consist four important steps of simulation process: proof, sensitivity analysis, calibration, and legitimacy. This four-step sequence is not static and the general course may several times (Ford, 1999).
3.1 Suitability In most cases, suitability based on subjective judgments, but it is very important.
8
1: EF per person 1: 2: 3:
2: Builtup area
3: Fossil Energy Land
1 0 1 2 3 1
1
2 3 1: 2: 3:
1
2
1 0 1
2 3 3
1 1: 2: 3:
1 0 0 1.00
21.75
42.50 Quarters
Page 1
63.25 84.00 22:11 2009年11月11日 星
Macao's EF
Fig. 7 Model test: Macao’s EF per person
1: Energy Supply[El乧 1: 2: 3: 4: 5:
2: Energy Supply[Cr乧 3: Energy Supply[He乧 4: Energy Supply[Ga乧 5: Energy Supply[Di乧
1000 9200 115000 20000 65000
5 4 2 5
1: 2: 3: 4: 5:
2
650 8850 100000 15500 45000
5
1
4 3
1
3
4
2
5
1
3
4 3 2
1: 2: 3: 4: 5:
300 8500 85000 11000 25000
1 1.00
Page 1
21.75
42.50 Quarters
63.25 84.00 22:11 2009年11月11日 星
Energy supply
Fig. 8 Model test: Energy supply
9
1: Business Buildings 1: 2: 3:
2: Houses
3: Population
1700 7000 600000
1 1
1450 5500 500000
3
2
1 1: 2: 3:
2
3
2 3 2 3
1: 2: 3:
1200 4000 400000
1
1.00
21.75
42.50 Quarters
Page 1
63.25 84.00 22:11 2009年11月11日 星
Urban City
Fig. 9 Model test: Urban development
1: Tourist 1: 2:
2: Hotel
10000 350
1 1
2 1: 2:
6000 200 1 2 2 2
1: 2:
2000 50
1 1.00
Page 1
21.75
42.50 Quarters
63.25 84.00 22:11 2009年11月11日 星
Tourism
Fig. 10 Model test: tourism One can see that the model is effective long-term (Fig.7-10). For example, the over all trend of ecological footprint of Macao has gradually increased from 0.71 ha/person in the first quarter up to 1.16 ha/person in the twenty-eighth quarter, and then started to rise after slightly declining fifteen quarters. The ecological footprint per person is 1.24 ha/person in 2020 (Fig. 7). The ecological footprint per person rises along with energy consumption rising in the beginning. Since it there is labor shortage in the urban development, the rate of commercial building construction declines at the twenty-eighth quarter or so. Which makes energy demand slowdown, and at this point the number of population and the tourists are not affected and continue to climb. So the ecological footprint per person starts to have a slight decrease (Fig.8-9). The urban development is directly proportional to energy consumption. When the curve of 10
commercial buildings and housing are upward trend, The one of energy consumption is also rising, and vice versa (Fig.10). The number of hotels rises because of the well-developed tourism industry. When the number of tourists does not increase, the number of hotels also remains unchanged. In order to strengthen this evidence, a comparison of two sets of data is performed (Tables 1-2). Table 1 Simulation value of the residential population of Macao in comparison with actual value Actual Simulation valueresult Time
(thousand people) )
value(thousand people)
Relative error
2000
438.5
437.9
-0.14%
2001
444.0
436.7
-1.67%
2002
449.8
441.6
-1.87%
2003
455.8
448.5
-1.64%
2004
461.9
465.3
0.73%
2005
468.0
488.1
4.11%
2006
474.2
513.4
7.63%
2007
480.5
538.1
10.70%
2008
486.8
549.2
11.36%
Table 2 Simulation value of the tourists of Macao in comparison with actual value Time
Simulation
value
(thousand people) )
Actual value(thousand
Relative error
people)
2000
9162.3
9196.1
0.37%
2001
10279.0
10645.0
3.56%
2002
11530.9
12288.8
6.57%
2003
11887.9
11354.2
-4.49%
2004
16672.4
14525.9
-12.87%
2005
18711.1
19984.3
6.80%
2006
21998.1
24964.9
13.49%
2007
27003.4
28313.6
4.85%
2008
22907.7
30498.0
33.13%
3.2 Sensitivity analysis, parameter evaluation and correction It is important to know the models performance. The simulator can obtain a good picture through the sensitivity analysis of the most sensitive part of the model. In addition, good evaluation parameters are derived from the sensitivity analysis results.
3.2.1 Energy price Energy is the main factor of the impact of the fossil energy land, while energy price affects energy use to a certain extent. So the research of the energy price is very necessary. In the model, there is a time impact factor; it can be used to clarify the 11
change of the price with time and for analysis of the sensitivity of the energy price.
3.2.2 Construction of the other data converters In the model’s converter, there is an action by the proportion of job vacancy to construction speed. Its function is similar to that of the attractiveness of the job position, and acts on the urban commercial development. When the proportion of labor force to job position is below 1, the converter will decrease its value below 1 and the lowest value can be zero. On the contrary, if the proportion of labor force to job position is above 1, the converter will increase its value higher than 1 and the and the highest will be 2. Macao has only 27.5 square kilometers in area and is impossible to hold infinite number of people. Therefore, two parameters are established in the model- largest population and the biggest tourists’ number, otherwise the population and tourists will be able infinitely increasing. The largest population and tourists are set to be 800,000 and 10,000,000, respectively. Commercial buildings represent an aspect of urban development which also affects energy use and increase of population. They cannot increase under completely ideal condition. Moreover, available land area is a factor influencing the rate of commercial building and the rate of commercial building has obvious influence on the ecological footprint per person. So it is necessary to carry on a sensitively analysis on the rate of commercial building and the land for commercial construction. Similarly, the study also needs to analyze the rate of housing construction and the housing land(Fig.11-12). EF per person: 1 - 2 - 3 1:
1
2 3 1 1:
1
2 1
3
2
3
3
1
2 1
1:
1 1.00
Page 1
21.75
42.50 Quarters
63.25 84.00 16:32 2009年11月12日 星苅
Sensitivity of business construction rae
Fig. 11 Sensitivity analysis of business construction rate
12
EF per person: 1 - 2 - 3 1:
1
2
3 2
3 2
1:
1
3
3 2 1
1
1
1:
1
1 1.00
21.75
42.50 Quarters
Page 1
63.25 84.00 2:45 2009年11月20日 星苨
Sensitivity of housing construction rate
Fig.12 Sensitivity analysis of housing construction rate
4.
Result
4.1 Ecological footprint simulation By comparing of the simulation results and the Macao Statistics Yearbook as well as foreign trade statistics from 2000 to 2008, the study finds that simulation results * are basically∗ consistent with the actual dates (Table 3 and Fig.13). Table 3 Simulation value of the ecological footprint per person of Macao in comparison with actual value
∗
Simulation value
Actual value
Time
(ha/person) )
(ha/person) )
Relative error
2000
3.30
2.94
12.24%
2001
3.70
3.05
21.27%
2002
3.88
3.21
20.83%
2003
4.07
3.39
20.09%
2004
4.18
3.72
12.46%
2005
4.25
4.25
-0.05%
2006
4.31
4.52
-4.54%
2007
4.33
4.79
-9.53%
2008
4.30
3.89
10.43%
2009
4.27
2010
4.23
2011
4.22
2012
4.25
The unit of the model is the quarter, so the unit of the simulation data changes into the year unit. 13
2013
4.27
2014
4.31
2015
4.36
2016
4.40
2017
4.45
2018
4.50
2019
4.56
2020
4.60
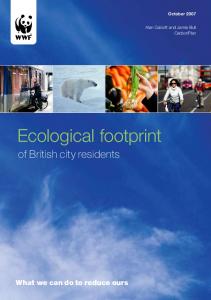
Ecological footprint per person(ha/person)
6 5 4 3 2
Simulation value of ecological footprint per person of Macao Actual value of ecological footprint per person of Macao
1 0 2000 2001 2002 2003 2004 2005 2006 2007 2008 2009 2010 2011 2012 2013 2014 2015 2016 2017 2018 2019 2020
Fig.13 Simulation value of the ecological footprint per person of Macao in comparison with actual value
4.2 City module Residential population steadily rises from 434, 700 in 2000 to 562, 600 in 2020 (Fig. 9). Commercial buildings rise in general, but after the twenty-seventh quarter are in a period of stagnation, mainly due to shortage of labor force and lack of job vacancies, resulting in reduction of new commercial buildings. House number highly increases before the fourteenth quarter, and then slowly rises. We can see that simulation results are basically consistent with the actual data (Fig. 9).
4.3 Tourism module The number of tourists from 2, 175,800 in 2000 will rise to 9, 731, 180 in 2020. The number of the hotels increases from 70 sets in 2000 to 255 sets in 2000 (Fig.10).
5.
Discussion and conclusion
In our study, we want to find limits and choose the most appropriate method for determining the ecological footprint of Macao at the theoretical level. and the conclusion is in the following. As can be seen from the simulation results, the total ecological footprint per 14
person of Macao gradually increases from 3.3 ha/person in 2000 to 4.6 ha/person in 2020. In addition, the number of the resident population and the tourists significantly increase, which alleviates the growth ratio of the ecological footprint per person. Simulation results show that Macao has been in a state of ecological deficit, which are consisted with Dr. Wackernagel and his research group’s result that the ecological footprint per person of other countries, regions and cities have exceeded the their ecological carrying capacity (Wackernagel et al.,1997,1998,2004). While the ecological footprint per person of countries, regions and some developed cities have exceeded their ecological carrying capacity dozens or hundreds of times (Li K.P. et al., 2001). The ecological footprint per person of Macao is in the state of a gradual increase in the next eleven years, and in the recent years with higher growth. So we can be foreseen that the ecological carrying capacity will have a further growth pressure. In addition, the fossil land impacts on ecological footprint of Macao and is the most important factor. It is restricted to the area of available land and the population. We also can be seen that energy price has a litter impact on fossil energy use land. The land is the main bottleneck for the further development of Macao. It is clear that the available land is not accompanied with the speed of economic development of Macao. At present period the reclamation land couldn’t satisfy the demand of the development of Macao’s economy, so as to release the enormous potential economical trend of Macao. To decrease the ecological footprint of Macao, the policy makers should try to: 1).expand the reclaiming ratio or rent the nearby land for cultural and recreation industry from the neighboring city, Zhuhai under the arrangement of the China central government; 2).restrict the quantity of immigrant so as to reduce the resources consumption, and 3).investment on the public transportation facility that will decrease the consumption of the fossil fuel and enhance the efficiency of the energy.
Acknowledgments Thanks for Mr. Qin Y.W. attend the research in 2008. Thanks for the financial support by the Science and Technology Development Fund of Macau (No.022/2007/A2).
References Bagliani M., Ferlaino F., Martini M.. 2005. Ecological Footprint Environmental Account: Study cases of Piedmont, Switzerland and Rhône-Alpes. Edizioni IRES: Torino. Ford A., 1999. Modeling the Environment. Washington. D.C, Island Press. Hunter C. 2002. Sustainable tourism and the tourist ecological footprint. Environment, Development and Sustainability 4: 7-20. Jing X.Q., Shao L.Y., Wang Q. 2006. Analysis the main factors of oil consumption. Journal of Oil and Gas Technology 28(5):147-149 (In Chinese). Li K.P., Wang Z.S. 2003. Ecological footprint analysis of Macao in 2001, Journal of natural resources 18(2): 197-203 (In Chinese). 15
Medved, S. 2006. Present and future ecological footprint of Slovenia-the influence of energy demand scenarios. Ecological Modeling 192: 25-36. The Statistics and Census Service of Macao SAR. 2009. Macau Statistical Yearbook in 2008. Macao, Government Printing Bureau: Macao, pp.20-253. Website: . Wackernagel M., Rees W. 1997. Perceptual and structural barriers to investing in natural capital economics from an ecological footprint perspective. Ecological Economics 20: 3-24. Wackernagel M. 1998. The ecological footprint of Santiago de Chile. Local Environment 3(1): 125-136. Wackernagel M., Rees W. 1996. Our ecological footprint: reducing human impact on the earth. New Society Publishers: Gabriola Islan, pp.61-83. Wackernagel M., Monfreda C., Erb K.-H., Haberl H., Schulz.N.B. 2004. Ecological footprint time series of Austria, the Philippines, and South Korea for 1961-1999: comparing the conventional approach to an ‘actual land area’ approach. Land use policy 21: 261-269. Rees W., 1992. Ecological footprint and appropriated carrying capacity: what urban economics leaves out. Environment and Unbanization 4(2): 192-215.
16