th
15 North American Mine Ventilation Symposium, 2015 — Sarver, E., Schafrik, S., Jong, E., Luxbacher, K. © 2015, Virginia Tech Department of Mining and Minerals Engineering
Modeling and Simulation of Multiple Underground Mine Fire Scenarios at Freeport Indonesia Rick Brakea, Alex Hattbc, Riza Sanid a
Mine Ventilation Australia, Queensland, Australia b Freeport-McMoRan, Phoenix, Arizona, USA c University of Nevada, Reno, USA d PT Freeport Indonesia, Tembagapura, Papua, Indonesia
Mine fires remain one of the most potentially devastating underground incidents due to the prospect of multiple fatalities from the toxic products of combustion, the costly and time-consuming damage to critical underground infrastructure, and the damage to corporate standing and the ‘social license’ to operate. The behavior of mine fires is difficult to predict and often counter-intuitive, especially for intense fires where the amount of energy released by the fire in terms of natural ventilation pressures can dramatically change the volume and direction of airflow in ventilation circuits. This can have major and unexpected impacts on egress and entrapment, firefighting strategies, and the need for and design of fire protection systems. This paper describes a technical study of the potential impacts of mine fires at the Freeport-McMoRan underground mining complex in Indonesia, examining seventeen potentially critical fire scenarios at PTFI as identified by a risk assessment. The range of fires examined includes mine mobile equipment fires, magazine fires, fuel bay fires, fire involving multiple light vehicles in a parking area, a compressor fire, an electrical sub-station fire, a conveyor fire, fire on an bus transporting personnel, spontaneous combustion fires, and fire in a long ‘naturally ventilated’ tunnel used by all vehicles to access the mine surface facilities, but physically unconnected to the mine. A comprehensive review of available technical data from civil and mining sources in terms of the peak heat release rate (HRR) and HRR-time growth/decay curves was undertaken, as well as a careful review of existing data on human survivability limits. This led to the adoption of new design criteria for the modelling of fires as well as survivability limits. Modelling of each scenario was performed in VentSim Visual. To assist in communication of the complex fire behavior to management and workers, “real-time” animations showing direction, flow, and toxic gas concentrations were produced. The implications of the study in terms of egress and entrapment systems, incident management systems, and fire protection systems are also discussed. Keywords: Fire, Underground, Mine, Modeling, Simulation, Freeport.
1. Introduction
2. PTFI Underground Expansion
P.T. Freeport Indonesia (PTFI) operates a complex of surface and underground mines in the Grasberg Minerals District located in the highlands of Papua, Indonesia. Currently the mining complex is producing ore from the Grasberg Open Pit (GRS), the Deep Ore Zone (DOZ), and Big Gossan (BG) mines. As surface operations at the GRS end (currently forecasted in 2017) plans call for a transition to underground mining to replace GRS pit feed to the mill. With this in mind PTFI has initiated development of two block cave mines.
With the planned end of surface mining from the Grasberg Open Pit in 2017, PTFI will transition to an entirely underground mining operation. This transition requires substantial additions to the current underground operations, with major expansions in underground shops, electrical systems, crush/convey operations, and fleet size to support the increased mining rates. These facilities are large enough to support the operations of each mine along with offsetting the loss of surface maintenance facilities due to caving and construction.
The Grasberg Block Cave (GBC) is a continuation of the mining of the Grasberg Deposit from beneath the current pit. The Deep Mill Level Zone (DMLZ) is the next lift in the East Ertsberg Skarn System (EESS) and lies below the footprint of the DOZ Mine. In aggregate the planned underground expansion represents a reserve of approximately 1.5 billion metric tons and will support a processing rate of 240 ktpd through the end of the current Contract of Work in 2041.
In light of the expansion of the underground facilities an ‘Underground Fire Risk Assessment’ was completed in November 2013. This assessment generated 17 scenarios that were considered to be credible fire risks based on the knowledge of site engineering and safety groups, as well as external consultants. These were not the 17 “highest risk” scenarios, but were chosen to capture a broad range of types of fires underground as well as some of the highest risk scenarios.
____________________________________________________ Author’s email:
[email protected]
1
3. Revisiting Fire Modeling 3.1 Scenarios Subsequent to the risk assessment a decision was made to pursue computer modeling of the 17 scenarios identified. The scenarios considered can be generally described as mobile equipment fires, conveyor belt fires, electrical transformer fires, explosives fires, and spontaneous combustion events. Past fire events at PTFI as described in Duckworth [6] were updated with additional to-date information from safety groups. This reinforced the belief that the most frequent risks for fires in the underground were presented by mobile equipment, and that the ongoing expansion of the underground fleet since the last evaluation would increase this risk.
The planned increases in staffing and extents of the operation presented a number of challenges on how best to communicate the risk from fire to stakeholders. Given the advances in computer graphics in the last 5 to 10 years the decision was made to use the VentFire package within VentSim Visual to generate video animations for each scenario. These videos would in turn be used to visually convey the potential risks from fires to stakeholders. 3.2 Determining Design Fires The 17 scenarios generated from the risk assessment are listed below in table 1.
Table 1. PTFI Fire Modeling Scenarios
Scenario Number 1 2 3 4 5 6 7 8 9 10 11 12 13 14 15 16 17
Scenario Short Title
Type of Fire
Operations Affected
AB Tunnels Intakes DOZ Intakes ARD Portals Intakes DOZ Intake Fuel/Lube DOZ Magazine GRS 34 Conveyor GVD Intake Kasuang Magazine CI3 Compressor Kasuang Intake Intake 3, XC11 Big Gossan Workshop DOZ Parking Lot DOZ Spontaneous Combustion GRS OP Spontaneous Combustion Zaagham Tunnel GVD 3 Access
AD55 truck GBC, Big Gossan, DMLZ Iveco bus DOZ AD55 truck GBC, Big Gossan R1700 LHD DOZ ANFO DOZ Conveyor DOZ AD55 truck GBC ANFO Big Gossan Compressor GBC AD55 truck Big Gossan Electrical Substation DOZ R1700 LHD Big Gossan 5 light vehicles DOZ Spontaneous combustion DOZ Spontaneous combustion DOZ Iveco bus Zaagham tunnel AD55 truck DOZ, GBC, Big Gossan, DMLZ Release Rate (HRR) and durations of the three phases of the fire as shown in Table 3. Similar inventories were While the majority of the scenarios considered fires completed for the remaining non-equipment fire involving mobile equipment a selection of fires related to scenarios. conveyors, electrical substations, underground compressors, and spontaneous combustion were also chosen to better understand their potential impact. 4. Heat Release Rate (HRR) Curves With the large number of scenarios to be considered 4.1 Concept and Recent Developments the fires were reduced down to a series of ‘design fires’ that could then be shared between scenarios to reduce The heat output (“heat release rate” or HRR) from the amount of work required in setting up the models. the fire at any time governs most of the behavior of the This in turn made more time available for analyzing and fire and is therefore critical to any fire modelling. understanding the results as well as making The stages of a fire and the true HRR of a fire are improvements in how the final information was generally said to follow the type of curve shown in presented. For mobile equipment fires fuel inventories Figure 1. were created for each of the four mobile equipment scenarios (AD55 haul truck, Iveco Bus, R1700 LHD, In Figure 1, note that the peak HRR is only an Five Toyota Light Vehicles) based on manufacturer instantaneous value. The peak HRR is not the average specification and equipment data sheets. Calorific values HRR during the peak (or fully developed) phase of the were assigned for each fuel item based on a literature fire. Also, note that the dividing line between “fully search of fuel values from differing sources including the developed” and “decay” is rather arbitrary. power generation industry [1], past studies completed by the USBM [9], and the European Thematic Network Fire in Tunnels [10] as shown in Table 2. This was reduced to the inputs for the fire simulation, namely the Peak Heat
2
Table 2. Fuel Inventories for Mobile Equipment
Tires Diesel fuel Hydraulic oil Equiv. diesel for interior Hoses and flammables
Heating Value (kJ/kg) 32,599 45,101 31,168 45,101 32,599
AD55 Truck 4,663 960 258 466
Iveco Bus 435 300 15 44
Combustible Mass (kg) R170 Five light LHD vehicles 3,520 472 990 871 125 108 352 47
Table 3. Calculated Fire Parameters Based on Fuel Load and Peak HRR
Total heat of combustion Total mass fuel Weighted average Peak HRR mass Tires & hoses Diesel fuel Hydraulic oil Equiv. diesel for interior Peak HRR/GJ ratio Peak HRR Growth phase Peak phase Decay phase Total fire duration
GJ kg MJ/kg mixed fuel Mass kg/hr % by mass % by mass % by mass % by mass ratio MW mins mins mins mins
AD55 Truck 217 6,319 34.4 6,825 81% 15% 4% 0% 0.3 65 5.6 30.6 44.4 81
Iveco Bus 29 786 37.5 849 61% 38% 0% 2% 0.3 9 5.6 30.6 44.4 81
R1700 LHD 174 4,961 35.0 5,358 78% 20% 3% 0% 0.3 52 5.6 30.6 44.4 81
Five light vehicles 59 1,475 39.7 1,593 35% 59% 7% 0% 0.3 18 5.6 30.6 44.4 81
The total fire duration was more than three hours although there was a pronounced decay after two hours. Note that the ratio of peak (16 MW) to average (7 MW) HRR was about two during the first two hours and the ratio of peak HRR (MW) to calorific value burnt (50.5 GJ) was about 0.3. Wind speed over the fire started at 0.3 m/s (low) and increased during the fire to 2.2 m/s due to natural ventilation pressure (NVP).
Fig. 1. Idealized stages of a fire [18]
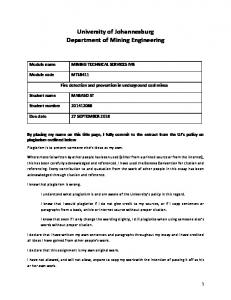
Despite the above conceptual curve there are many ways a fire can start and progress which can alter the peak HRR and the duration of a fire. For example, Hansen [11] conducted a full-scale underground fire on a 14 tonne payload Toro 501 LHD (total calorific value on board of 76 GJ) and obtained the HRR-time curve in Figure 2. In this fire the front two tires did not catch fire so the total heat produced was estimated at 50.5 GJ. If the tires had burnt the peak HRR and fire duration would have increased somewhat. The peak HRR was 16 MW although this is an instantaneous spike; if averaged over 10 minutes, the peak could also be interpreted as closer to 13 MW. The peak occurred within only a few minutes of ignition.
Fig. 2. HRR-time curve for 14 tonne payload Toro 501DL LHD fire [11]
Hansen also conducted a full-scale underground fire on a drill rig (total calorific value 32.5 GJ) and obtained the HRR-time curve shown in Figure 3. The peak HRR was measured at 29 MW although, like the LHD, this is an instantaneous spike. The peak could also be interpreted as closer to 25 MW over 3 or 4 minutes (still roughly double that of the LHD) or even lower at about 18 MW if the “peak” is defined as a 10 minute period.
3
The peak HRR in this case occurred approximately 20 minutes after ignition. The total fire duration was approximately 70 minutes (average HRR 9 MW) although there was a pronounced decay immediately after the peak was reached. Note that the ratio of peak to average HRR was also about 2 (18/9) and the ratio of peak HRR (MW) to calorific value burnt was about 0.55 (18/32.5). Wind speed over the fire started at 1.3 m/s and increased during the fire to about 2.6 m/s at the peak HRR. Minimum oxygen downwind was 17.2% and maximum CO2 was 2.37%. The CO was not measured during to an instrumentation problem.
slow down the growth of the fire) by taking heat away from the fire. During the peak phase, the peak HRR values increases as wind speed increases up to about 3 to 5 m/s, beyond which the HRR does not further increase. See Figure 4 where “k” is the ratio of HRR in the actual fire to the HRR that the same fire would produce in the open (i.e. on surface) with no artificial airflow over it.
Note that both the Hansen tests were conducted under relatively low wind speeds (2.2 to 2.6 m/s at the peak HRRs).
Fig. 4. Influence of wind speed on peak HRR values in a tunnel fire [2]
Fig. 3. HRR-time curve for drill rig fire [11]
Further measured data on large single vehicle fires was obtained from the Handbook of Tunnel Fire Safety [2] and is shown in Table 3 which is also in line with data presented by Duckworth [7]. Table 3 Measured fire data on heavy goods vehicle (HGV) fires in tunnels [2]
Tunnel Cross Section (m2) 32 32 30 32 32 50 50 50 50 30 50 Avg Max Min
GJ
Wind Speed (m/s)
240 3 129 3 87 3 to 6 152 3 67 3 19 1 to 2 10 1.5 10 5.3 10 5 63 0.7 35 unknown
Peak HRR (MW) 202 157 128 119 67 26 13 19 16 17 23
Time to Peak HRR (min) 18 14 18 10 14 12 16 8 8 15 48 16.4
Peak HRR /GJ 0.84 1.22 1.47 0.78 1.00 1.37 1.30 1.90 1.60 0.27 0.66 1.1 1.90 0.27
Wind speed has an effect on the intensity (HRR) of a fire, particularly during its growth phase (increasing how fast the fire grows). Very high wind speeds can potentially increase the duration of the growth phase (i.e.
Although experimental work has shown that there is an interdependency between velocity over the fire, the HRR, and NVP much of the discussion in the literature assumes NVP developed by an underground fire is small, overall airflow in the tunnel remains relatively constant, and that it does not change direction over the fire. This is frequently not the case in underground metal mines where the geometry of the deposit typically required operation over a range of elevations that are interconnected via travel ways. This geometry allows for conditions to develop that would otherwise not be experienced in a controlled lab test setting, and which increase the difficulty of accurately modeling the behavior of the fire. Brake [3] notes: “In some cases, the NVP produced by the fire results in choking to the point where further development of the fire is oxygen constrained; however, not enough NVP may be produced to actually reverse the flow over the fire.” Where a fire does reverse direction, the low oxygen content of the products of combustion (POCs) now being drawn back over the fire decreases the heat output from the fire which reduces the NVP that the fire is producing. In some cases, this loss of NVP causes the flow over the fire to revert to its original direction. In certain circumstances an unstable situation may develop where the airflow reverses back and forth. In practice, rollback could potentially develop in such a scenario drawing fresh air to the fire and potentially restarting the sequence. This highlights one of the more important limitations of computerized modeling of fires. The model is an approximation of the behaviors of a more complex system, and that the model has limitations (e.g. one-
4
dimensional flow) that give the results a degree of uncertainty.
The “Realistic” method is similar to the Duggan method but allows the various fuels to commence burning at different times. This results in a HRR as shown in Figure 7. Note that this is approaching the “true” HRR shape of Figure 1.
4.2 Variations on HRR Curves Due to the inherent variability in the exact behavior of tunnel fires, different simplifications of the HRR curve are used in practice. These are intended to give a numerical representation of the fire for a single set of assumed parameters.
4.2.1 “Traditional” Method In this approach the calorific value of each of the combustibles in the fire are summed, and an average heat release rate is calculated depending on the duration of the fire. The important thing to note is that in this technique the HRR is constant through the duration of the fire. See Figure 5.
Figure 7 “Realistic” HRR model [14] (Sic)
4.2.4 “t-squared” Method In the “t-squared” method the HRR in both the growth period (from t0 to t1) and the decay period (from t2 to t3) increase and decrease as square of the time respectively as shown in Figure 8. This is the type of curve used by MFIRE 2.30 [18].
Figure 8 “t-squared” HRR model [18] Fig. 5. “Traditional” HRR model [14]
4.2.2 Duggan Method This method superimposes together the heat release rate of each individual fuel type (based on the exposed area for that fuel and its ‘measured’ HRR per exposed surface area). It is assumed that all these materials ignite at the same time. See Figure 6.
Fig. 6. Duggan HRR model [14] (Sic)
4.2.3 “Realistic” Method
4.2 Critical Points of Understanding Some important points can be noted from the discussion in section 4.1, with respect to underground mine fire scenarios: • The duration of the growth phase can range from a few minutes to 20 minutes. • There is usually only a small quantity of the total fuel on board that is consumed in the growth phase (before flashover). • Unless the fire is manually extinguished, most fires have a long tail (decay period) in which a substantial fraction of the total fuel is burnt. • The ratio of peak HRR to total calorific content in mobile equipment fire varies from 0.3 to 1.9 (LHD) and 0.3 to 0.77 (drill rig) for the underground mine fires measured by Hansen. • This ratio will be higher where there is more surface area for fuel to burn (e.g. 4 separate tires plus diesel fuel plus hydraulic fuel) compared to less surface area to burn (e.g. ANFO stacked in pallets). • The peak HRR is just a very short duration spike which is to be expected in underground mine fires which, after flashover, are usually (but not always) limited by available fuel rather than airflow (oxygen).
5
• A more representative value is probably the “average” HRR during the “fully-developed” phase of the fire. • The shape of the HRR in the “fully developed” phase can vary significantly. • The “dividing line” between “fully developed” and “decay” phases can be rather arbitrary. • The peak HRR increases with increasing wind speed up to about 3 to 5 m/s. • The HRR-time curve can change very significantly if natural ventilation pressures make dramatic changes to airflow over the fire, or cause airflow reversals at the site of the fire.
more directly compatible with the VentFire software package. This is the approach used in the modelling reported in this paper. See Figure 9.
4.3 Modified t-squared method Based on the information gathered from a review of the different methods of constructing HRR curves a new approach was implemented for this study. The main item of focus was the relationship between the ‘peak’ HRR and the total energy content of the fuel. The following parameters were used in defining the HRR curves for heavy equipment in the modeling conducted. • • • •
A growth phase in which 5% of the fuel is consumed A peak phase in which 55% of the fuel is consumed A decay phase in which 40% of the fuel is consumed A peak HRR (MW) of 0.3 x calorific content (GJ)
These parameters were selected based on representation of the phenomena observed in more recent full scale experiments reviewed in the literature, however they could be adjusted. The definition of the peak HRR as a function of the total fuel content implies that the intensity of the fire is limited by the mass of the objects burning. This agrees with intuitive notions and research observations of burning objects. The more massive the burning object is, and implicitly the greater the surface area, the greater the potential intensity (maximum HRR) of the fire. By linking each phase to a fraction of the total fuel load the development and decline of the fire can be adjusted by the modification of the mass fractions. This again agrees with intuitive notions of burning objects. An object that catches fire and rapidly increases in intensity will have little time to burn fuel as compared to the same object taking a longer time to reach the ‘fully developed’ phase. No manual ‘throttling’ of the fire is required in HRR curve itself. Based on the oxygen consumption rates of the fuels input into VentFire, the software calculates the amount of oxygen ‘consumed’ by the fire and reduces the heat output when insufficient oxygen is available (e.g. air passing back over the fire during a flow reversal). What constitutes insufficient can be adjusted by the user from the default values should it be desired or necessary. This method is similar to the “t-squared” approach but modified so that the growth and decay phases are linear increases and decreases in HRR making them
Figure 9 Modified “t-squared” HRR mode
This approach addresses some of the challenges and known limitations associated with the implementation of other HRR curves: • The use of a linearized HRR rather than smooth curves, thereby simplifying the input to the model. • The definition of phases by the amount of fuel consumed rather than a time phase. While the two are inherently linked the definition by fuel consumption appears to lead to greater understanding by personnel. • The definition of the peak HRR as a plateau in the HRR rather than a point value. While the peak HRR is in fact a point value in a real fire the use of a period of constant output better defines the general behavior of the fire. • Boundaries between phases (while still arbitrary) are well defined. • No manual throttling of the fire for insufficient oxygen. In other words, Ventfire would automatically adjust the HRR “design fire” curves where there was insufficient oxygen to support the HRR. • No assumptions required about the times of ignition for various fuel components of a fire, which can vary widely depending on the actual conditions and flame spread.
5. Building the Models The DOZ mine has undergone numerous expansions in production capacity, initially starting at 25 ktpd and expanding to the current 80 kptd operation. With each of these expansions in production capacity the primary ventilation system has been added to accordingly, increasing from an original design flow of approximately 970 m3/s [5] to the present system specification of approximately 2,300 m3/s. During this 6 year period of production expansion, 5 ventilation surveys of the combined DOZ and MLA ventilation systems were completed.
6
In addition to the DOZ ventilation surveys, ventilation surveys have been completed in the other underground mines to verify design values, system operating points, and provide models for planning. In total, 11 ventilation surveys of the underground workings were completed in roughly a 10 year span with notable overlap as drift dimensions and primary fan arrangements were changed. This presented a large amount of relevant data to review before being integrated into a model that was suitable for modeling fires. With the long history of ventilation surveys and modeling at PTFI site engineers have traditionally used resistance per length (R/L) values and incompressible flow models for day to day operations. While this is adequate for the vast majority of work, incompressible flow does not work with the thermodynamic calculations that are used in fire modeling. Additionally, the use of R/L data for resulted in many drifts being modeled as 1 m diameter ‘pipes’ with dimension specific R/L values rather than rectangular drifts. This presented an issue for the correct calculation of velocities and spread times, as well as giving incorrect area/perimeter data for thermodynamic modelling. Resistance data from past ventilation surveys was checked against mine survey pickups from the period to determine the correct drift dimensions and corrected to standard density from the mine density. Where drift dimensions had changed and new pressure/volume (P/Q) survey data was not available (such as the benching of intake drifts), as-built dimensions with k-factors suggested by historic data [8] were used. Because of the large extent of the existing underground workings it was not considered feasible or cost effective to conduct a complete P/Q survey of all areas. The ventilation department at PTFI undertakes monthly volumetric surveys of the working areas in the mines as well as primary fan operating points. Measured resistances were compiled into a VentSim model that was then checked against fan operating points, monthly volumetric surveys, and field P/Q data at critical points. These checks were used to further refine the model to more closely represent current operating conditions at the mine. Issues were encountered with respect to pressure closure in the models, however flows in primary ventilation and access drifts correlated well with recent measurements. This was considered an acceptable trade-off, with the goal of accurately modeling the spread of contaminants in primary infrastructure rather than focusing on complete model closure.
6. Survivability Criteria In addition to the computer modeling of the fire itself, basic survivability criteria was also evaluated with consideration of the altitude above sea level and parameters that could be reasonably modeled with the software. It is important to note that the survivability criteria excludes persons caught directly in the fire (i.e.
passengers on a bus that catches fire), persons trapped inbye of a fire, and rescue personnel who have special training and equipment. Factors that were considered in the development of survivability criteria included the concentration of toxic gasses, low oxygen, high temperatures, and reductions in visibility which could impede safe egress. Factors specific to the PTFI mines include high altitude, prevalence of smoking with the underground workforce, and use of oxygen generating SCSRs. Underground workings at PTFI extend from 2500 to 4000 m above sea level as a result of the multiple lifts of caving that have occurred and the interconnection of existing ventilation infrastructure to new workings. Studies have shown that preferential bonding between carbon monoxide and hemoglobin may be made worse by increased altitude [15]. Additionally, the prevalence of smoking in the underground workforce increases the likelihood that workers will already have an increased concentration of carbon monoxide in their blood compared to a non-smoking counterpart. With the increased perceived risk to workers, the dosage limit for carbon monoxide in this study was reduced to 18,000 ppm-minutes, or the equivalent of an average exposure of 600 ppm for 30 minutes (a Fractional Effective Dose (FED) of 0.5 [16]). This is half of the NIOSH Immediate Danger to Life and Health (IDLH) value of 1200 ppm over 30 minutes or 36,000 ppm-minutes at sea level [13]. While the reduction of the partial pressure of oxygen at altitude due to low barometric pressure is effectively the same as a reduction in the concentration of oxygen at sea level, in this fire scenario modelling the controlling toxic gas will be either carbon monoxide or carbon dioxide. Therefore a nominal limit of 18% oxygen was chosen without introducing any additional complications. PTFI makes use of SAVOX 30 minute oxygen generating self-rescuers. These units are rated by the manufacturer at 30 minutes for a person of roughly 75 kg who is calm. Testing has shown that the capacity of the unit can be used up in as little as 15 minutes depending on the size and duress of the individual. In line with best practice, the de-rated capacity of 15 minutes was assumed for tenability. This would be in addition to the time that a person could travel safely after the SCSR was consumed, before the potential exposure to other hazards would become debilitating. Poor visibility during egress reduces travel speed, makes it difficult to locate the egress, increases the hazards during egress (e.g. vertical openings or tripping) and has a major psychological impact. Paveley [14] notes that at visibility of 7 m egress is relatively unhindered, but at 3 m most persons will not enter smoke. Travel speeds and distances under self-rescuer have been reported earlier by Brake and Bates [4] and these were used in this study. WB and DB limits were from an examination of the Oxford index by Leithead
7
and Lind [12] and from British Coal work on mine rescue brigadesmen as reported by Varley [17].
7. Analysis of Results With the large number of scenarios a concise method of evaluating and communicating the results of each simulation was required. For reporting purposes a table approach was used, where each of the potentially toxic agents were listed along with the accepted “Safe” limit for egress. Values that approached or exceeded the applicable limit were flagged for review. This is shown in Table 4. Obviously gas toxicity is only relevant where the person is not wearing a self-rescuer, the self-rescuer is not operating properly, or the duration of exposure exceeds the self-rescuer time limit. In some instances the toxic concentration was still increasing when the model was terminated for practical reasons, but in most cases the peak value was reached (PVR).
In addition to the table approach video animations were generated using the Dynamic Simulation tool in VentSim. These illustrated the time dependent spread of POCs using color coding of branches as well as annotative values at key monitoring points. Emphasis was placed during presentation on the fact that these scenarios were only potential outcomes based on probable estimates, and that given the number of unknowns about actual fires there was no way to predict exactly how smoke would spread through the underground workings. Of course, an advantage of modelling is that once a fire is “set up”, then running the simulation with different assumptions is a straightforward exercise. Both the tabular and video forms of presentation were well received by site personnel and in many cases either reinforced existing thoughts on the risks presented by fire or clarified the potential extents of contaminant spread throughout the underground complex.
Table 4. Example Summary Fire Modeling Results1 Monitoring Point Peak Values “Safe” limit for Fire: Iveco MP02: XC MP11: MP05: egress Bus in DOZ 11 Shop DOZ DOZ Intakes Magazine Lunchroom Critical Agent Carbon Monoxide Oxygen Carbon Dioxide
Peak Value Reached? 600 ppm by volume 18% by volume 40,000 ppm (4%)
Visibility Temperature, WB Temperature, DB Comments2
MP19: DOZ Intake Fuel/Lube Shop
MP30: DOZ Haulage
PVR
PVR
PVR
PVR
PVR
PVR
153
Nil
90
2
88
2
20.8
Normal
20.9
Normal
21.0
21.0
131
Normal
930
390
920
390
10 m
4.8
Normal
8.2
25
8.4
25
320 C
18.8
Normal
11.4
10.5
11.1
11.0
600 C
35.7
Normal
11.4
10.7
11.12
11.2
Safe
Safe
Safe
Safe
Safe
Safe
Safe
1
Note that these are based on 30 minute exposures, and therefore (with exception of visibility, WB and DB) are only relevant where the exposure is longer than 30 minutes AND the individual is not wearing a SCSR or is inside a refuge. Visibility, WB and DB will impact on survivability even if wearing SCSRs. 2 Locations labeled as “Safe” imply that there is no information collected from the simulation which exceeded the established limits, and that it is likely that a person could safely egress the area indicated without suffering long term effects from exposure to the conditions shown.
8
8. Outcomes at Site With the renewed focus on the risk presented by underground fires PTFI has established an Underground Fire Risk Control and Response Management Committee. This committee consists of individuals from industrial hygiene, mine rescue, ventilation, safety, ore flow, electrical maintenance, and underground maintenance along with subject matter experts from other departments who are tasked with updating standard operating procedures, policies, standards, and emergency response plans. In addition, the group performs work area audits for compliance with internal standards and applicable regulations.
Acknowledgements The authors would like to acknowledge the numerous individuals at PTFI who participated in the risk assessments, underground inspections, and data collection that supported this work. The authors would also like to thank management at Freeport-McMoRan and PTFI for supporting the publication of this paper.
References [1]
[2] [3]
[4]
[5]
[6]
[7]
[8]
[9]
Bajus M and Olahová N, 2011. Thermal Conversion of Scrap Tyres. Petroleum & Coal 53 (2). Beard A and Carvel R, 2011. Handbook of Tunnel Fire Safety. ICE Publishing. 2nd ed. Brake, D J, 2013. Fire Modelling in Underground Mines using Ventsim Visual VentFIRE Software. Proc 2nd Australian Mine Vent conf (Chalmers D, ed). Adelaide. The AusIMM. pp 265-276. Brake, D J and Bates G P, 1999. Criteria for the design of emergency refuge stations for an underground metal mine. Proc AusIMM 304(2):1-8. Calizaya F and Mulyadi A, 1998. A New P.T. Freeport Mine Ventilation System – Basic requirements (25,000 TPD Plan). SME Preprint No. 98-57. Littleton, CO: SME. Duckworth I, Casten T, Loomis I, 2010. Understanding fire risk at P.T. Freeport Indonesia. 13th US/N. American Mine Ventilation Symp. Hardcastle & McKinnon (eds). Duckworth I, 2008. Fires in vehicular tunnels. 12th US/N. American Mine Vent Symp. Wallace (ed). Duckworth I, Loomis I, Prosser B, 2012. Fifteen years of resistance data collected at Freeport Indonesia. 14th US/N. American Mine Ventilation Symp. Calizaya & Nelson (eds). Egan M, 1990. Summary of Combustion Products From Mine Materials: Their Relevance to Mine Fire Detection. USBM Information Circular 9272. US Dept of Interior.
[10]
[11]
[12] [13]
[14]
[15]
[16]
[17]
[18]
Haack A (ed), 2010. Design Fire Scenarios. Tech report Part 1. European Thematic Network Fire in Tunnels. Hansen, R and Ingason, H, 2013. Full-scale fire experiments with mining vehicles in an underground mine. Research Report 2013:2. Mälardalen University. Leithead C S, Lind A R. 1964. Heat Stress and Heat Disorders. London, Cassell. NIOSH, 1995. Immediately Dangerous to Life or Health Concentrations (IDLH) Chemical Listing and Documentation of Revised IDLH Values (as of3/1/95). http://www.cdc.gov/niosh/idlh/intridl4.html accessed on 29 January 2015. Paveley, 2010. Reference design. Section 24— Fire and Life Safety. Engineering Brief. Sydney Metro. Penney, D.G., ed. (2000) Carbon Monoxide Toxicity, CRC Press, 560 pp, Chp 6, McGrath J.J. of Texas Tech University School of Medicine Purser D, 1989. Modelling Toxic and Physical Hazard in Fire. J Fire Safety Science. Vol 2 pp 391-400. Varley F, 2004. A study of heat stress exposures and interventions for mine rescue workers. SME annual meeting (Feb 23-25, 2004). SME. Zhou, L., Luo, Y., 2010, “Application of the tsquared fire model in MFIRE,” Proc. of 13th United States/North American Mine Ventilation Symposium Hardcastle & McKinnon (Eds.)
9