XVIIth World Congress of the International Commission of Agricultural and Biosystems Engineering (CIGR) Hosted by the Canadian Society for Bioengineering (CSBE/SCGAB) Québec City, Canada June 13-17, 2010
MODELING AND STATISTICAL CHARACTERISTIZATION OF THE SIZE AND MASS DISTRBUTION OF RAISIN BERRIES AKBAR ARABHOSSEINI1, NAVVAB KARIMI, MOHAMMAD HOSSEIN KIANMEHR1, JAVAD KHAZAEI1 1
A. Arabhosseini, Department of Agrotechnology, College of Aburaihan, University of Tehran, Tehran, Iran,
[email protected] 1 N. Karimi,
[email protected] 1 H. Kianmehr,
[email protected] 1 J. Khazaei,
[email protected]
CSBE100618 – Presented at Section VI: Postharvest Technology and Process Engineering Conference ABSTRACT Processing of raisins involves various operations like washing, drying, cleaning, separating, and grading. Normally, for designing the grading and separating machines, it is not only important to know the mean values of these physical properties, but also the description of the berries properties distribution is needed. Therefore the prediction of size and mass frequency distributions of raisins by a suitable theoretical distribution model is important for designing the processing systems and farm management. The size and mass of raisins were statistically analyzed by normal and three-parameter Weibull distributions to analyze the differences between mass and size distributions for damaged and whole berries. The goodness of fit of the models was evaluated by means of Kolmogorov-Smirnov statistical test. The results showed a high degree of randomness of whole berries in the range of 6.4-16.4 mm for length, 5.4-14.2 mm for width and 4.0-10.4 mm for thickness. Corresponding values for damaged berries were 3.9-9.9, 2.1-8.8, and 1.1-4.9 mm, respectively for length, width and thickness. The mass of whole and damaged berries also exhibited a high degree of variability in the range of 0.21-1.05 g and 0.02-0.42 g, respectively. The results showed that Weibull distribution was relevant for modeling the probability distribution of size parameters of whole and damaged raisins. The fitted distribution can then be used for calculating the berries properties based on percentiles of the data, in reliability-based design calculations, or in simulations of the performance of grading machines and separation of whole and damaged berries. Keywords: Raisin, raisin berries, weibull distribution, physical properties and separation
CIGR XVIIth World Congress – Québec City, Canada – June 13-17, 2010
1
Nomenclature Ap
Projected area (mm2)
Vellip
Ellipsoid assumed volume (mm3)
D Dg
Diameter of cone (mm) Geometric mean diameter (mm)
W α
Intermediate diameter of berries (mm) Shape parameter of the Weibull distribution
fwe(x)
Probability density function of the Weibull distribution
β
Scale parameter of the Weibull distribution
Few(x) h H L M S
Cumulative density function of the Weibull distribution Height of the pouring (cm) Height of the cone (mm) Major diameter of berries (mm) Mass of the berries (g) Surface area of berries (mm2)
γ ε
Location parameter of the Weibull distribution Porosity (%) Dynamic angle of repose (degree ) Static angle of repose (degree ) Sphericity of berries (%) Density of the air (kg/m3)
T
Minor diameter of berries (mm)
Bulk density (kg/m3)
Vbal
Balance method determined volume ( mm3)
True density (kg/m3)
Ø
1 INTRODUCTION Raisin is a concentrated source of carbohydrate and a nutritious snack, containing dietary fiber, antioxidants, potassium, and iron (Kim et al., 2008). Raisin also has low sodium content and high levels of thiamin, magnesium, phosphorus and propionic acid. The most common uses of raisin are in: breakfast cereals, bakery products, confections and snacks, dairy products, food preparations and wine-making (Mandala and Daouaher, 2004). Processing of raisins involve various operations in sequence of washing, drying, cleaning, separating, sorting and packing (Karathanos et al., 1995). After washing and drying of raisins until 15 or 16% moisture content at the plant, they are poured into a hopper which feeds onto a series of conveyor belts and drums that remove any remaining stems, chaff or lightweight fruit. Quality control plays an important role once the raisins are at the plant. For this, raisins must be free of mold, pests and other imperfections. The main undesirable materials in raisin are stems and demolished berries. Grapes harvested in clustered or bunch forms. When the harvested grapes dried traditionally or by drying devices, bunches of grapes convert to raisin and some dried stems or staffs. Furthermore, some berries of grapes at vineyards withered and demolished for several reasons such as diseases, damaging on the surface caused by the larvae (Mondy et al., 1998), hail and bill of birds (Pearson and Goheen, 1988). Consequently, in drying process these berries appeared in hollowly, wrinkled, mummified and shot berry forms (“Qokhuq” in local (Turkish) language). These undesired berries and spoilages should be separated from the raisin. Separation can be performed by using pneumatic separators, screen cleaners, or gravity tables (Hauhouot et al., 2000). Also, because of the irregular shape of the raisin berries and differences in weight between raisins and not in demand materials, a gravity depended system could be used to assist separation and sorting (Rashidi and Seyfi, 2008; Hauhouot et al., 2000). Physical characteristics such as dimensions, weight, shape (Sphericity, Projected Area), density and friction are important to machine installing and designing and operating for separation and CIGR XVIIth World Congress – Québec City, Canada – June 13-17, 2010
2
also are main parameters in selection and design of a screen cleaning system (Hauhouot et al., 2000; Kostaropoulos, et al., 1997). Grading or classifying of whole raisin berries also is important for best quality targets, machine selecting and determining holes sizes of categorizing devices. It is possible to characterize statistically raisin berries on the basis of dimensions for separating and classifying or grading targets. In other words, statistic means is necessary to validate, analyze and process raisin berries information. For this work, the Weibull distribution utilized because of the most popular distributions in reliability engineering and also its versatility and flexibility in comparing with other types of distributions (Rojano et al.2004). Corzo et al., (2008), used Weibull distribution for modeling air drying of coroba slices. Voicu et al. (2008), utilized normal, gamma, beta and Weibull distributions for simulating and describing the variation separation intensity of seeds on sieve length of a combine’s cleaning system. And also, Rojano et al. (2004) characterized oat grains by means of Weibull distribution. Some properties of raisin have been investigated by many scientists, such as Rheological (Lewicki and Spiess, 1995; Lewicki and Wolf, 1995), viscoelastical (Karathanos, et al. 1994) properties, frictional property (Kostaropoulos, et al., 1997), and thermal properties (Vagenas, et al. 1990). The aim of this study was to investigate some physical properties of raisin at safe storage moisture content for separating reason. The examined properties include: size, sphericity, area, volume, density, porosity and static and dynamic angle of repose. The other object of this investigation was characterizing whole raisin berries by Weibull distribution for sorting, classification and separating targets.
2 Materials and methods 2.1 Samples The examined materials were Golden Bleached Raisins (GBR). The raisins were produced by sun drying of Thompson seedless grapes at the village of the “Qurujan” in the South Azerbaijan (Iranian Azerbaijan). The grapes were pretreated by immersion in 2% K2CO3 solution for ruining the natural wax coating, resulting in an increase in the drying speed. The grapes also were treated with SO2 to preserve the golden color (Karadeniz et al., 2000), to prevent the enzymatic browning (Karathanos, et al., 1995) and facilitate drying process (Pateraki, et al., 2007). The moisture content of raisins, were determined by the vacuum oven (70 °C for 48 hours under vacuum) method (Karathanos, et al., 1995). The raisins were separated by hand and classified into three divisions: demolished berries, whole berries and no separated berries.
2.2 Physical properties The size of the sample was determined by measuring the dimension of the principal axes; length (L) in direction of tail stalk, width (W) and minor diameters (T) as the thickness. A number of 110 samples randomly selected and measurements were done using digital caliper having an accuracy of 0.01 mm. Subsequently, the nut mass of each demolished and whole berries were measured using an electronic balance with an accuracy of 0.001 g. The geometric mean diameter (Dg), sphericity (( surface area (S), and projected area were calculated using the following equations (Mohsenin, 1970):
CIGR XVIIth World Congress – Québec City, Canada – June 13-17, 2010
3
(1) (2) (3) (4) The volume of berries was calculated by the formula of ellipsoid (Lewicki & Spiess, 1995) as: (5)
2.3 Weibull distribution The Weibull distribution was used in this study to characterize raisin berries distribution. The probability density function (pdf) of the Weibull is in the following form: (6) or it’s cumulative distribution function (cdf): (7) where α, β, and γ are the shape, scale, and location parameters of the Weibull distribution, respectively, and X is the independent variable corresponding to length, width or thickness of raisin berries.
3. Results and discussion 3.1 Physical properties Some physical properties of whole and demolished raisin berries by mean values, ranges and standard deviations are shown in Table 1. Consequently, these properties will be detailed. The moisture content at three repetitions was found to be 16±0.38% (d.b.). By using “Easy fit” as a tool program of Kolmogorov-Smirnov testing proof for separated whole raisin depicted that the Weibull distribution has better fit than Normal distribution. The main parameters to give the empirical models for each dimensions for Normal and Weibull distributions obtained from mentioned tool program has been showed in table 2. Graphically comparing Normal and Weibull distributions of length and width dimensions by using Matlab (R2006 a) has been monitored in Fig.1 and Fig.2. Table 1: Physical properties of whole and demolished raisin berries at 16% (d.b) moisture content. CIGR XVIIth World Congress – Québec City, Canada – June 13-17, 2010
4
Characteristics
Number of replication
Physical value
Standard deviation
Mean
Min
Max
Whole raisin berries Major diameter (mm)
110
12.45
6.4
16.36
2.03
Intermediate diameter (mm) Minor diameter (mm) Geometric mean Sphericity (%) Projected area(mm2) Surface area (mm2) Volume ( mm3) Mass (g) Bulk density ( kg/m3 ) True density ( kg/m3) Porosity (%)
110 110 110 110 110 110 110 110 10 10 10
9.59 6.93 9.35 75.67 70.08 280.05 454.23 0.521 763.23 1306.36 41.53
5.36 4.01 6.33 60.24 31.53 126.13 133.24
14.16 10.38 12.37 99.03 120.26 481.05 992.38
0.21 755.45
1.05 771.25
1251.41 39.81
1342.86 43.03
1.5 1.26 1.32 6.35 19.08 76.51 140.1 0.18 11.25 19.84 2.01
110 110 110 110 110 110 110 110 110 10 10 10
8.6 5.34 2.88 5.03 58.53 20.71 82.87 75.01 0.228 592.41 1181.67 50.61
3.91 2.06 1.09 2.51 34.71 4.94 19.79 8.28
9.86 8.67 4.89 7.39 76.72 42.93 171.74 41.53
0.02 585.35
0.42 601.73
1168.37 49.12
1218.71 51.78
Demolished raisin berries Major diameter (mm) Intermediate diameter (mm) Minor diameter (mm) Geometric mean Sphericity (%) Projected area(mm2) Surface area (mm2) Volume ( mm3) Mass (g) Bulk density ( kg/m3 ) True density ( kg/m3) Porosity (%)
1.2 1.37 0.96 1.04 9.13 8.06 32.24 41.53 0.11 6.43 12.13 2.6
Table. 2: The Weibull and Normal parameters. Dimention Alfa Length 7.13 Width 3.79
Beta 13 5.72
CIGR XVIIth World Congress – Québec City, Canada – June 13-17, 2010
Gama 0.28 4.41
5
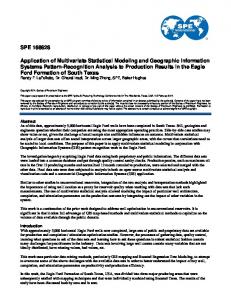
Figure 1. Histogram of whole raisin berries probability density function for length dimension comparing its fitting behavior between normal and Weibull (3P) distribution (at the 16% moisture content).
Figure 2. Histogram of whole raisin berries probability density function for width dimension comparing its fitting behavior between normal and Weibull distribution (at the 16% moisture content). Cumulative Weibull distribution by using its cumulative function for each of the length and width dimensions is: (8) (9)
CIGR XVIIth World Congress – Québec City, Canada – June 13-17, 2010
6
Cumulative frequencies, cumulative Weibull distribution and cumulative normal distribution in terms of length ( ) and width ( ) of raisin berries by using intervals of 1 mm, comparatively, has been showed in Table 3. Table 3. Cumulative frequency and cumulative Weibull in comparing with cumulative Normal distributions for length and width. Length (mm) 6.4 7.4 8.4 9.4 10.4 11.4 12.4 13.4 14.4 15.4 16.4
Cumulative frequency 1 1 4 9 19 31 46 77 91 101 110
Cumulative Weibull Distribution 0.46 1.35 3.42 7.67 15.43 27.98 45.48 65.62 83.51 94.69 99.02
Cumulative Normal Distribution 0.14 0.64 2.3 6.64 15.62 30.25 49.01 68.01 83.16 92.69 97.41
Width (mm)
Cumulative frequency
5.36 6.36 7.36 8.36 9.36 10.36 11.36 12.36 13.36 14.36 -
1 1 12 22 48 76 97 107 109 110 -
Cumulative Weibull Distribution 0.11 1.67 7.80 21.79 43.90 68.68 87.65 96.92 99.57 99.97 -
Cumulative Normal Distribution 0.23 1.53 6.76 20.42 43.64 69.38 87.96 96.71 99.39 99.92 -
Figure 3. Bivariable cumulative distribution function, for whole raisin berries at 16% (d.b) moisture content. By using equations 10 and 11, model with nonlinear equations including both variables is written as cumulative distribution function as follows (Rojano et al., 2004):
CIGR XVIIth World Congress – Québec City, Canada – June 13-17, 2010
7
F (l, w) = f (l)×f (w)
F(l,w)=(1-eb)(1-ec)
(10)
or, F(l,w) = 1.9615 × (m. n. eb. ec)
(11)
Where, (12)
The results of equation 11 by using data of table3 have been observed graphically in Fig. 3. These results are beneficial in: selecting machinery, designing, validating and determining the holes sizes of raisin berries classifiers. The average dimensions of whole raisin berries at a moisture content of 16% were 12.45 mm, 9.59 mm and 6.3 mm for length, width and thickness respectively. On the other hand, the average dimensions of demolished raisin berries were 8.6 mm, 5.34 mm, and 2.88mm for length, width and thickness respectively. By considering this difference and overlapping between dimensions of demolished and whole raisin berries, it can be ameliorative way to apply bivariable model for demolished and whole raisin berries, simultaneously. This subject has been observed graphically in figures 4 and 5. As showed in figures 4 and 5 by using bivariable model for each dimension of length and width for both whole and demolished raisin berries overlapping between these dimensions decreased until 11 and 4% respectively for length and width. The results of these graphs can be useful in the separation systems.
Figure 4. Bivariable cumulative distribution function, for whole and demolished raisin berries by denoting length and width variables at 16% db. CIGR XVIIth World Congress – Québec City, Canada – June 13-17, 2010
8
Figure 5. Bivariable cumulative distribution function, for whole and demolished raisin berries by denoting length and thickness variables at 16% (d.b) moisture content. The average mass of the whole raisin berries was 0.521 g in the range of 0.21 g to 1.05 g. On the other hand, the average mass of the demolished raisin berries was 0.228 g in the range of 0.02 g to 0.42 g. Figure 6, show frequency distribution of mass for demolished and whole berries simultaneously.
Figure 6. Frequency distribution for mass of berries at 16% (d.b) moisture content. Demolished berries (×) and Whole berries (+). The geometric mean diameters of the whole and demolished raisin berries were found to be 9.35 (mm) and 5.03(mm), respectively. Sphericity index of 75.66% for whole raisin berries indicates that the shapes of these berries tend toward a sphere for analytical calculations, and also these CIGR XVIIth World Congress – Québec City, Canada – June 13-17, 2010
9
berries can easily to roll. But 54.53% sphericity index for demolished raisin berries shows that these berries are far from the shape of a sphere, hence, these berries slide on their flat surfaces. Surface area and projected area of the whole raisin berries were measured to be 280.07 (mm2), 70.01 (mm2) respectively, whiles for demolished raisin berries were found to be 82.87 (mm2) and 20.71 (mm2), respectively. Also, the mean values of volume for whole and demolished raisin berries were found to be 454.23 and 75.01 (mm3), respectively. The differences between the average of surface, projected areas and volume of the whole and demolished berries should be noticed in the handling and processing of berries, in the evaluation of their quality and in calculating or predicting other properties of berries. As well as, volume and geometric mean diameter difference between whole and demolished raisin berries prove that in the separation process or in the sieving process, the demolished berries will drop through aperture early and easily, because of their low volume and low geometric mean diameter in compared with whole raisin berries. The coefficient of correlation shows that the L/W, L/T, L/Dg, L/V, L/Ø, L/S and L/M ratios are highly significant (at the level of 1%). This indicates that width, thickness, geometric mean diameter, volume, sphericity, surface area and mass are closely related to length of the berries (Table 4). Table 4. Some dimensional characteristics ratios of the whole berries at 16% (d.b) Particulars
Ratio
L/W
1.30
coefficient correlation 0.054
L/T
1.82
0.031
L/ Dg
1.33
0.054
L/Ø
0.17
0.279
L/S
0.04
0.272
L/V
0.03
0.296
L/M
25.28
0.425
The relationship between the length (L) and all other dimensions (W, T, Dg, Vellip and S) for whole berries can be represented by the following equation: L = 8.799 – 0. 921W – 1.51T + 1.51 Dg – 0.012Vellip+ 0.058 S
(R2 = 0.995)
(13)
CONCLUSION The size and mass frequency distributions of raisins were statistically analyzed by Normal and three-parameter Weibull distributions. The goodness of fit of the models was evaluated by means of Kolmogorov-Smirnov statistical test. A high degree of randomness was observed for length, width and of whole berries and damaged berries. The mass of whole and damaged berries also showed a high degree of variability. The Weibull distribution was found to be relevant for modeling the probability distribution of size parameters of whole and damaged raisins. CIGR XVIIth World Congress – Québec City, Canada – June 13-17, 2010
10
REFERENCES Corzo, O., N. Bracho, , A. Pereira and A. Va’squez, 2008. Weibull distribution for modeling air drying of coroba slices. LWT - Food Science and Technology. 41, 2023-2028. Hauhouot-O’Hara M., Criner, B.R., Brusewitz, G.. H. and Solie J. B. July 2000. “Selected physical characteristics and aerodynamic properties of cheat seed for the separation from wheat”. Agricultural Engineering International: the CIGR Journal of Scientific Research and Development. Vol. II. Karadeniz, F., R.W. Durst, and, R.E. Wrolstad. 2000. Polyphenolic composition of raisins, J. Agric. Food Chem. 48, 5343–5350. Karathanos, V.T., T., Karanikolas, A.E., Kostaropoulos and, G..D. Saravacos, 1995. Non enzymatic browning in air-drying of washed raisins. Developments in Food Science, 37, 1057-1064. Karathanos , V. T., , T. Karanikolas, A.E. Kostaropoulos and G.. D. Saravacos. 1994. Viscoelastic Properties of Raisins. Jorrrnul of Food Engineering, 23, 481- 490. Kim, Y., S. R. Hertzler, H. K. Byrne and C. O. Mattern. 2008. Raisins are a low to moderate glycemic index food with a correspondingly low insulin index. Nutrition Research, 28, 304–308. Kostaropoulos, A.E., J. Mandala, W.E.L. Spiess and G.D. Saravacos. 1997. Factors Influencing the Friction of Raisins during Processing and Handling. Journal of Food Engineering, 33, 385 - 393. Lewicki, P. P. and W. E. L. Spiess. 1995. Rheologicai Properties of Raisins Part I. Compression Test. Journal of Food Engineering, 24, 321-338. Lewicki, P. P. and W. Wolf. 1995. Rheologicai Properties of Raisins. Part I. Effect of Water Activity. Journal of Food Engineering, 26, 29-43. Mandala, I.G. and M. Daouaher. 2004. Effect of addition of low sugar raisin (LSR) on Physical properties of cakes during storage. Journal of Food Process Engineering, 27, 229-245. Mohsenin, N. N. 1970. Physical Properties of Plant and Animal Materials. Vol. I. Physical Characteristics, and Mechanical Properties. New York: Gordon and Breach. Mondy, N., B. Charrier, M. Fermaud, P. Pracrosand M. F. Corio-Coste. 1998. Mutualism between a phytopathogenic fungus (Botrytis cinerea) and a vineyard pest (Lobe& botrana). Positive effects on insect development and oviposition behavior. C. R. Acad. Sci. Paris. Sciences de la vie / Life Sciences. 321, 5-671. Pateraki, M., A. Dekanea, D. Mitchell, D. Lydakis and N. Magan. 2007. Influence of sulphur dioxide, controlled atmospheres and water availability on in vitro germination, growth and ochratoxin A production by strains of Aspergillus carbonarius isolated from grapes. Postharvest Biology and Technology, 44, 141–149. Pearson, R. C. and A. C. Goheen. 1988. Compendium of Grape Diseases. The American Phytopathological Sosiety. Rashidi, M. and K. Seyfi, 2008. Modeling of kiwifruit mass based on outer dimensions and projected areas. Americam-Eurasian J. Agric. & Environ. Sci., 3, 26-29. Rojano A., R. Salazar and R. Galicia. 2004. Oat Characterization by Means of Weibull Distribution. Presented at the 1 - 4 August 2004 and 2004 ASAE/CSAE Annual International Meeting, Paper No. 047010. ASAE, 2950 Niles Road, St. Joseph, MI 49085-9659 USA. Vagenas, G. K., D. Marinos-Kowis and G. D. Saravacos. 1990. Thermal properties of raisins. Journal of Food Engineering, 11, 147-158. Voicu, G.H., T., Casandroiu, and C. Tarcolea. 2008. Testing stochastic models for simulating the seeds separation process on the sieves of a cleaning system, and a comparison with experimental data. Agriculturae Conspectus Scientificus, 73, 95-101. CIGR XVIIth World Congress – Québec City, Canada – June 13-17, 2010
11