paper presents an experimental analysis of transaction logs from a real-life IT support organization, provided to us by the. Outsourcing Services Division of HP.
Modeling IT Support Organizations from Transactional Logs Claudio Bartolini, Member, IEEE, Cesare Stefanelli, Member, IEEE, and Mauro Tortonesi
Abstract—There is great interest in building an accurate theoretical model of IT support organizations, for several purposes such as optimal workforce allocation and what-if scenario analysis. However, the complexity of real-life IT support organizations makes it extremely hard to model their organizational, structural and behavioral processes. While the adoption of stationary stochastic processes to model incident arrivals and of first-come-first-served GI/G/N queues to model support groups permits to reproduce with good enough fidelity the organization-wide behavior, this approach does not always accurately capture the internal dynamics of the organization. This paper presents an experimental analysis of transaction logs from a real-life IT support organization, provided to us by the Outsourcing Services Division of HP. The statistical analysis of transactional logs allows us to make some interesting considerations that can be used to build a more accurate model of the organization, as well as to gain useful experience in the modeling process. Index Terms—Business-driven IT management (BDIM), Information Technology Infrastructure Library (ITIL), IT service management, incident management.
I. INTRODUCTION
I
Tsupport organizations have a primary role in IT service management. Among other things, they are in charge of incident management, which ITIL defines as the process for restoring normal service operation after a disruption [1]. Reallife IT support organizations usually implement very complex organizational, structural, and behavioral processes according to the strategic objectives defined at the business management level. There is a great interest in building an accurate theoretical model of IT support organizations, for several purposes such as optimal workforce allocation [2] or shift scheduling to guarantee a low maximum waiting time [3]. In this context, a particularly interesting application scenario is the modeling of IT support organization for what-if scenario analysis. What-if scenario analysis is a technique based on the construction of an accurate model of the system under evaluation and on its exploitation to reenact the system behavior with modified parameters. When applied to IT support organizations, what-if scenario analysis allows to evaluate alternative incident management strategies before
c 978-1-4244-5367-2/10/$26.00 �2010 IEEE
putting them in practice, a process which is very expensive and time-consuming. In our previous work, we have developed SYMIAN, a decision support tool for the performance analysis and optimization of the incident management function in IT support organizations allowing what-if scenario analysis. SYMIAN re-enacts the behavior of IT support organizations through an open queuing network model and discrete event simulation [4]. SYMIAN has been used to enable the optimization of IT support organizations according to both performance-driven [5] and business impact-driven criteria [6]. During our experiments with SYMIAN, we have been able to reproduce with good enough fidelity the aggregated behavior of real-life IT support organizations using a stationary Poisson process to model incident arrivals and firstcome-first-served GI/G/N queues to model support groups [5]. However, while SYMIAN’s fidelity is acceptable at a first order approximation, some minor aspects of the IT support organizations such as queue lengths, and sojourn time (the time an incident resides at a specific support group, including waiting and service time) distribution, were not always accurately reproduced. In order to take our simulation-based approach to the next level, there are still many questions left open, and addressing them will allow us to further improve the performance of IT support organizations. In particular, the most interesting questions that we think should be considered are: 1. A simplifying assumption we made in SYMIAN was to use stationary stochastic models for the processes under study. However, some of these processes are inherently time-varying. What gain would we achieve if we modeled non-stationary behaviors for the processes of incident arrival, incident routing, and incident servicing at each visited support group? 2. Another simplifying assumption of SYMIAN was that optimizing the behavior of single support groups would improve the overall performance of the whole IT support organization. Do we need to introduce a model that allows for organization-wide performance optimization rather than optimizing locally at selected support groups? 3. Can we infer some information on the severity of incidents from their routing, and use it to drive the prioritization of incidents?
256
4.
How can we derive a more accurate approximation of the incident arrival process? 5. Group dynamics are usually more complex than firstcome-first-served GI/G/N queues. Can we build a model of support groups that captures their dynamics better than that? These are the questions that this paper tries to answer. In order to answer them, it is necessary to gather additional insights on the behavior of real-life IT support organizations. This paper presents an experimental analysis of transaction logs from a real-life IT support organization, provided to us by the Outsourcing Services Division of HP. HP Outsourcing manages, among other IT services, the Help Desk function on behalf of various enterprise customers. The data used for this experiment comes from the subset of the organization serving a single enterprise customer from the financial services industry, whose name will be disguised as BailUsOut in the remainder of the paper. The statistical analysis of transactional logs from the BailUsOut IT support organization allows us to make some interesting considerations. While the BailUsOut IT support organization might not be representative of every IT support organization, the lessons learned from its analysis are very important. In fact, they allow us to build a more accurate model of the organization with SYMIAN, as well as to gain useful experience in the modeling process. The rest of the paper is as follows. Section II describes the working of IT support organizations. Section III provides an in-depth analysis of the BailUsOut IT support organization transactional logs, aiming at answering the open questions laid out in this introduction. The section covers system evolution (III.A), support group workload (III.B), incident routing (III.C), incident arrival (III.D) and incident sojourn times (III.E). Section IV presents an overview of related work. Finally, Section V provides concluding remarks. II. IT SUPPORT ORGANIZATIONS IT support organizations are typically composed of a network of support groups, each comprising of a set of operators, with their work schedule. Support groups are divided into support levels (usually three to five), with lower level groups dealing with generic issues and higher level groups handling technical and time-consuming tasks. Support groups are further specialized by category of incidents that they deal with (network, server, etc…) and usually organized by geography, to ensure prompt incident response. The Help Desk represents the interface for customers reporting an IT service disruption. In response to a customer request, the Help Desk “opens” an incident, sometimes also called trouble-ticket or simply ticket. The incident is then “assigned” to a specific support group. This group’s technicians either fully repair the incident or “reassign” it to a different support group (usually escalating to a higher support level). As a result, an incident goes through different states and is
handled by different support groups throughout its lifetime. At each of these steps, the incident record is updated with the pertinent information, such as current state and related service restoration activity. If, for some reason, customers request the organization to stop working on the incident, the incident is placed in a “suspended” state to avoid incurring into Service Level Objective penalties. Once the disruption is repaired, the ticket is placed in “closed” state until the end-user confirms that the service has been fully restored. In this case, the incident is “resolved” and its lifecycle ends. The characteristics of IT support organizations suggest to model them as open queuing networks [7], as it is done for telephone call centers [8] [2]. However, IT support organizations have some peculiar characteristics that distinguish them from telephone call centers. In fact, in IT support organizations there is no need to consider call blockings, abandonments, or redials. In addition, there is the need to consider complex incident prioritization policies since IT support organizations might serve many customers, each one with a specific SLA. III. ANALYSIS OF THE BAILUSOUT TRANSACTIONAL LOGS This section presents the analysis of the transactional logs for the BailUsOut IT support organization, run by the Outsourcing Services Division of HP. Having a global 24/7 presence, HP Outsourcing faces the daily challenge of supporting multiple environments for multiple customers in disparate geographies. Hundreds of support groups employing thousands of engineers provide support to clients all around the world. In particular, 34 support groups are dedicated to BailUsOut, and 38 more groups have shared responsibilities across multiple enterprise customers and deal with tickets generated by BailUsOut. These support groups are geographically distributed and each work in their own local time-zone. We were able to obtain database logs of incidents for a 377day period, consisting of data for slightly less than 25,000 incidents. For each incident, the data carried transactional information about the arrival and departure times at each visited support group. We mined the data to begin to answer the open questions laid out in the introduction, and in this section we report our findings. A. Inherently Non-Stationary System Behavior and its Evolution over Time •
What gain would we achieve if we modeled nonstationary behaviors for the processes of incident arrival, incident routing, and incident servicing at each visited support group? To answer this question, we evaluated the non-stationary behavior for the processes of incident arrival, incident routing, and incident servicing at each visited support group. To this end, we analyzed how the organization behavior evolves over the 377 days under consideration. We started from the incident arrival process. As Fig. 1 demonstrates, the number of arrived incidents grows slowly
2010 IEEE/IFIP Network Operations and Management Symposium - NOMS 2010
257
over the first six months and then it increases steeply. This probably reflects the fact that the BailUsOut IT support organization went from a “pre-production evaluation” phase to a fully fledged “production” phase. Notice that the abrupt decrease in incident arrivals in the last two weeks in Fig. 1 is due to the fact that that period corresponds to the Christmas holidays. Like the incident arrival process, the time to incident resolution is also a non-stationary process. In fact, as one can see, the BailUsOut IT support organization performance increases over time. This is clearly visible in Fig. 2, which plots the average time from arrival to resolution for the set of incidents arrived in each of the weeks under examination.
Fig. 2. Average time to incident resolution, calculated on a weekly basis.
Fig. 1. Incident arrivals, on a weekly basis.
The routing process also changes over time. Fig. 3 demonstrates how the average number of support groups visited by the incidents decreases significantly in the last six months of the dataset. In addition, when the system enters in the “production” phase the oscillations become much smaller, but still noticeable. This might be caused by the fact that the organization “learns” how to deal with tickets. The different enterprise-wide behavior between the first and the second six month period was the most immediately apparent, but not the only non-stationary behavior that we observed. While the average time for incident resolution remains almost constant in the last six months, its distribution changes in time. This is clearly visible in Fig. 4, showing a comparison of arrival and time to resolution for every incident examined. As one can see, the maximum time to incident resolution decreases as time goes by, indicating that the organization-wide performance improves. From this analysis, we can conclude that it’s not possible to accurately reproduce the system behavior over the entire 12month period covered by the dataset considering only stationary stochastic processes.
258
Fig. 3. Average number of visited support groups, on a weekly basis.
If the interest is only to reproduce the organization in the “production” stage, then considering stationary stochastic processes whose parameters are inferred by the analysis of the last six months of the dataset can lead to a good approximation. For higher-order model accuracy of the organization behavior in the “production” stage, which also considers the observed performance increase over time, or in case one wants to reproduce the system evolution from the beginning of the dataset, the modeling becomes much more complicated. In this case, it is necessary to adopt a piecewise-stationary model, by dividing the dataset in smaller timeframes where the system exhibits quasi-stationary behavior. Each timeframe should be then be analyzed to infer model parameters. Finally, the obtained values should be used to build stochastic processes with time-varying intensities that capture the system behavior with more accuracy.
2010 IEEE/IFIP Network Operations and Management Symposium - NOMS 2010
Fig. 4. Comparison of incident arrival times versus time for resolution.
Fig. 5. Incidents processed by each support group.
Since we are interested in modeling the system behavior when it is in production, in the rest of this section we consider only incidents from week 28 to week 52. B. Support Group Workloads •
Do we need to introduce a model that allows for organization-wide performance optimization rather than optimizing locally at selected support groups? To answer this question, we looked for emerging properties at the organization-wide level by studying support group workloads. The first observation is that the number of incidents processed per support group is highly uneven (Fig. 5). Support groups 22, 39, and 30 deal with the largest portion of incidents, while many other support groups work on a much smaller portion of incidents. To make progress towards a more complete picture of the organization dynamics, we need to correlate the volume of incidents processed with the amount of work spent on each incident (Fig. 6). The aggregate of sojourn times is a rough indicator of the workload that each support group has to deal with. Now let us consider how the workload evolves over time. Fig. 7 shows the evolution of workload for support group 22, represented as the number of incidents transiting in the support group.
Fig. 6. Total sojourn time for each support group.
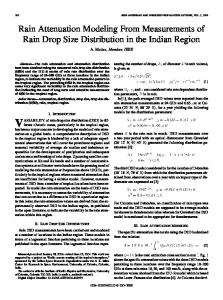
It is also worth examining the connections between different support groups. Fig. 8 shows a visual representation of the escalation matrix. Each element eij of the escalation matrix represents the number of incidents forwarded from support group gi to support group gj. To consider the interactions of IT support organization with the outside world (arrival and departure of incidents), we have added an extra virtual support group “In/Out” to the escalation matrix.
2010 IEEE/IFIP Network Operations and Management Symposium - NOMS 2010
259
The highly uneven workload distribution and fan-in/fan-out, as well as the fact that the incident arrivals and closures at the main support groups of the BailUsOut IT support organization are much larger than the number of escalations from or to other support groups, suggests that the local optimization might be a very effective method to improve the performance of the BailUsOut IT support organization. In fact, we have simulated the BailUsOut IT support organization with SYMIAN, and we have been able to significantly improve the organization performance by simply increasing the operator effectiveness at support group 22 by 3%, emulating an improvement in operator performance that could be obtained in real life by re-training technicians [5]. In particular, the BailUsOut IT support organization exhibited a 1.6% improvement of the average number of incidents closed daily and a 6.3% decrease of the average time to incident resolution. Fig. 7. Evolution of workload for support group 22, represented as the number of incidents transiting in the support group.
Fig. 9. Fan in and fan out of support groups. Fig. 8. Visual representation of the incident escalation matrix.
As one can see by examining the peeks along the bottom right edge of the plane, representing escalations from the “In/Out” support group (incident arrivals), there is not a unique entry point into the system, but several entry points. This means that the BailUsOut IT support organization does not have a single centralized Help Desk, and that probably provides only higher support levels. In the same way, the peeks along the upper right edge, representing escalations to the “In/Out” support group (incident closures), mean that there are several support groups closing incidents. Fig. 9 provides additional information about the connections between support groups. More specifically, it shows fan-in and fan-out for each support group, defined as the number of support groups with non-zero incoming and outgoing incident escalations respectively. Fan-in and fan-out represent the centrality of the support group in the organization. IT support organizations are more sensitive to performance issues in central support groups than to those in peripheral ones.
260
However, this does not allow us to conclude that the connections between support groups are negligible and can therefore be ignored. On the contrary, in our experiments with the simulated version of the BailUsOut IT support organization in SYMIAN, we have found that support groups are tightly interconnected and that modifying the behavior of support groups – even relatively small ones – might have a relatively large negative impact on the whole system behavior. As a result, we expect that local optimization might not be a very effective practice in IT support organizations with strongly interconnected support groups and an even distribution of workload. In this case, there is the need to adopt different optimization strategies, that also consider the relationships between the different support groups. C. Incident Routing •
Can we infer some information on the severity of incidents from their routing, and use it to drive the prioritization of incidents? To answer this question we analyzed the routing of incidents through the BailUsOut IT support organization. For the
2010 IEEE/IFIP Network Operations and Management Symposium - NOMS 2010
purpose of this paper, we define a route as the sequence of support groups visited by the incident from its arrival to its closure. We also consider the position of a specific support group in the sequence as significant information. As a result, route 1-2-3 differs from both route 1-3-2 and route 1-2-3-2-3. Analyzing transactional logs, we have found 2431 different routes. Fig. 10 shows the frequency of each route.
that we have analyzed in a previous work [9], where some of the incidents got hopped over 10 times, and a few up to 65 times. In order to verify if it’s possible to discriminate between incidents representing minor and major service disruption according to their routing through the IT support organization, we have divided incidents in two subsets. The first subset represents “slow” incidents, that is the 20% of incidents with a larger transit times. The other subset represents “fast” incidents, or incidents with transit times smaller than the 80percentile threshold. We have also considered the 90percentile as a threshold between “fast” and “slow” incidents, but found no significant changes with respect to the 80percentile threshold. Fig. 12 shows the relative frequency distribution of each route, separately considering “slow” and “fast” routes.
Fig. 10. Frequency of routes.
Consistently with the results obtained from the support group workload analysis, the frequency of routes is highly uneven. The 5 most common routes (22, 39, 30, 14, 32) account for 58.6% of the total. We have also analyzed the number of hops (visited support groups for each route). Fig. 11 shows a histogram representing the distribution of the numbers of support groups visited by each incident.
Fig. 12. Frequency of “fast” and “slow” routes.
While their distribution is almost identical, and the most frequent slow routes and the most frequent fast routes are almost the same, the relative frequency differs, as shown by Table I. TABLE I. RELATIVE FREQUENCY OF MOST FREQUENT “SLOW” AND “FAST” ROUTES.
Fig. 11. Histogram of visited support groups per incident.
As one can see, the routing process in the BailUsOut IT support organization is very simple. Most of the incidents (63.9%) visit a single support group, and only a minority of them (6.6%) visit five support groups or more. This is in contast with the data from the Skies-IT real-life organization
Slow route 22 39 30 14 17-22-23 50-22 23-40-13-23 32 23 39-22
Frequency 9.24% 7.92% 7.16% 3.45% 2.93% 2.67% 2.39% 2.14% 1.74% 1.42%
Fast route 22 39 30 14 32 50-22-25 18 17-39 19-39 50-22
Frequency 27.90% 12.23% 10.11% 9.75% 5.80% 1.42% 1.32% 1.09% 1.02% 1.00%
From the analysis it can be seen that there is no obvious way to discriminate between “fast” and “slow” incidents according to their arrival times, routes, or other aspects. As a result, there is limited space for prediction of critically
2010 IEEE/IFIP Network Operations and Management Symposium - NOMS 2010
261
important incident attributes such as future required work or significance based on the routes the incidents follow. D. Incident Arrival Process •
How can we derive a more accurate approximation of the incident arrival process? An accurate modeling of the incident arrival process is of critical importance for realistic simulations. In fact, to ensure a realistic input for the simulation, one possibility is to re-enact incident traces from real IT support organizations. However, considering only real incident traces would limit the applicability of the simulative approach to a small set of predefined input, thus preventing its use to verify how the modeled organization would behave under heavy incident load or a specific inter-arrival pattern. As a result, there is the need to consider synthetic incident generation according to configurable stochastic patterns, possibly reproducing the behavior of real customer service reports. To find how can we accurately reproduce the incident arrival process, we analyzed interarrival times at the BailUsOut IT support organization. Fig. 13 shows a histogram that represents the interarrival time distribution for incidents. As one can see, most of the incident interarrival times are in the order of one minute, but some of them are very high. Indeed, the interarrival time distribution is L-shaped, with a long tail. We were not able to match it against any common distribution function, although we have found that power law distributions, such as the general Pareto distribution, represent a rather close approximation.
Finally, we found that there is no correlation between the incident arrival times and the incident severities or routes. E. Incident Time-To-Resolution and Sojourn Times •
Can we build a model of support groups that captures their dynamics better than first-come-firstserved GI/G/N queues? To answer this question we analyzed incident sojourn times. Sojourn time is the time an incident resides at a specific support group, including waiting and service times. Notice that our analysis is limited to considering sojourn times because the data we obtained is only timestamped with arrival and departure of each incident at each support groups it visited, and therefore does not help us discriminate between waiting and service times. Fig. 14 shows a histogram that represents the distribution of time from arrival to resolution for incidents. Most of the incidents have low time to resolution, but there is a small minority of incidents that require a very long time before closure. As with interarrival times, we were not able to associate the values of times from incident arrival to resolution to a known distribution function, although once again, we found that power law distributions may provide sufficient approximation.
Fig. 14. Histogram of time from incident arrival to resolution.
Fig. 13. Histogram of interarrival times.
The fact that the condition of the enterprise as a system changed overtime explains why we couldn’t find parametric density estimation for interarrival and sojourn times. This might suggest that the incident arrival process could be more appropriately modeled using stochastic processes with timevarying intensities, such as non-homogeneous Poisson processes [10] or Poisson-Gamma processes [11], which are often proposed for similar applications.
262
To gather some insights on the processing of incidents, we examined sojourn times at the single support group level. Fig. 15 shows a comparison of arrival and sojourn times for the incidents visiting one particular support group (group 22). Incidents arriving at about the same time can have very different sojourn times. This means that that incident are processed in parallel, instead of in a sequential fashion, and suggests that support group may be better modeled as multiple priority queues [12]. In addition, processor sharing queues might also be exploited to model support groups in which operators work on several tickets at the same time. However, inferring the behavior of multiserver and multipriority queues from transactional data is a very complex task which requires future research.
2010 IEEE/IFIP Network Operations and Management Symposium - NOMS 2010
support organizations can reproduce their functioning with good fidelity. However, we show here that the behavior of the organization as a system can exhibit important non-stationary aspects (see section III.A, III.D and III.E), and we see this as a call to orientate our next steps for improving our simulationbased approach. We also demonstrate that while optimizing locally at the single support group (à la SYMIAN) can provide a good first order improvement in the organizational processes, studying emerging properties at the enterprise-wide level is important (see section III.B), and this also is an important future direction for our work. Our analysis also shows that approaches aimed at optimizing incident routing can easily be too optimistic and naïve, given that the routes the incidents follow appear to have no bearing on attributes such as their severity or criticality (section III.C). REFERENCES Fig. 15. Comparison of arrival and sojourn times at support group 22.
[1]
IV. RELATED WORK
[2]
The academic literature reports of extensive research on queuing models for support organizations. For a representative example, see [8] [2]. Most of the research has focused on telephone call centers. Two particularly interesting papers in this category are references [10] and [11], which perform an analysis of real-life telephone call center transaction logs and observe nonstationary behaviors in the arrival process that are similar to the ones exhibited by the BailUsOut IT support organization. Only recently have researchers started focusing on IT support organizations. See for example the work by Wasserkrug et al. [3], which focuses on shift scheduling for IT support personnel and reports on the inadequacy of M/M/N queues to model support groups. The EasyTicket system represents another interesting work [13], which aims at optimizing the ticket routing in IT support organizations by applying machine learning techniques to the routing history of the incidents. However, we have shown in section III.C that this approach might not always be applicable in practice. To the best of our knowledge, there are no other papers that examine transactional data to draw conclusions on modeling IT support organizations.
[3]
[4]
[5]
[6]
[7]
[8]
[9]
[10]
V. CONCLUSION AND PLANS FOR FUTURE WORK At the beginning of the paper we have formulated several questions that need to be answered in order to improve our knowledge of IT support organizations. The extensive analysis of transactional logs that we carried out and presented in this paper produced valuable information aimed at improving the accuracy of our models of IT support organizations, which we use to lay out plans for our future work. In particular, our analysis demonstrates that our SYMIAN decision support tool’s first-order approximation of real-life IT
[11]
[12]
[13]
IT Infrastructure Library, “ITIL Service Delivery” and “ITIL Service Support”, Office of Government Commerce, UK, 2003. G. Koole, “Call Center Mathematics”, available at: http://www.math.vu.nl/~koole/ccmath/, accessed on September 10th 2009. S. Wasserkrug, S. Taub, S. Zeltyn, D. Gilat, V. Lipets, Z. Feldman, A. Mandelbaum, “Creating operational shift schedules for third-level IT support: challenges, models and case study”, International Journal of Services Operations and Informatics, Vol. 3, No. 3-4, pp. 242-257, 19 November 2008. C. Bartolini, C. Stefanelli, M. Tortonesi, “SYMIAN: a Simulation Tool for the Optimization of the IT Incident Management Process”, in Proceedings of 19th IFIP/IEEE International Workshop on Distributed Systems: Operations and Management (DSOM 2008), Samos Island, Greece, 25-26 September 2008. C. Bartolini, C. Stefanelli, M. Tortonesi, “SYMIAN: Analysis and Performance Improvement of the IT Incident Management Process”, submitted for publication. C. Bartolini, C. Stefanelli, M. Tortonesi, “Business-impact analysis and simulation of critical incidents in IT service management”, in Proceedings of 11th IFIP/IEEE International Symposium on Integrated Network Management (IM 2009), Long Island, NY, USA, 1-5 June 2009. G. Bolch, S. Greiner, H. de Meer, K. Trivedi, “Queuing Networks and Markov Chains: Modeling and Performance Evaluation with Computer Science Applications”, 2nd Edition, Wiley 2006. G. Koole, A. Mandelbaum, “Queueing Models of Call Centers: An Introduction”, Annals of Operations Research, Vol. 113, No. 1-4, pp. 41-59, July 2002. M. Tortonesi, C. Stefanelli, C. Bartolini, G. Barash, L. Fradin, “Optimizing the IT incident management process: a simulation-based tool”, in Proceedings of 15th Annual Workshop of HP Software University Association (HP-SUA 2008), Marrakech, Morocco, 22-25 June 2008. S. Zeltyn, Z. Feldman, S. Wasserkrug, “Waiting and sojourn times in a multi-server queue with mixed priorities”, Queueing Systems, Vol. 61, No. 4, pp. 305-328, April 2009. L. Brown, N. Gans, A. Mandelbaum, A. Sakov, H. Shen, S. Zeltyn, L. Zhao, “Statistical Analysis of a Telephone Call Center: A QueueingScience Perspective”, Journal of the American Statistical Association, Vol. 100, No. 469, Applications and Case Studies, March 2005. J. Pichitlamken, A. Deslauriers, P. L’Ecuyer, A. Avramidis, “Modelling and Simulation of a Telephone Call Center”, in Proceedings of the 2003 Winter Simulation Conference (WSC 2003), New Orleans, LA, USA, 710 December 2003. Q. Shao, Y. Chen, S. Tao, X. Yan, N. Anerousis, “Efficient Ticket Routing by Resolution Sequence Mining”, in Proceedings of 14th ACM SIGKDD International Conference on Knowledge Discovery and Data Mining (KDD’08), Las Vegas, NV, USA, 24-27 August 2008.
2010 IEEE/IFIP Network Operations and Management Symposium - NOMS 2010
263