Alpert, C.J. and Tellez, G.E., âThe Importance of Routing. Congestion Analysis,â Knowledge center article of 47th. Design Auto. Conf., Anaheim, CA, Jun. 2010.
Modeling of Electromigration in Through-Silicon-Via Based 3D IC Jiwoo Pak1, Mohit Pathak2, Sung Kyu Lim2 and David Z. Pan1 1 ECE department, The University of Texas at Austin, Austin, TX 78712, U.S.A. 2 ECE department, Georgia Institute of Technology, Atlanta, GA 30318, U.S.A. {jiwoo, dpan}@cerc.utexas.edu, {mohitp, limsk}@ece.gatech.edu Abstract Electromigration (EM) is a critical problem for interconnect reliability of modern IC design, especially as the feature size becomes smaller. In 3D IC technology, the EM problem becomes more severe due to drastic dimension mismatches between metal wires, through-silicon-vias (TSVs), and landing pads. Meanwhile, the thermo-mechanical stress due to TSV can further interact with EM and shorten the lifetime of the structure. However, there is very little study on EM issues with respect to TSV for 3D ICs. In this paper, we perform detailed and systematic studies on: (1) EM lifetime modeling of TSV structure, (2) impact of TSV stress on EM lifetime of BEOL wires, and (3) EM-robust design guidelines for TSV-based 3D ICs. Our results show EMinduced lifetime of TSV structure and neighboring wire largely depend on the TSV-induced stress. Also, lifetime of a wire can vary significantly depending on the relative position with the nearby TSV. I. Introduction As semiconductor technologies are pushed forward for higher performance with smaller power and area, threedimensional integrated circuits (3D ICs) have attracted a lot of attention from both academia and industry. 3D ICs can be realized with stacked dies and through-silicon-vias (TSVs) to communicate vertically. 3D ICs can help increase the bandwidth by reducing the interconnect length, reduce the footprint of the system, and achieve heterogeneous integration of the system. However 3D ICs introduce many new challenges, in particular the reliability issues which have become more critical. The temperature characteristics of 3D ICs can be worse, additional stress can be generated due to the coefficient of thermal expansion (CTE) mismatch between TSV and silicon materials, and current density of the interconnects needs to be increased to feed more transistors in spite of high loading capacitance of TSVs. Electromigration (EM) has been one of the major reliability problems even in conventional 2D IC designs. EM refers to the mass transport in metal structures. It is affected by geometrical shapes, temperature distribution, mechanical stress, current density, and material properties [1,12-13]. As EM generates voids and hillocks, it would further affect the geometrical shapes of the metal structure, the current density, and the mechanical stress [1]. There are active studies to improve the EM reliability in 2D ICs, especially for metal wires, local vias between metal layers, bump metallization and solder joints [2-4, 10-13]. However in 3D ICs, despite of importance of EM which can shorten the lifetime of the system, only a few papers have been published regarding this issue. Shayan et al. considered mean time to failure (MTTF) due to the EM based on Black’s equation, for a power distribution network (PDN) for 3D ICs [8]. Trigg et al. demonstrated test chip for evaluation of 3D
978-1-61284-498-5/11/$26.00 ©2011 IEEE
packaging reliability including EM [6]. However, these two works are not based on the EM model of the TSV. Chen et al. showed EM model of the TSV structure with landing pads and copper cylinder, but did not consider the effect on the wires, which can be connected to the landing pad [5]. Tan et al. showed that a TSV may fail due to the thermo-mechanical stress and show the modeling of TSVs in the interposer [7]. These works provide initial basis for EM modeling of TSV. However, none of these works study the detailed EM modeling of the TSV including metal wires connected to the landing pad, neighboring wires near the TSV, or study the relationship between TSV sizing parameters and EM. In this paper, EM modeling with detailed TSV structure and neighboring metal wires is proposed. Our model includes materials such as interlayer dielectric (ILD), silicon dioxide and benzocyclobuten (BCB). In Section III, we investigate EM effect using the TSV model, including the TSV landing pads and metal wires connected to them. We look into the impact of mechanical stress gradients and current crowding on the EM-induced lifetime of TSV structure, and have experiments with various geometries of the TSV structure. In Section IV, impact of TSV-induced stress on lifetime of neighboring wires is studied. In 2D ICs, failure due to the EM likely appears at the boundary of the microstructure, e.g. at the end of the metal wire, if current density and temperature are remained same along the wire [2,10,12]. However in 3D ICs, we observe that failure can occur even in the middle of the wire depending on the thermo-mechanical stress effect. Also we show the failure can be either accelerated or delayed due to the TSV-induced stress gradient, and study the relationship with TSV radius and minimum distance from the TSV to achieve robustness. Based on the observation in Section III and IV, guidelines for EM-robust design for 3D ICs are suggested in Section V. II. Preliminaries Electromigration can be defined as the mass transport of atom [1-2]. Stress-migration can be used to specifically define stress-induced mass transportation of atoms. However, recently ‘electromigration’ is used as a general terminology for the mass transport of atoms, due to various driving forces such as, high current density, mechanical stress gradient, and temperature gradient [1,12-13]. In this paper, we use the term electromigration for referring to the general transport of material. Typically, change in atomic concentration in a metal structure can be expressed by the traditional mass balance equations [1]. ∙
0
(1) (2)
1420 2011 Electronic Components and Technology Conference
Here, is the total atomic flux, c is the atomic concentration with initial value c0, j is the current density, Q is the heat of transport, σ is the hydrostatic stress, and D is the diffusivity. Table 1 shows the nomenclature of various parameters and their values. Note that the local hydrostatic stress is a scalar value expressed as σ . Transport of atoms in a structure can induce back-stress and affect EM again [11]. The total hydrostatic stress can be expressed as the summation of EM-induced back-stress and the residual stress generated due to the CTE mismatch in a TSV structure [9,18]. Hydrostatic stress can be expressed as Equation 3, σ (3) σ σ and σ represent the TSV-induced and EMwhere σ induced hydrostatic stresses, respectively. Hydrostatic stress can also affect diffusivity D as shown in Equation 4. Parameters of the equation can be found in Table 1.
∙
Si
Table 1. Nomenclature of parameters and values Parameter Representation Value c0 Initial atomic concentration 1.53e28 D0 Initial diffusivity 1e-8 Ea Activation energy 1.3e-19 k Boltzmann’s constant 1.38e-23 T Temperature (K) 323 j Current density (A/m2) 1e10 Z Effective charge 4 e Electron charge 1.6e-19 Ω Atomic volume 1.6e-29
1um
BCB ILD
4.2um 0.2um
SiO2 M1 wire
(a)
TSV
Si
30um
1um
BCB
Landing Pad on M8
(4)
As EM is governed by multiple driving factors such as current density, stress, temperature and atomic concentration a finite-element-method (FEM) solver is used for estimating the transient atomic concentration. We build 3D models of various structures of the TSV and the wire based on Equation 1-4, using commercial FEM solver named COMSOL Multiphysics. Another tool named ANSYS is used to generate the TSV-induced stress. The stress values generated by ANSYS are transferred to COMSOL to obtain accurate results.
30um
Landing Pad on M1
0.2um
ILD
4.2um
Si
30um
M8 wire
M1 wire
M8 wire 4um
(b) 10um
0.8um
5um
10um
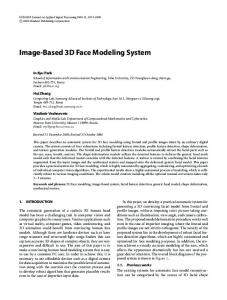
Figure 1. (a) Cross section of 3-die stacking structure with a Via-first TSV. (b) Top-down view of the TSV, landing pads and connected wires.
Figure 1(a) describes the TSV structure we used to simulate the thermo-mechanical stress due to the CTE mismatch. Properties of various materials used are shown in Table 2. We ignore the thin TSV liner around the TSV cylinder during stress calculation. By ignoring the TSV liner we can achieve faster runtime with little loss in accuracy. Table 2. Material properties of TSV structure CTE Elastic Module Poisson’s (GPa) Ratio (1/K) Silicon 162 0.28 3.05e-6 Copper 111.5 0.343 1.77e-5 Silicon Oxide 71.7 0.16 5.1e-7 ILD 9.5 0.3 2.0e-5 BCB 6.1 0.35 3.3e-5 Path 2
In 3D ICs, TSV-induced stress can significantly affect the atomic movement. Thus, the trend of EM-induced failure can be different as compared to 2D ICs. In the following sections we discuss in detail how TSV-induced stress can impact EM in various structures.
A Current
B
C
D
Path 1
III. EM modeling of TSV
E
III-1. TSV modeling for the Via-first structure In literature TSVs of various sizes have been proposed [7,9,18]. According to IMEC [17], Via-first approach can realize a TSV of diameter 5um. We assume TSV diameter as 4um, landing pad size as 5um × 5um, and thickness of silicon substrate as 30um. For the Via-first approach, the top landing pad of the TSV is connected to the first metal layer, while the bottom landing pad touches top metal layer. We also vary the size of the TSV diameter to see its impact on EM.
z
Path 3 x
y G F I H Figure 2. TSV structure and testing points for experiments. A, F are the ends of the wire; B, G are the interface between the landing pad and the wire; C and H are in the center of the TSV on top and bottom side; D, I are 0.75× radius point from the TSV center; E is in the middle of the TSV cylinder. Path 1 and path 3 lie along the x-axis while path 2 lies along the z-axis.
1421
Figure 2 shows the testing points in the TSV structure. We assume that a current density of 1e10A/m2 enters through the M1 wire from point ‘A’. We investigate EM at the ends of the wires, inner points of the TSV, and landing pad-wire interface as shown in Figure 2. To clearly show the stress effect on EM, we display stress profile along the certain paths in Figure 2. Figure 3 is the stress profile along these three paths. (a)
(b)
Wire Region
TSV Region B Path 2 Hydrostatic Stress [Pa]
Path 1 Hydrostatic Stress [Pa]
3x10⁸
A 2x10⁸
D 1x10⁸
C
0x108
4x10⁸
E 3x10⁸
2x10⁸
2
4
6
8
10
12
14
Path 2, z [um]
16
0
Path 3 Hydrostatic Stress [Pa]
TSV Region
(c)
C
H 1x10⁸
Path 1, x [um] 0
TSV Region
5x10⁸
5
10
15
20
25
30
Wire Region G
2.4x10⁸
F 1.8x10⁸
1.2x10⁸
higher stress gradient as compared to points ‘H’ and ‘I’. Thus, points ‘C’ and ‘D’ tend to fail first than points ‘H’ and ‘I’. Points ‘B’ and ‘G’, the interface of landing pad and the wire, fail next. Here, the amount of stress gradient is less than that of the TSV center, but these points still have higher stress gradient compared to the other points. Due to the higher stress gradient at ‘B’, it tends to fail earlier than ‘G’. The failure at points ‘A’ and ‘F’ is impacted only by the amount of current density in these regions. Since, the wire connecting to point ‘F’ has greater width and thickness; it has lower current density and thus tends to fail slower compared to ‘A’. ‘E’ is typically the most robust point, not only it does not have any stress gradients, but also current density inside of the TSV cylinder is low enough. In general, we observe that TSV-induced stress can increase the number the number of points where failure may occur. By increasing the TSV radius, the amount of stress gradient around stress-hot region gets larger, therefore ‘B’, ‘C’, ‘D’, ‘I’, ‘H’, ‘G’ fail earlier than the smaller radius of TSV. T∆ of other points do not change much. We can see that T∆ of TSV structure is largely dominated by TSV-induced stress gradient.
H I Path 3, x [um]
0.6x10⁸ 0
2
4
6
8
10
12
14
16
Figure 3. Stress profile along the paths shown in Figure 2. (a), (b), and (c) shows stress along the path 1, 2, and 3, respectively.
III-2. Impact of TSV radius on EM To measure the degradation caused due to EM, we define a time metric (similar to time-to-failure) to measure how long it takes for atomic concentration variation to reach a certain threshold (T∆ ). In this paper, we use 5% deviation of atomic concentration [1] as the threshold, and compute the fastest time that reaches such deviation (i.e. similar to time-tofailure). Depending on the failure criteria, current density, magnitude of TSV-induced stress, and the values of various constants, the actual value of T∆ can vary. However, the overall trend remains the same. Thus, we use normalized ∆ to show the trends. We change the TSV radius from 2um to 4um, and see the impact on T∆ . We also increased landing pad size from 5um to 10um to keep the ratio of landing pad over the TSV diameter as a constant. Table 3 shows normalized T∆ for different TSV radius.
Figure 4. Atomic concentration on the TSV structure at normalized time=8.3. Note that initial atomic concentration is 1.53e28, and we regard 5% deviation as failure.
III-3. Impact of landing pad size on EM Using the Via-first structure as shown in Section III-1, we investigate the impact of the landing pad size of the TSV. In this case, we use the same TSV radius, 2um, and change the landing pad size from 5um to 15um as shown in Table 4. Note that the landing pad size refers to the width or the height of the landing pad.
Table 3. Normalized TΔC according to TSV radius
Table 4. Normalized TΔC according to TSV landing pad size
rad
A
B
C
D
E
F
G
H
I
2um
11.1
6.75
0.25
1
>83
>83
10.7
1
3.17
3um
11.0
5.83
0.15
0.51
>83
>83
8.67
0.53
1.25
4um
11.0
5.00
0.11
0.38
>83
>83
8.17
0.31
0.58
LP
In all cases, point ‘C’ tends to fail first, and points ‘D’, ‘H’, ‘I’ fail relatively early. These four points tend to have the maximum stress gradients around them. Due to difference in the thickness of the top landing pad and the bottom landing pad and also, due to the difference in the properties of the materials surrounding them, points ‘C’ and ‘D’ tend to have
A
B
C
D
E
F
G
H
I
5um
11.1
6.75
0.25
1
>83
>83
10.7
1
3.17
10um
11.1
19.4
0.13
0.42
>83
>83
38.2
0.39
1.21
15um
12.8
39.1
0.10
0.26
>83
>83
78.1
0.22
0.61
Table 4 shows T∆ for each test point. As the landing pad size increases T∆ of points ‘B’ and ‘G’ increases. This is because increase of distance from the TSV center causes smaller stress gradient at points ‘B’ and ‘C’. However, points ‘C’, ‘D’, ‘H’, ‘I’ tend to fail earlier. This occurs because
1422
greater mismatch in the landing pad size and the TSV radius causes larger stress gradients. III-4. Study of Via-last structure In this section we study the EM impact on the Via-last structure. In the Via-last structure, both the top and bottom landing pads are on the top metal layer. Typically Via-last structure has much larger TSV cylinder and landing pad size due to its fabrication process. Figure 5 shows the Via-last structure used in our simulations. We assume the TSV radius to be 10um and the TSV height to be 150um. The landing pad size is assumed to be 25um × 25um.
Si
150um
Landing Pad on M8
M8 wire
1um
BCB ILD
4.2um
TSV
Si
y 0.2um
SiO 2
(a)
IV. EM modeling of wires in a 3D IC TSV-induced stress affects not only the TSV itself, but also the neighboring wires. Such stress can either degrade or improve the lifetime of the wires depending on their relative position from the TSV and the current direction. In this section, we observe EM on metal wires around the TSV at different locations. To start with, it is important to understand that based on the relative location of the wire with respect to the TSV center the wire can experience different stress profiles. For a thin wire along the x-axis, the stress along the wire is dominated by the x-component of the TSV-induced stress. According to Lu et al.[18], when a wire is located at a normal direction with respect to the TSV center, x-component of stress, σx, increases as the distance from the TSV center decreases while a wire in the tangential direction shows the opposite trend. Figure 6 illustrates this phenomenon. Tangential direction
x Normal direction
150um
TSV
TSV Stress profile
1um
BCB
Landing Pad on M8
ILD
4.2um
Si
150um
Stress profile
M8 wire
M8 wire
(a)
M8 wire 20um
0.8um
(b) 10um
10um
25um
(b)
Figure 6. Stress profile of a thin wire along the x-axis: (a) located in normal direction, (b) located in tangential direction from the TSV.
Figure 5. (a) Cross section of 3-die stacking structure with a Via-last TSV for simulation. (b) Top-down view of the TSV, landing pads and connected wires. Note that the figure is not to scale.
Table 5 shows normalized T∆ for each test point. In the Via-last structure, points ‘D’, ‘H’, ‘I’, fail earlier than a Viafirst case, due to the large amount of stress gradient caused by the bigger TSV structure. Point ‘C’ tends to fail later as compared to the Via-first structure. This occurs because point ‘C’ is far away from the landing pad and the TSV radius interface, thus, causes smaller stress gradient at the center of TSV. The point on the lower wire and landing pad interface, ‘G’, does not show much difference between Via-first and Via-last case because the structure of lower wires are same in both cases. Meanwhile, points on the upper wire, ‘A’ and ‘B’ have larger T∆ in the Via-last structure because they have smaller current density and lesser amount of stress gradient than the Via-first case.
Due to the different stress trends, we investigate EM for wires at normal direction and tangential direction with respect to the TSV, in Section IV-1 and IV-2, respectively. In IV-3, we study EM on a wire that goes across the TSV. Impact of different metal layers on EM is studied in IV-4. In Section IV5, we study the relationship between the TSV radius and the minimum distance between the TSV and a wire to achieve robustness. In our experiments, wire width and height is 0.2um, TSV radius is 2um, and landing pad size is 5um × 5um. IV-1. Wire at normal direction with respect to the TSV Figure 7 shows the structure when wire is at a normal directional with respect to the TSV center. In this case we change the distance between the point ‘B’ and the TSV center, and see the impact on T∆ at point ‘A’ and ‘B’. Figure 8 shows the stress profile along the wire. As shown in Figure 8, ‘B’ has the highest stress gradient and stress level along the wire. dist
A
B
(a) TSV
y x
Table 5. Normalized TΔC for Via-last TSV, comparing with Via-first TSV A
B
C
D
E
F
G
H
I
VF
11.1
6.75
0.25
1
>83
>83
10.7
1
3.17
VL
55
12.5
0.54
0.53
>83
>83
10.8
0.39
0.4
(b)
M2 wire
Landing pad on M1
z
TSV
x
Figure 7. Structure to investigate a wire in normal direction of TSV: (a) topdown view, (b) cross-section view of the structure. A is the farthest point and B is the closest point from the TSV.
1423
Hydrostatic Stress [Pa]
A
B
1.9x10⁸
dist
(a)
y
TSV
1.8x108
x
1.7x108
(b) 0
5
10
15
20
M2 wire
x [um]
Landing pad on M1
Figure 8. Stress profile along the wire of the structure in Figure 7
B 2.12 1.37 1.13 1.01
1.8x10⁸
Normalized T∆ is shown in Table 6. At dist=3.5, point ‘B’ has greater T∆ compared to point ‘A’. In other words, point ‘B’ is more robust than point ‘A’ even though it is closer to the TSV center. As explained earlier, stress gradient increases as a testing point approaches to the TSV, if a wire is at a normal direction with respect to the TSV center. Let us revisit Equation 1 and 2. ∙
0
Hydrostatic Stress [Pa]
A 1 1 1 1
x TSV
Figure 9. Structure to investigate a wire in tangential direction of TSV: (a) top-down view, (b) cross-section view of the structure. A is the farthest point and B is the closest point from the TSV.
Table 6. Normalized TΔC for the wire in normal direction, as in Figure 7 dist = 3.5um dist = 4.5um dist = 5.5um dist = 6.5um
z
1.7x10⁸
1.6x10⁸
1.5x10⁸
0
5
10
15
20
x [um]
Figure 10. Stress profile along the wire of the structure in Figure 9.
(1)
Table 7. Normalized TΔC for the wire in tangential direction, as in Figure 9 dist = 3.5um dist = 4.5um dist = 5.5um dist = 6.5um
(2)
In this case the force due to the stress-gradient ( ) cancels the effect caused by the force due to the current density ( ) at point ‘B’. This causes in lower flux divergence at point ‘B’ resulting in greater time to fail. As ‘dist’ increases, the stress gradient at point ‘B’ becomes smaller, and T∆ at ‘B’ converges to T∆ at ‘A’.
A 1 1 1 1
B 0.37 0.58 0.68 0.80
IV-2. Wire at tangential direction with respect to the TSV Similar to the normal direction case, the structure with the wire at a tangential direction with respect to the TSV center is constructed as shown in Figure 9. Figure 10 shows the corresponding stress profile on the wire. The impact of ‘dist’ is shown in Table 7. In this case the force due to the stress) adds to the effect caused by the force due gradient (
) at point ‘B’. This causes in to the current density ( greater flux divergence at point ‘B’ resulting in smaller time to fail. As ‘dist’ increases, the stress gradient at point ‘B’ becomes smaller, and T∆ at ‘B’ converges to T∆ at ‘A’. Figure 11 illustrates atomic concentration along the wire when it is at a tangential direction with respect to the TSV. Without the TSV-induced stress, the left and right ends have similar values below and above the initial atomic concentration. However, due to the stress gradient induced by the TSV, the right end of the wire experiences a faster change in atomic concentration.
Figure 11. Atomic concentration along the wire in tangential direction from the TSV. Initial atomic concentration is 1.53e28, so 1.45e28 and 1.60e28 make 5% deviation. TSV center is located at x=2.00e-4 in this structure.
IV-3. Wire runs across the TSV Previous sections, IV-1 and IV-2, deals with the cases where the wire ends near the TSV region. In this section, we discuss the case when the M2 wire goes across the TSV region. In 2D ICs, EM-induced failure is less likely to occur in the middle of the wire. However, in 3D ICs, due to the steep stress gradient from CTE mismatch of TSV, the middle of the wire can fail before ends of the wire fail.
1424
IV-4. Impact of different metal layers on EM
B
A
(a)
dist
A
y
TSV
B
x
(a)
(b)
M2 wire
3.5um TSV
z
y x
Landing pad on M1
x
TSV
M8
Figure 12. Structure to investigate a wire runs across a TSV: (a) top-down view, (b) cross-section view of the structure.
M6
(b)
M4 M2 wire Landing pad on M1
Hydrostatic Stress [Pa]
2.0x10⁸
TSV
z x
Figure 15. Structure to investigate the metal layer impact: (a) top-down view, (b) cross-section view of the structure. A is the farthest point and B is the closest point from the TSV.
1.6x10⁸
1.2x10⁸
8.0x10⁸
4.0x10⁷ 0
4
8
12
16
20
x [um]
Figure 13. Stress profile along the wire for the structure in Figure 12. Table 8. Normalized TΔC for the wire runs over the TSV, as in Figure 12 dist = 0um dist = 1um dist = 2um dist = 3um
A 1 1 1 1
B 0.22 0.22 0.31 1.47
The simulated structure and stress profile along the wire are shown in Figure 12 and Figure 13 with the T∆ results shown in Table 8. When the wire goes through the TSV center, T∆ at point ‘B’ occurs faster as compared to the end points of the wire due to the steep stress gradient. As ‘dist’ increases, T∆ at point ‘B’ increases. Note that the dimension of the landing pad is 5um × 5um and TSV diameter is 2um, so if 2.5 it means that the wire is located outside of the landing pad region.
Magnitude of the TSV-induced stress on a wire depends on the distance between the wire and TSV center as seen in previous sections. Thus, for the higher metal layers, the impact of stress becomes smaller. In addition, current density can vary depending on the metal layer. Figure 15 describes our experimental structure to observe the impact of different metal layers on EM of 3D IC. The wire is lying along the tangential direction as discussed in Section IV-2, and we change the metal layers. To see the reduced stress effect and current density effect more clearly, we design two sets of experiments. First, we assume the same current density on the metal wire for all layers to solely see the impact of vertical distance from the TSV. In other words, as the vertical distance from the ‘stress-hot region’ gets larger, a wire becomes more robust to EM. Simulated T∆ results are shown in Table 9. At point ‘B’, T∆ is shorter than other regions. This is because stress gradient accelerates atomic movement as discussed in Section IV-2. However, as the metal layer goes up, the absolute value of stress gradient gets smaller, and T∆ becomes longer. It means a wire in higher metal layer is less likely to fail than the lower metal wire due to lower TSVinduced stress. Table 9. Normalized TΔC and stress gradient with different metal layers, when the current density is the same for all the layers Stress gradient Current density Normalized TΔC [A/m2] [MPa/um] A B A B Both A & B M2 layer 1 0.37 0 -11.9 1e10 M4 layer 1 0.39 0 -7.12 1e10 M6 layer 1 0.68 0 -1.49 1e10 M8 layer 1 0.76 0 -0.37 1e10
Figure 14. Atomic concentration along the wire going over the TSV, with normalized time=0.91. Center of the TSV has the highest atomic concentration due to the TSV-induced stress. TSV center is located at x=2.00e-4.
Figure 14 shows the atomic concentration along the wire. Without the TSV stress, failures occur at either end of the wires. However in this case, TSV-induced stress gradient may cause failure in the middle of the wire as well.
Second, we see the impact of different current density in the different metal layers on EM in addition to the distance effect. As a wire in the upper metal layer becomes thicker and taller, cross area of the wire increases and it can reduce the current density. Meanwhile, global interconnects are preferred on higher metal layers [19,20]. Long global nets with higher capacitance on higher metal layers tend to have greater current than the lower metal layers [21]. We assume that M8 wire delivers 4 times larger current, and M4/M6 wire delivers
1425
2 times larger current than M2 wire. Current density for each layer is calculated based on the 45nm technology standard as shown in Table 10. We observe that M8 wire has lower current density compared with M1 wire. Table 10. Wire width, height and current density for 45nm technology Metal Wire Wire Cross Current Current Density Layer Width Height Area[m2] [A] [A/m2] M2 0.07um 0.14um 9.8e-15 I=9.8e-5 1e10 M4 & M6
0.14um
0.28um
3.92e-14
2I=1.96e-4
5e9
M8
0.4um
0.8um
3.2e-13
4I=3.92e-4
1.225e9
Table 11. Normalized TΔC and stress gradient for with different metal layers, when the current density is different for each layer Stress gradient Current density Normalized TΔC [A/m2] [MPa/um] A B A B Both A & B M2 layer M4 layer M6 layer M8 layer
1 3.95 3.95 >33
0.37 0.94 1.98 >33
0 0 0 0
-11.9 -7.12 -1.49 -0.37
1e10 5e9 5e9 1.225e9
IV-5. Impact of TSV radius on the safe distance from the TSV If the TSV radius is large, stress-hot region around the TSV is also large and it affects EM robustness for a wider area around the TSV. To see the relationship between the TSV radius and the distance from the TSV that guarantees the low stress gradient, we measure the stress gradient on a wire by changing the radius of the TSV. The simulation structure is the same as shown in Figure 9 in Section IV-2. We change the TSV radius and measure the stress gradient by changing the distance from the TSV. Table 12. Normalized stress gradient with different TSV radius and distance from a TSV TSV radius 1x dist. 2x dist. 3x dist. 4x dist. 1
0.380
0.097
0.010
3um
1
0.423
0.112
0.007
4um
1
0.405
0.087
0.001
V-1. Design guideline for the EM-robust TSV 1) TSVs with smaller size lead to smaller stress gradients and are thus less likely to fail due to TSV-induced stress. 2) Larger variation in the dimensions of the TSV structure may cause greater stress gradients thus making it more likely to fail. 3) The wire and landing pad interface should be as far as possible from the TSV structure to reduce the impact of stress induced failure. 4) Via-last structure tends to have greater stress gradient but lower current density. Thus Via-last structure may cause more failures due to TSV-induced stress. V-2. Design guideline for the EM-robust wires in 3D ICs
T∆ with different current density according to the metal layer is shown in Table 11. Higher metal layers tend to be more robust due to lower current density and lower stress gradients. T∆ of M8 wire is much larger than M2 wire for the specified current density.
2um
discuss EM-robustness in 2D-IC [14,15], to the best of our knowledge, this work is the first one that suggests EM-robust design guidelines for 3D ICs.
Results are shown in Table 12, if the distance between the wire and TSV center is more than 3 time of the radius (3x dist.), TSV-induced stress falls to about 10% of the value observed at 1x point. Lower stress gradient levels can reduce the impact of stress induced failure. We observe that for larger TSVs, a larger distance from the TSV may be needed to achieve increased robustness. V. EM-robust design guidelines So far, we have investigated EM and EM-induced lifetime of a TSV and wires around it for 3D IC design. Based on these experiments, we suggest guidelines for designing 3D ICs with EM-robustness. Although there exists works that
1) It preferred to avoid having wire ends close to the TSVcenter thus reducing failure due to TSV-induced stress. 2) Relative location of wire with respect to the TSV center can impact how the stress varies along the wire. However, to reduce stress induced failure it is safer to keep the wires away from the TSV center. 3) Do not make wire go across the TSV at the relatively lower metal layers, e.g. M2-M4. If possible, make a detour so that wires can avoid running across the TSV center. 4) Reduce the current density. As the EM-induced lifetime is inversely proportional to the square of current density [16], small reduction in current density can increase lifetime significantly. VI. Conclusions In this work, we study EM issues with TSV-induced stress in 3D ICs. The EM effects at both TSV structure and wires have been investigated, and normalized time for variation on atomic concentration (T∆ ) has been estimated. Unlike 2D ICs, we find that TSV-induced stress plays an important role in EM-robustness of both TSV itself and neighboring wires in 3D ICs. To make 3D ICs robust, careful design of the TSV and novel routing/wire sizing schemes are needed to mitigate EM hotspots, which we plan to investigate in the future. Acknowledgments This work is supported in part by the National Science Foundation under Grants No. CCF-1018216, CCF-1018750, the SRC Interconnect Focus Center (IFC), IBM Faculty Award, and Intel Corporation. References 1. Jing, J.P., Liang, L. and Meng, G., “Electromigration Simulation for Metal Lines,” J. Electron. Packag., Vol. 132, Issue 1, 011002 (2010). 2. Sukharev, V., Kteyan, A., Zschech, E. and Nix, W.D., “Microstructure Effect on EM-Induced Degradations in Dual Inlaid Copper Interconnects,” IEEE Trans. Device. Mater. Reliab. , Vol. 9, No.1 (2009), pp. 87-97. 3. Croes, K., Wilson, C.J., Lofrano, M., Vereecke, B., Beyer, G.P. and Tokei, Zs., “Electromigration and stress-
1426
4.
5.
6.
7.
8.
9.
10. 11.
12.
13.
14. 15.
16.
induced-voiding in dual damascene Cu/low-k interconnects: a complex balance between vacancy and stress gradients,” Proc 48th Reliab. Phys. Symp., Anaheim, CA, May. 2010, pp. 591-598. Liu, Y., Irving, S. and Luk, T., “3D Modeling of Electromigration Combined with Thermal-Mechanical Effect for IC Device and Package,” Microelectron. Reliab., Vol. 48, Issue 6 (2008), pp. 811-824. Chen, Z., Lv, Z., Wang, X.F., Liu, Y and Liu, S., “Modeling of Electromigration of the Through Silicon Via Interconnects,” Proc 11th Inter. Conf. Electron. Packag. Tech. & High Density Packag., Xi’an, China, Aug. 2010, pp. 1221-1225. Trigg, A.D., Yu, L.H., Zhang, X., Chong, C.T., Kuo, C.C., Khan, N. and Daquan, Yu, “Design and Fabrication of a Reliability Test Chip for 3D-TSV,” Proc 60th Electron. Comp. & Tech. Conf., Las Vagas, NV, June. 2010, pp. 79-83. Tan, Y.C., Tan, C.M., Zhang, X.W., Chai, T.C. and Yu, D.Q., “Electromigration performance of Through Silicon Via (TSV) – A modeling approach,” Microelectron. Reliab., Vol. 50, Issues 9-11 (2010), pp. 1336-1340. Shayan, A., Hu, X., Engin, A.E. and Chen, X., “3D Stacked Power Distribution Considering Substrate Coupling,” Proc 27th Inter. Conf. Comp. Design, Lake Tahoe, CA, Oct. 2009, pp. 225-230. Selvanayagam, C.S., Lau, J.H., Zhang, X., Seah, S.K.W., Vaidyanathan, K. and Chai, T.C., “Nonlinear Thermal Stress/Strain Analyses of Copper Filled TSV (Through Silicon Via) and their Flip-Chip Microbumps,” IEEE Trans. Adv. Packag., Vol. 32, No. 4 (2009), pp. 720-728. Kirchheim, R., “Stress and Electromigration in Al-lines of Integrated Circuits,” Acta metall. Mater. Vol. 40, No. 2 (1992), pp. 309-323. Ney, D., Federspiel, X., Girault, V., Thomas, O. and Gergaud, P., “Stress-Induced Electromigration Backflow Effect in Copper Interconnects,” IEEE Trans. Dev. Mater. Reliab., Vol. 6, No. 2 (2006), pp.175-180. de Orio, R.L., Ceric, H. and Selberherr S., “Physically based models of electromigration: From Black’s equation to modern TCAD models,” Microelectron. Reliab., Vol. 50, Issue 6 (2010), pp. 775-789. Ceric, H., de Orio, R.L., Cervenka, J. and Selberherr, S., “A Comprehensive TCAD Approach for Assessing Electromigration Reliability of Modern Interconnects,” IEEE Trans. Device. Mater. Reliab., Vol. 9, No. 1 (2009), pp. 9-19. Lienig, J., Jerke, G., “Electromigration-Aware Physical Design of Integrated Circuits,” Proc 18th Inter. Conf. VLSI Design, Kolkata, India, Jan. 2005, pp. 77-82. Lu, K., Pan, D.Z., “Reliability-aware Global Routing under Thermal Considerations,” Proc 1st Symp. Quality Electronic Design Asia, Kuala Lumpur, Malaysia, July 2009, pp. 313-318. Black, J.R., “Mass Transport of Aluminum By Momentum Exchange with Conducting Electrons,” Proc 6th Reliab. Phy. Symp., Los Angeles, CA, Nov. 1967, pp. 148-159.
17. Huyghebaert, C., Olmen, J.V., Civale, Y., Phommahaxay, A., Jourdain, A., Sood, S., Farrens, S. and Soussan, P., “Cu to Cu interconnect using 3D-TSV and Wafer to Wafer thermo-copression bonding,” Proc Intercon. Tech. Conf., Burlingame, CA, Jun. 2010. 18. Lu, K.H., Zhang, X., Ryu, S.K., Im, J., Huang, R. and Ho, P.S., “Thermo-Mechanical Reliability of 3-D ICs containing Through Silicon Vias,” Proc 60th Electron. Compo. Tech. Conf., Las Vagas, NV, Jun. 2010, pp. 630634. 19. Ajami, A.H., Banergee, K. and Pedram, M., “Nonuniform chip-temperature dependent signal integrity,” Proc Symp. VLSI. Tech. Digest., Jun. 2001, pp. 145-146. 20. Alpert, C.J. and Tellez, G.E., “The Importance of Routing Congestion Analysis,” Knowledge center article of 47th Design Auto. Conf., Anaheim, CA, Jun. 2010. 21. Shao, M., Gao, Y., Yuan, L.P, Chen, H.M. and Wong, M.D.F., “Current calculation on VLSI signal interconnects,” Proc 6th Inter. Symp. Quality. Electronic. Design., San Jose, CA, Mar. 2005, pp. 580-585.
1427