In this work we focus on the base salt imaging problem by trying to recreate the .... effects of âdirtyâ salt, we added square velocity perturbations inside the salt ...
Main Menu
Modeling of “dirty salt” Jon André Haugen, Børge Arntsen and Joachim Mispel StatoilHydro Research Center, Trondheim
SUMMARY Base and sub salt seismic imaging is still an unresolved issue. To solve this problem both improved processing algorithms and acquisition geometries have been heavily researched the latest years. Reverse-time migration, full waveform inversion and wide azimuth acquisition among others are techniques which may help the salt imaging. However, there is less effort trying to explain what makes sub salt so difficult to image. To do so we should go back to the geology. It is a common assumption that salt is homogeneous with constant velocity to simplify the processing of seismic data. However, there may be several complex structures and/or rapid velocity changes within the salt body, which can affect the wavefield propagation in a such way that we get severe imaging problems. Imaging results of a 2D line in the North Cape Basin show no sign of the base salt reflection or any other sub salt reflectors. In this work we focus on the base salt imaging problem by trying to recreate the effects in the seismic data and the images. We are testing three different models which severely distort the data and the resulting images: the first with diffractors at the top salt, the second with velocity perturbations in the salt body, and the third with a combination of both effects. Comparing shot gathers and migrated images from synthetic and real data show that velocity perturbations in the salt distort the wave propagation to such extent that base salt reflector vanishes. INTRODUCTION Seismic imaging of complex salt structures and sub salt sediments still remains a challenge. There is a strong ongoing effort in the geophysical community to improve the way we both acquire and process the seismic data from these areas. Problems with salt imaging are often related to either getting a clear image of the base salt, or of the salt flanks. This may be due to non-suitable and dip-limited migration algorithms. Farmer et al. (2006) showed the usefulness of applying twoway wave equation migration algorithms, e.g. reverse-time migration, which handles both turning waves and multi-arrivals. Better acquisition geometries may also improve the salt and sub salt imaging. Areas which are poorly illuminated with conventional geometries are better illuminated with wide- or fullazimuth acquisitions (Regone, 2006). High-quality imaging of seismic data from complex geology requires an accurate model of the velocity field in the subsurface. In real life this may not
SEG Las Vegas 2008 Annual Meeting
be achievable. A depth velocity model is usually obtained using a depth tomography method on seismic data (see e.g. Cutler et al., 1984). However, building models of salt bodies (or other intrusions) is often related to finding the correct shape of the salt body after sufficiently accurate background velocities are found. A trial-and-error approach is usually used to delineate the salt body. Another method which has been heavily researched is full waveform inversion, where e.g. Pratt and Stork (2006) have shown promising results in recovering the velocity model for a synthetic salt example. This technique uses the full wavefield to iteratively update the velocity model. The problem occurs when we neither see the base salt, nor the salt flanks in the depth-migrated image. In processing it is commonly assumed that salt bodies are homogeneous with constant velocity and density. However, geologically speaking, they may not be as homogeneous as we like to believe. For example, while the inner core of a salt dome may consist of mainly pure halite, the rest could be a mix of salt, sediments and other rocks or minerals (Richter-Bernburg, 1987). It is not unusual that other layer-like structures exist in the outer salt zone. Rapid velocity changes within the salt structure may distort the propagation of the wave front. This will affect the recorded seismic data. Problems in imaging the base salt reflector will likely impact also the sub salt imaging. The focus in this work is therefore the imaging of the base salt reflector. By seismic modeling we try to recreate the effects in the seismic data and the depth images. Our reference model is a homogeneous salt body with constant velocity and density and no diffractors (a “clean” salt). Then we test three different salt models which distort the data in such a way that the base salt reflector will be imaged with very poor quality or not at all: first a pure salt model with diffractors on top salt, second a model with a flat top salt boundary and velocity perturbations in the salt body (the “dirty” salt) and at last a combination of the two. The synthetic seismic and final images are being compared with seismic data and images from a 2D line recorded in the Nordkapp Basin offshore Norway. MODELING AND IMAGING The Nordkapp Basin, located in the Barents Sea, is an exploration area with very complex geology. It contains several salt diapirs with shallow crests immediately below seabed, which
2127
Main Menu
Modeling of “dirty salt” make imaging of seismic data very difficult. Especially deeper parts of the salt flanks below the Base Cretaceous and also the base of the salt are badly imaged or not imaged at all. Several seismic exploration surveys have been conducted in this area from which we selected a 2D survey, which exhibit the base salt imaging problem. This survey covers two salt diapers, where we have focused on one of them. We used an existing velocity model as basis for our models in this work. Since the real 2D line for this survey was shot in two directions, we used a “marine split-spread” survey to simulate the data. In addition to the reference model, three different salt models were tested. The velocity models are shown in Figure 1, where Model 1 is the reference model. The models consist of one main salt structure in the centre. At an approximately depth of 5400 m there is a high density contrast to simulate a sub salt event. To make "realistic" data we performed the modeling with a free surface and used an acquisition geometry that resembled the real geometry: 12.5 m receiver spacing, 25 m between each shot and 100 m / 8100 m as minimum / maximum absolute offset. Model 1 has a homogeneous salt body with constant velocity of 4500 m/s and straight boundaries. In Model 2 we added irregularities on the top salt boundary in form of diffractors. The diffractors are closely spaced to maximize the effect on the seismic data. In order to simulate the effects of “dirty” salt, we added square velocity perturbations inside the salt body in Model 3, but kept a flat top salt. The perturbations were randomly scattered but an inner zone was kept clean. The velocity of these perturbations is 70 percent of the salt velocity, and the sizes varies between one and two wave lengths. Model 4 is a combination of Model 2 and 3. The four synthetic pre-stack datasets were modeled with a 2D acoustic finite-difference method. A 6.25 m grid spacing in both directions and a 25 Hz Ricker wavelet were chosen for this study. The preprocessing of the real data has been kept to a minimum with designature, true amplitude recovery and swell noise attenuation. Neither the synthetic nor the real data had any demultiple applied to it to avoid any removal of primary energy. For imaging all datasets a split-step Fourier migration algorithm was applied using Model 1 as migration velocity model. RESULTS AND DISCUSSION Figure 2 shows one synthetic shot gather for each of the four models. The displayed gathers cover absolute offsets up to 5000 m. The shot position was approximately above the centre of the salt diaper. The reflection of base salt is visible at a TWT of circa 2.2 s in Figure 2a. In the shot gather for Model 2 the reflection from the base salt is still visible through the linear noise caused by the diffractors. The amplitude of this noise appears comparable to the reflections visible at larger offsets. However the strong linear noise in Model 2 does not resemble the noise visible in the real shot gather from the same position
SEG Las Vegas 2008 Annual Meeting
(Figure 3). Rather the near-offset amplitudes in the real seismic appear to have lower amplitudes than the amplitudes of reflections at larger offsets. Looking at the shot gathers from Model 3 and 4 it is obvious that there is no visible base salt reflection. The near-offset amplitudes for Model 3 are lower than the far-offset amplitudes and the noise does not appear to be as linear as in Model 2. The shot gather for Model 4 resembles more the result for Model 2. Comparing with Figure 3 we can clearly see that the data for Model 3 resembles best the real data. In summary the diffractors create a high amplitude linear noise at near offsets, while the perturbations alone distort the propagating wavefront and significantly attenuate the recorded energy. The final depth image of the real data clearly points out the problem of delineating the salt body (see Figure 4). The sediments surrounding the salt structure are fairly well imaged, but it is neither possible to identify the base salt reflector, nor the lower salt flanks. In addition there are some disturbances visible within the salt. Figure 5 shows the final images of the synthetic seismic for Model 1 and 3. In the final image of the reference model, the base salt is clearly visible at a depth of 4250 m. We can also see (as expected) multiples of the top and base salt interfaces. Conversely there is no sign of the base salt reflector in the image for Model 3 (see Figure 5b). Apparently the perturbations in the salt body distort the wavefield to such extent that the imaging of the base salt reflector fails, when using the “clean” salt as migration velocity model. Also, the final image of Model 3 resembles the final image of the real data. CONCLUSIONS We have shown modeling results of three different salt models and a reference model. For Model 3, where a homogeneous salt body has velocity perturbations, we manage to mimic real recorded data. Depth-migrating this synthetic dataset showed that we are not able to image neither the base salt reflector, nor the sub salt event. Everything below top salt appears to be disturbed due to the velocity perturbations in the salt body. The same effects are visible in the shot gather and image from the real data. Therefore velocity perturbations due to a mix of salt, sediments and other rocks/minerals can explain why the base salt is not visible in the real data. One can also conclude that significant velocity perturbations within the salt distort the wavefield in such a way that good images of base salt or sub salt reflections are difficult to obtain. ACKNOWLEDGMENTS The authors would like to thank StatoilHydro ASA, Harstad, for providing data and the permission to publish this work. The abstract benefited from fruitful discussions about salt tectonics with Rune Kyrkjebø (StatoilHydro).
2128
Main Menu
Modeling of “dirty salt”
(a)
(b)
(c)
(d)
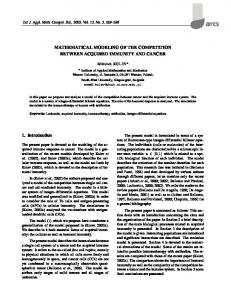
Figure 1: Velocity models: (a) Model 1, (b) Model 2, (c) Model 3 and (d) Model 4. The white line marks a high density contrast.
256 0
356
456
556
Chan # 656
756
856
256 0
956
TWT [s]
TWT [s]
2
556
Chan # 656
756
856
956
456
(b) Chan # 556 656
756
856
956
2
3
3
4
4
356
456
(a) Chan # 556 656
756
856
956
256 0
356
1 TWT [s]
1 TWT [s]
456
1
1
256 0
356
2
3
2
3
4
4 (c)
(d)
Figure 2: Synthetic shot gathers from (a) Model 1, (b) Model 2, (c) Model 3 and (d) Model 4.
SEG Las Vegas 2008 Annual Meeting
2129
Main Menu
Modeling of “dirty salt”
256 0
356
456
556
Chan # 656
756
856
956
TWT [s]
1
2
3
4
Figure 3: Real gather from the same shot position as the synthetic gathers in Figure 2. Figure 4: Final image of the real data, migrated with a split step shot migration.
(a)
(b)
Figure 5: Final image migrated with a split step shot migration algorithm. (a) Synthetic data from Model 1 and (b) synthetic data from Model 3. The migration velocity used for both migrations was Model 1.
SEG Las Vegas 2008 Annual Meeting
2130
Main Menu
EDITED REFERENCES Note: This reference list is a copy-edited version of the reference list submitted by the author. Reference lists for the 2008 SEG Technical Program Expanded Abstracts have been copy edited so that references provided with the online metadata for each paper will achieve a high degree of linking to cited sources that appear on the Web. REFERENCES Cutler, R., T., T. N. Bishop, H. W. Wyld, R. T. Shuey, R. A. Kroeger, R. C. Jones, and M. L. Rathbun, 1984, Seismic tomography: Formulation and methodology: 54th Annual International Meeting, SEG, Expanded Abstracts, 711– 712. Farmer, P. A., I. F. Jones, H. Zhou, R. I. Bloor, and M. C. Goodwin, 2006, Application of reverse time migration to complex imaging problems: First Break, 24, 65–73. Pratt, R. G., and C. Stork, 2006, Solving static problems with ultra-low frequency data and waveform inversion: 68th Annual International Conference and Exhibition, EAGE, Extended Abstracts, A035. Regone, C. J., 2006, A modeling approach to wide-azimuth design for subsalt imaging: The Leading Edge, 25, 1467–1475. Richter-Bernburg, G., 1987, Deformation within salt bodies in dynamical geology of salt and related structures: Academic Press.
SEG Las Vegas 2008 Annual Meeting
2131