Modeling Response Times in the Go/No-Go Discrimination Task Jennifer S. Trueblood (
[email protected]) Cognitive Science Program, 819 Eigenmann, 1910 E. 10th St. Bloomington, IN 47406 USA
Michael J. Endres, Jerome R. Busemeyer, and Peter R. Finn {mjendres, jbusemey, finnp}@indiana.edu The Department of Psychological and Brain Sciences, 1101 E. 10th Street Bloomington, IN 47405 USA Abstract The work presented here uses a simple stochastic model as a cognitive psychometric tool for analyzing response time data in the Go/No-Go Discrimination task with motivationally distinct conditions. The parameters of the model inform us of underlying cognitive mechanisms because they have an established psychological meaning and allow us to quantify a subjects ability and response caution. Using these model parameters, we focus on the differences between subjects with varying degrees of substance abuse and antisocial behavioral disorders and show that there are reliable differences between the decision mechanisms of these subjects. Using data from executive working memory tasks, we postulate that these differences in cognitive processes might be due to differences in working memory capacity. Ultimately, we show that formal cognitive modeling has the potential to provide valuable insights into clinical phenomena that cannot be captured by traditional data analysis techniques. Keywords: Go/No-Go task, decision-making, working memory capacity, diffusion model, Bayesian parameter estimation
Introduction Formal cognitive models can capture information about cognitive processes that is often not accessible with traditional statistical methods. Differences in cognitive functioning between normal and clinical patients can provide insights into abnormal behavior. Following Batchelder and Riefer (1999) we argue that parameter estimates from formal cognitive models provide a methodology for examining differences in cognitive functioning. Batchelder and Riefer refer to this methodology as cognitive psychometrics and have shown that it has advantages over traditional approaches. The present research uses a simple stochastic process as a cognitive psychometric tool for analyzing response time data in clinical studies. Specifically, we show how a cognitive model of response times can capture underlying cognitive processes in situations of approach-avoidance motivational conflict. Response time modeling approaches have been applied to various cognitive phenomena including memory retrieval (Ratcliff, 1978) and lexical decision tasks (Ratcliff, Gomez, & McKoon, 2004; Gomez, Ratcliff, & Perea, 2007). However, there is a dearth of studies using response time modeling approaches to examine approach-avoidance motivation. Cognitive modeling of choice and accuracy data in approachavoidance situations has provided insights into underlying cognitive processes (Endres, Rickert, Bogg, Lucas, & Finn, 2011; Yechiam et al., 2006). Through an application to the Go/No-Go Discrimination task (Newman, Widom, & Nathan,
1985), we show that cognitive models of response time can also provide insights into cognitive functioning.
The Go/No-Go Discrimination Task The Go/No-Go Discrimination (GNGD) task is a reliable measure of passive avoidance (Newman et al., 1985); it is considered an analog for real world approach-avoidance motivational conflict (Newman & Lorenz, 2003), because both appetitive (e.g., monetary reward) and aversive (e.g., monetary loss or electric shock) stimuli are used as reinforcement in the task. The standard GNGD task involves the trial-anderror learning of two sets of operant stimuli: one signaling ’Go’ or reward-approach responses; the other signaling ’NoGo’ or punishment-avoidance responses. The stimuli are usually two-digit numbers, which are counter balanced above and below fifty such that the Go and No-Go sets are completely indiscriminable or overlapping at the beginning of the task. There are two key manipulations in the standard GNGD task. The first is that only correct reward-approach behavior (i.e., hit or Go response given a Go signal) and incorrect punishment-avoidance behavior (i.e., false alarm or Go response given a No-Go signal) are reinforced. The second is that of speed discrimination or the need to decide whether to activate (i.e., Go response) or inhibit (i.e., No-Go response) reward-approach behavior within a brief time window (e.g. 750 ms). The most popular measures of GNGD task performance are commission errors (i.e., passive-avoidance errors or false alarms) and omission errors (i.e., misses). It is important to point out that persons with real world problems with substance use and antisocial behavior typically commit a greater number of passive avoidance errors (i.e., errors of commission or false alarms) on the GNGD task (Endres et al., 2011; Finn, Mazas, Justus, & Steinmetz, 2002; Finn, 2002). Recent studies have used stochastic (e.g., Cue-Dependency Learning) and deterministic (e.g., Signal Detection Theory) models of decision making to investigate the cognitive-motivational processes that contribute to GNGD task commission and omission errors (Endres et al., 2011; Smillie & Jackson, 2006; Yechiam et al., 2006). Consistent among these studies is the implication that cognitive processes, such as attention and working memory, aid in the self-regulatory control over both Go/No-Go response biases and Go/No-Go signal learning. The present research adds to these findings by estab-
1866
lishing links between decision mechanisms, working memory capacity, and response times. While this paper focuses entirely on modeling response times, we plan to model response times, choice and learning in the future.
Experiment Participants The present study was a part of a much larger investigation into the cognitive, motivational, and personality correlates of substance use and antisocial behavior problems. Potential participants were recruited from the local university and surrounding area using advertisements and fliers designed to elicit responses from persons with a variety of disinhibited personality traits and history of substance use and antisocial behavior problems (Finn et al., 2009). A total sample (N= 484) were recruited into the larger study, but not all participants chose to complete the entire battery of laboratory measures used in the present research. The present sample (N=147) was gender balanced (53% women) and consisted primarily of young adults (mean age 22.4 + 3.1) with 13.8 + 2.1 years of education.
Semi-Structured Diagnostic Interview History of alcohol and other drug use, childhood conduct disorder and adult antisocial personality disorder was ascertained with the Semi-structured Diagnostic Interview for the Genetics of Alcoholism (Bucholz et al., 1994) using the Diagnostic Statistical Manual of Mental Disorders Fourth Edition criteria (APA, 1994). Subjects were classified into one of three groups based on their diagnostic history: (1) No history (N=31), (2) history of 1 or 2 diagnoses (N=52), and (3) history of 3 or more diagnoses (N=64). Group 3 subjects had more severe diagnostic histories, such that the majority presented clinical problems with other drug use (100%) and antisocial personality (82%) disorder, as opposed to group 2 who presented little or no history with these clinical problems (0% and 18%, respectively).
Double-Factorial Go/No-Go Discrimination task Six motivationally distinct versions of the standard GNGD tasks were administered, representing a 2 x 3 repeated measures experimental design. This design was used to examine the interactive effects of (1) punishment reinforcement type: monetary loss versus electric shock and (2) reward versus punishment reinforcement schedule: equal salience (33% vs. 33%), reward salient (100% vs. 33%), and punishment salient (33% vs. 100%). Each of the 6 GNGD task versions used 8 different two-digit stimuli that were divided into 2 counterbalanced sets, consisting of 4 stimuli each. Different twodigit stimuli were used in each of the 6 GNGD task versions. The order in which the 6 versions were administered also was counterbalanced. Each task consisted of 56 total trials divided into 7 blocks of 8 trials.
Working Memory Capacity Working memory capacity was assessed with 5 separate tasks: 3 simple span and 2 complex span tasks (Conway et al., 2005). Simple span tasks involve immediate recall of to-be-remembered list items, and thus, are thought to assess the short-term activation aspects of working memory. Simple span memory was assessed with the digits forward and backward span subtests of the Wechsler Adult Intelligence Scale-Revised (Wechsler, 1981) and the letter-number subtest of the WAIS-III (Wechsler, 1997). The digits forward, digits backward, and letter-number tasks operationalize short-term activation capacity in working memory as the total number of to-be-remembered items of varying list sizes that can be held in mind and manipulated in some way. Complex span tasks involve both a primary memory task, such as recalling word or letter strings of various sizes in order of presentation, and the performance of a secondary cognitive task, such as solving a mathematical operation or counting backwards by three for a predetermined length of time. Complex memory span was assessed with the operation-word span test (Conway & Engle, 1994) and a modified auditory consonant delay test (Brown, 1958; Finn et al., 2009). The operation-word span and auditory consonant delay tasks operationalize executive attention and short-term activation capacity in working memory as the total number of to-be-remembered list items that can be held in mind while performing a secondary cognitive task. Data from the 5 measures of working memory capacity were reduced into a single latent factor using maximum likelihood factor extraction. This unidimensional latent factor showed above average reliability (Cronbach’s a = .81) and accounted for 56.59% of the variance in the working memory capacity measures.
Procedure Participants read and signed an informed consent to participate, were free to refuse any assessment, and were paid $10.00 per hour for their time in the laboratory. Participants completed 3 testing sessions, lasting approximately 3 hours a session, and were compensated for both child care costs and millage to and from the laboratory. Participants were first administered the diagnostic interview, followed by an interspersed ordering of computer and experimenter administered laboratory tasks.
Data Analyses and Results General trends in response times across all subjects for the six different experimental conditions for correct responses (hits) and errors (false alarms) were examined. A three-way ANOVA showed a significant main effect of condition on response times (F(5,1644) = 13.55, p < .001), a significant main effect of diagnostic group on response times (F(2,1644) = 5.73, p < 0.003), and no significant main effect of response type (hit or false alarm) on response times (F(1,1644) = 0.13, p = 0.720). There were no significant interactions. Seven of the 147 subjects were excluded from this analysis because they either produced zero hits or zero false alarms in one of
1867
Diagnostic Group Group 1 Group 2 Group 3 .493 (.058) .494 (.061) .500 (.048) .487 (.052) .488 (.055) .491 (.059) .479 (.060) .490 (.055) .498 (.055) .508 (.043) .523 (.052) .533 (.049) .487 (.063) .476 (.057) .498 (.066) .488 (.064) .492 (.052) .491 (.068)
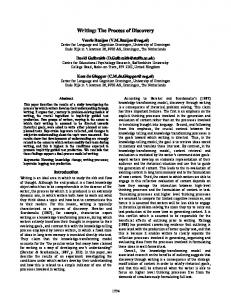
The relationship between diagnostic group and working memory capacity was also analyzed (see Figure 1). A oneway ANOVA showed a significant main effect of diagnostic group on working memory capacity (F(2,137) = 4.97, p < .008). A Dunn test showed that the working memory capacity of group 3 was significantly lower (p < 0.05) than the working memory capacity of groups 1 and 2. There was no significant difference in the working memory capacity of groups 1 and 2.
Modeling Response Times We modeled the decision processes in the GNGD using a sequential sampling model. These models offer a way to understand both speed and accuracy in tasks involving decisions between a set of alternatives. For the purposes of this paper, we focus entirely on modeling response times and leave the discussion of choice probability for a future report. Sequential sampling models assume that performance is based on the
group 1 (N = 29) group 2 (N = 51) group 3 (N = 60) 0.5
0
−0.5
−1
Group
Figure 1: Working memory capacity factor by diagnostic group.
quality of stimulus information and the quantity of information necessary to make a response. Specifically, these models make the assumption that evidence favoring each alternative is integrated over time, the accumulation of evidence is subject to random fluctuations, and a decision is made when enough evidence has been accumulated to reach a specified criterion.
Model Parameters
Table 1: Mean Response Times for Different Diagnostic Groups Condition (Pun., Reinf.) Money, Equal Money, Reward Money, Pun. Shock, Equal Shock, Reward Shock, Pun.
1
Working Memory
the six conditions. Typically, these subjects withheld all responses and treated all trials as No-Go trials. Table 1 gives the mean and standard deviation of response times collapsed across hits and false alarms for each condition for the three different diagnostic groups. To determine which experimental conditions produced significantly different response times, a pairwise comparison was conducted. A Dunn test which applies the Bonferroni adjustment to the critical values from the t distribution showed that the mean response time for the shock condition with equal reinforcement was significantly longer (p < 0.05) than the mean response times for the other five conditions. These were the only significant pairwise comparisons. It is not surprising that we find longer response times in the shock condition with equal reinforcement because the equal reinforcement conditions provided the least amount of feedback in the form of rewards and punishments, and subjects were typically adverse to shocks. A Dunn test was also used to determine which diagnostic groups produced significantly different response times. This test showed that the mean response time for group 3 subjects (those subjects with more than two disorders) was significantly longer (p < 0.05) than the mean response times for the other two diagnostic groups. This was the only significant pairwise comparison.
We modeled response times using a simple diffusion process called a Wiener process that had a single absorbing boundary associated with Go responses. There was not a corresponding boundary for No-Go responses because response time data was not collected in these situations. Future work will model both response times and choice probabilities by using a two boundary model with an implicit lower boundary associated with No-Go responses. A one-boundary Wiener process has three parameters: a parameter ν reflecting the drift rate of the process, a parameter a associated with the separation between the starting point of the diffusion process and the absorbing boundary, and a parameter Ter used to shift the starting point of the process forward in time. The parameters of the one-boundary Wiener process have an established psychological meaning (Matzke & Wagenmakers, 2009). Specifically, the drift rate parameter is associated with the amount of evidence a subject receives from a stimulus at each moment in time. Thus, the drift rate quantifies the subject’s ability and task difficulty. The boundary separation parameter reflects the amount of evidence required to make a response (i.e., response caution). The shift parameter corresponds to non-decision time and quantifies the amount of time involved in stimulus encoding and physical execution. The first passage time distribution of the one-boundary Wiener process is used to model the experimental response time distribution. For the one-boundary Wiener process, this distribution is represented by the shifted Wald distribution. The probability density function for the shifted Wald distri-
1868
bution is given by [a − ν(t − Ter a exp{− f (t|ν, a, Ter ) = p 3 2(t − Ter ) 2π(t − Ter )
)]2
}
We assumed that different conditions provided varying levels of difficulty resulting in subjects demonstrating differing ability across conditions. To allow for these differences, a different drift rate was fit for each condition. Further, we assumed that the two types of stimuli (Go and No-Go) presented different types of information to the subject. To account for the different types of stimuli information, different drift rates for hits (corresponding to Go stimuli) and false alarms (corresponding to No-Go stimuli) were fit. Thus, a total of 12 drift rates with two for each condition were fit. We also believed that subjects displayed different levels of response caution for different conditions. So, six different boundary separation parameters were fit. We assumed that non-decision time was not influenced by condition so only one non-decision parameter was fit. In total, the model used 19 parameters to account for individual behavior in all six experimental conditions.
Parameter Estimation The model parameters were fit using hierarchical Bayesian parameter estimation. Because each condition only contained 56 trials, we felt that Bayesian parameter estimation was preferable to maximum likelihood methods. Furthermore, Bayesian parameter estimation produces a posterior distribution for each parameter value. The WinBUGS program (Lunn, Thomas, Best, & Spiegelhalter, 2000) was used to implement the necessary MCMC algorithms. We used the shifted Wald density function written in the WinBUGS Development Interface (Lunn, 2003) by Lee and Wagenmakers (2009). The 19-parameter model was fit to data for each subject giving us a set of parameter estimates for every individual. In other words, 19 parameters were used to model the 336 data points collected for each subject across the six conditions. For a single condition, three unique parameters were used to model the data from that condition: two drift rates for hits and false alarms and one boundary separation parameter. The non-decision time parameter was fit to all conditions and was thus not uniquely specified by any one condition. We used hierarchical parameters associated with the three diagnostic groups to capture structured individual differences. The parameters for each individual were drawn from distributions defined by these hierarchical parameters. For each diagnostic group, there were a set of hierarchical parameters associated with drift rates and boundaries separations for each condition. Specifically, for a single condition, there were three unique hierarchical parameters associated with each group: two drift rates for hits and false alarms and one boundary separation parameter. There was also a non-decision time hierarchical parameter associated with each diagnostic group which was fit to all conditions. Three MCMC chains were used to estimate the posterior distributions for the parameters. The first 1,000 samples of
each chain were discarded as ”burn-in”. Another 10,000 samples were drawn from each chain to estimate the posteriors. Chain convergence was assessed by using the Rˆ statistic. All parameters had an Rˆ of 1.0.
A Qualitative Evaluation of the Model Model performance was examined by looking at a qualitative comparison between the model predictions and the data. We calculated the Kendall rank correlation coefficient (or Kendall’s τ ) for every subject to measure the association between the mean response times and the model predictions for all six conditions. For calculating the model predictions, the mean of the posterior distributions of the parameters was used as a point estimate of these distributions. These means were then used to calculate the expected value of the model’s response time distribution. Table 2 shows several descriptive statistics for the τ values. A τ value of 1 implies perfect agreement between the rankings and a τ value of −1 implies perfect disagreement between the rankings. From the table, we see that the hierarchical model captured the qualitative results very well. Table 2: Rank Correlation Between Subjects and Model mean 0.86
median 0.87
std 0.17
min -0.20
max 1.0
The hierarchical model allowed for the expression of structured individual differences across all conditions. This gave us the ability to explore differences in the decision mechanisms between these various conditions. Further, it allowed us to establish relationships between model parameters and the working memory capacity factor. Models with fewer parameters might also provide good predictions of the data and might even be preferred by traditional model comparison techniques. However, when models with fewer parameters were tested, it was found that they did not account for individual differences to the same extent as the current model. The models with fewer parameters tended to make trade offs between parameter values in order to fit the data. These trade offs prevented the models from capturing many of the results described below.
Modeling Results We began our analysis of the model by examining the correlation between model parameters and the working memory capacity factor. Across all conditions, we found that the working memory capacity factor was positively associated with boundary separation parameters. This implies that subjects with high working memory capacity demonstrated more response caution than subjects with low working memory capacity. In conditions of monetary punishment with reward and punishment reinforcement, the working memory capacity factor was highly correlated with drift rate parameters. Because drift rate parameters quantify subjects’ ability to per-
1869
form the task, the strong correlation between working memory capacity and drift rates in these two conditions implies that subjects with high working memory capacity accumulated stimulus information more quickly than subjects with low working memory capacity. Table 3 summarizes these results. Table 3: Correlation between Working Memory and Model Parameters Condition (Pun., Reinf.) Money, Equal Money, Reward Money, Pun. Shock, Equal Shock, Reward Shock, Pun.
Drift Rate ρ (p-value) 0.17 (0.046) 0.31 (0.000) 0.23 (0.005) 0.11 (0.182) 0.11 (0.179) 0.21 (0.012)
Parameter Boundary Separation ρ (p-value) 0.25 (0.003) 0.31 (0.001) 0.28 (0.001) 0.26 (0.002) 0.16 (0.055) 0.17 (0.038)
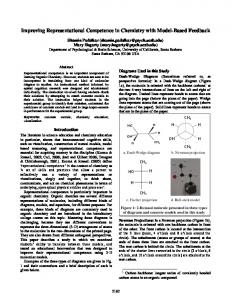
Next, we examined the hierarchical parameters for the three diagnostic groups. Figure 2 and Figure 3 show the mean and standard deviation of the posterior distributions of these hierarchical parameters. From the figures we see that the hierarchical drift rates and boundary separation parameters were larger for group 1 subjects than for group 3 subjects. This implies that normal subjects tended to accumulate stimulus information more quickly and showed more response caution than subjects with many clinical disorders. In the monetary punishment conditions with reward and punishment reinforcement, the hierarchical drift rates and boundary separation parameters were larger for group 2 subjects than for group 3 subjects. However, in most of the remaining conditions, the hierarchical parameters associated with group 2 subjects were similar to the hierarchical parameters associated with group 3 subjects. In other words, subjects with one or two clinical disorders tended to accumulate stimulus information more quickly and showed more response caution than subjects with three or more clinical disorders only when the aversive stimulus was monetary loss and the reinforcement schedule was reward or punishment salient.
Discussion From the results discussed above, we see that stochastic modeling provided more insight into the cognitive mechanisms involved in decision making processes than traditional analyses of the data. While the statistical analyses of the response time data indicated that diagnostic group 3 subjects had significantly longer mean response times than group 1 and 2 subjects, it did not provide any insights into why this occurred. The cognitive model showed us that in general subjects with few to no clinical disorders (i.e. group 1 and group 2 subjects) tended to have higher drift rates and larger boundary separation parameters as compared to subjects with many clinical disorders (i.e. group 3 subjects). The lower drift rate pa-
rameters of group 3 subjects indicate that these subjects accumulated stimulus information slowly and could explain the longer response times of these subjects. The cognitive model also showed differences in the decision mechanisms of group 2 and group 3 subjects in conditions of monetary punishment with reward and punishment salient reinforcement. We postulate that the differences between group 2 and group 3 subjects in these two conditions might be due to differences in working memory capacity. First, we know that group 2 subjects have higher working memory capacity than group 3 subjects. Second, the relationships between model parameters and the working memory capacity factor as seen in the correlation analysis (Table 3) indicate that working memory is strongly associated with drift rates and boundary separation parameters in conditions of monetary punishment with reward and punishment salient reinforcement. Of course, future research will be needed in order to fully understand the connections between working memory capacity and the cognitive mechanisms of clinical patients. This research illustrated that simple stochastic models can be used as cognitive psychometric tools for analyzing response time data in clinical studies. Future work will use a two boundary diffusion model to account for both response times and choice probabilities. We hope to make connections between the parameters of the two boundary diffusion model and the parameters of a learning model. These two models will then be used to conduct a full examination of the decision mechanisms involved in the GNGD task. In particular, we will focus on discovering the extent to which working memory capacity and other factors such as externalizing psychopathology are involved in decision processes. We believe that cognitive modeling has the potential to provide valuable insights into clinical phenomena that cannot be captured by traditional data analysis techniques.
Acknowledgments This research was supported by National Institute of Alcohol Abuse and Alcoholism R01 AA13650 awarded to Peter R. Finn. While writing this manuscript, Jennifer S. Trueblood was supported by the National Science Foundation/IGERT Training Program in the Dynamics of BrainBody-Environment Systems and Michael J. Endres was supported by National Institute of Mental Health R36 MH092040.
References Batchelder, W. H., & Riefer, D. M. (1999). Theoretical and empirical review of multinomial process tree modeling. Psychonomic Bullentin & Review, 6, 57-86. Brown, J. (1958). Some tests of the decay of immediate memory. Quarterly Journal of Experimental Psychology, 10, 12-21. Bucholz, K., Cadoret, R., Cloninger, C. R., Dinwiddie, S., Hasselbrock, V., Nurnberger, J., et al. (1994). A new
1870
Boundary Separation
Drift Rate Grp1 Grp2 Grp3
Money, Equal
Grp1 Grp2 Grp3
Money, Reward
Grp1 Grp2 Grp3 Grp1 Grp2 Grp3 Grp1 Grp2 Grp3 Grp1 Grp2 Grp3
Money, Pun.
Shock, Equal
Shock, Reward
Shock, Pun.
Money, Equal
Experimental Condition
Money, Reward
Money, Pun.
Shock, Equal
Shock, Reward
Shock, Pun.
Experimental Condition
Figure 2: Drift rates for hits and false alarms by diagnostic group and experimental condition. semistructured psychiatric interview for use in genetic linkage studies: A report of the reliability of the ssaga. Journal of Studies on Alcohol, 55, 149-158. Conway, A. R. A., & Engle, R. W. (1994). Working memory and retrieval: A resource-dependent inhibition model. Journal of Experimental Psychology, 123, 354-373. Conway, A. R. A., Kane, M. J., Bunting, B. F., Hambrick, Z. D., Wilhelm, O., & Engle, R. W. (2005). Working memory span tasks: A methodological review and users guide. Psychonomic Bulletin and Review, 12, 769-786. Endres, M. J., Rickert, M. E., Bogg, T., Lucas, J., & Finn, P. R. (2011). Externalizing psychopathology and behavioral disinhibition: Working memory mediates signal discriminability and reinforcement moderates response bias in approach-avoidance learning. Journal of Abnormal Psychology. Finn, P. R. (2002). Motivation, working memory, and decision making: A cognitive-motivational theory of personality vulnerability to alcoholism. Behavior, Cognition, and Neuroscience Review, 1, 183-205. Finn, P. R., Mazas, C. A., Justus, A. N., & Steinmetz, J. E. (2002). Early-onset alcoholism with conduct disorder: Go / no go learning deficits, working memory capacity, and personality. Alcoholism: Clinical and Experimental Research, 19, 148-157. Finn, P. R., Miller, M., Rickert, M. E., Lucas, J., Bogg, T., Bobova, L., et al. (2009). Reduced cognitive ability in alcohol dependence: Examining the role of covarying externalizing psychopathology. Journal of Abnormal Psychology, 2009, 100-116. Gomez, P., Ratcliff, R., & Perea, M. (2007). A model of the go/no-go task. Journal of Experimental Psychology, 136, 389-413. Lee, M. D., & Wagenmakers, E.-J. (2009, August). A workshop in bayesian modeling for cognitive science. 42th Annual Meeting of the Society for Mathematical Psychology, Amsterdam, Netherlands.
Figure 3: Boundary separation parameters by diagnostic group and experimental condition. Lunn, D. J. (2003). Winbugs development interface (wbdev). ISBA Bulletin, 10, 10-11. Lunn, D. J., Thomas, A., Best, N., & Spiegelhalter, D. (2000). Winbugs - a bayesian modeling framework: Concepts, structure, and extensibility. Statistics and Computing, 10, 325-337. Matzke, D., & Wagenmakers, E.-J. (2009). Psychological interpretation of exgaussian and shifted wald parameters: A diffusion model analysis. Psychonomic Bulletin and Review, 16, 798-817. Newman, J. P., & Lorenz, A. R. (2003). Response modulation and emotion processing: Implications for psychopathy and other dsyregulatory psychopathology. In R. J. Davidson, K. R. Scherer, & H. H. Goldsmith (Eds.), Handbook of affective sciences (p. 904-929). New York: Oxford University Press. Newman, J. P., Widom, C. S., & Nathan, S. (1985). Passive avoidance in syndromes of disinhibition: Psychopathy and extraversion. Journal of Personality and Social Psychology, 5, 1316-1327. Ratcliff, R. (1978). A theory of memory retrieval. Psychological Review, 85, 59-108. Ratcliff, R., Gomez, P., & McKoon, G. (2004). Diffusion model account of lexical decision. Psychological Review, 111, 159-182. Smillie, D. L., & Jackson, C. J. (2006). Functional impulsivity and reinforcement sensitivity theory. Journal of Personality, 74, 48-84. Wechsler, D. (1981). Manual for the wechsler adult intelligence scale (rev.). New York: The Psychological Corporation. Wechsler, D. (1997). Wechsler adult intelligence test-iii. The Psychological Corporation, Harcourt Brace and Co. Yechiam, E., Goodknight, J., Bates, J., Busemeyer, J. R., Dodge, K. A., Pettit, G. S., et al. (2006). A formal cognitive model of the go / no-go discrimination task: Evaluation and implications. Psychological Assessment, 18, 239-249.
1871