Modeling speaker variation in cues to prominence using the Bayesian information criterion Tim Mahrt1 , Jennifer Cole1 , Margaret Fleck3 , Mark Hasegawa-Johnson2 1
Department of Linguistics, 2 Department of Electrical and Computer Engineering, 3 Department of Computer Science, University of Illinois, Urbana-Champaign, Illinois
[email protected],
[email protected],
[email protected],
[email protected]
Abstract This study investigated speaker variation in the production of various acoustic cues of prominence, including duration and intensity measures. The Bayesian Information Criterion was used to specify a threshold distinction between cues that are linearly vs. piece-wise linearly predictors of the degree of perceived prominence. For all speakers, some features are linear and some features are discrete in the manner in which they cue prominence. However, the results also suggest that speakers differ in the number of prominence distinctions that they make. Under a metrical stress notion of hierarchically layered prominence, our result would suggest that some speakers do not exploit the full range of prominence distinctions offered in English. Index Terms: speech prosody, prominence, Bayesian Information Criterion, speaker variation, corpus linguistics
1. Introduction Functionally, prominence is used in English to mark focused constituents, to distinguish new information from old information, and to provide a rhythmic modulation over a sequence of words within a phrase. Phonetically, studies have shown that prominence can be realized through an increase in the duration of the stressed vowel, an increase in overall or sub-band intensity, vowel formants reflecting hyper-articulation (F2) and sonority expansion (F1), and a pitch excursion marking the presence of a pitch accent [1, 2, 3, 4, 5, 6]. Furthermore, there is also evidence that listeners use their expectations of prominence placement to perceive prominence [7]. There are several ways that one could represent the phonological notion of prominence. Prominence can be represented as a binary feature, where each word is either prominent or nonprominent. Another representation is offered by Metrical Stress Theory [8]. Under metrical stress theory, prosodic units are arranged in a strong-weak patterning and layered on top of each other in a hierarchical structure comprising at least two levels of prosodic phrases, prosodic words, syllables, feet, and mora. In this manner, prominence can be phonetically realized as a gradient property, varying in relation to the depth of embedding of the prominent element within its larger prosodic context. The results from our previous work, described in detail in the next section, support the hierarchical and gradient model of prominence, however, much of the variance between features in the results remained unaccounted for. One source of variability not explored in our previous study is speaker variability. Prior, we showed that, though all speakers cue phrasing by manipulating durational cues, speakers vary considerably in the degree to which they manipulate the different available cues to prominence [9]. The goal of the present study is to explore speaker
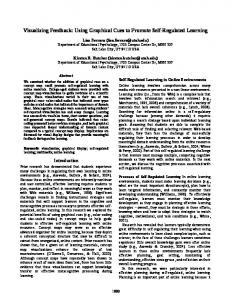
variability in the linear vs. discrete dependence of prominence on a variety of acoustic cues. Our research questions are as follows. Is there consistent use of prominence cues within speakers for different cues, and across speakers for the same cue? How can differences across speakers and phonetic cues be explained by the phonological model? 1.1. Past Work This study is based on prominence judgments for American English from a 35,000 word subset of the Ohio State Buckeye Corpus with speech samples from 27 different speakers [10]. These transcripts were obtained using Rapid Prosody Transcription –a method developed for obtaining word-level prominence judgments from naive, native speakers of English [11]. Groups of 15-20 native speakers of English were asked to transcribe short excerpts (15-60s) of the Buckeye Corpus. Listeners individually tagged each word they heard as prominent in real time, thereby performing a binary prominence judgment for each word. For each word, we took the number of subjects that labeled the word as prominent and divided it by the total number of listeners. We term this value as the p-score. Utilizing this method, a corpus of approximately five hours of data is annotated with p-scores. The audio files together with the word and phone segmentations and p-score annotation were used to measure the correlation between p-scores and various acoustic measures that have been reported in the literature to be correlated with prominence [9]. The overall pattern is that as the p-score increases (more listeners hear the word as prominent), the acoustic measure also gets stronger, which for the measures of duration and intensity (our focus here), means increased values. 1.2. Bayesian Information Criterion To further refine our understanding of the source of interspeaker variability in the patterning of prominence cues , we investigated the relationship between the distribution of p-scores and the distribution of each acoustic cue [12]. We asked if individual cues were used to signal a single gradient, or a binary, prominence distribution, by comparing models of the cue as a single Gaussian distribution or two Gaussian distributions. To obtain two distributions from a single cue we divided measures by their associated p-score, as shown in Figure 1. This process was done at 16 locations on the p-score continuum (corresponding roughly to values representing each possible number of listeners who may have marked that word as prominent). Comparing the single distribution model and each of the many two-distribution models, the best model was obtained by calculating the Bayesian Information Criteria (described in detail in
Feature Max Intensity of the Stressed Vowel Min Intensity of the Stressed Vowel Min Intensity of the Last Vowel RMS Intensity of the Last Vowel Max Intensity of the Last Vowel Stressed Vowel Duration Duration of the Last Vowel Log Stressed Vowel Duration Log Duration of the Last Vowel Word Duration Log Word Duration
r 0.154 0.155 0.198 0.198 0.198 0.205 0.220 0.239 0.240 0.476 0.498
Table 1: Table showing a positive correlation between acoustic features and p-scores through Pearson’s r. All correlations were found to be statistically significant with p < 0.05.
modeled by two. Furthermore, for those cues best modeled by two distributions, there were very different p-score thresholds between cues. This result suggests that either prominence is a gradient feature or speakers do not utilize the same set of prominence cues, or possibly a combination of these two explanations. It is this outstanding issue that the current study investigates by conducting a BIC analysis on each feature for individual speakers.
2. Methodology and Results 2.1. Features Figure 1: Schematic of method for partitioning features (randomly generated data shown here). Note that the example data contains data sampled from two distinct Gaussian populations. Further note that these two distributions cannot be seen in the 1D histogram. The first step to creating two distributions for use in the BIC analysis is to pair together feature values with their associated p-scores. This can be visualized in a 2D histogram. From here, we choose some p-score threshold (e.g. 0.4). All of the feature values associated with a p-score less than or equal to that threshold are isolated in a separate distribution from those feature values associated with a p-score greater than the threshold.
Section 2.2.2). If a cue was best modeled by two distributions, with one distribution associated with low p-scores (non-prominence) and the other associated with high p-scores (prominence) this would suggest that this cue operates in a binary fashion. In contrast, a single distribution is equivalent to a linear relationship between p-score and acoustic cue and would be consistent, for example, with a notion of hierarchically layered prominence. Note that if we expect that these cues all contribute the same information to the perception of prominence and that speakers act in a uniform manner, then we would expect that all features would be best modeled in the same way (i.e. they would all be best modeled by a single distribution or all best be modeled by two distributions). Further, if the best model for all cues uses two Gaussian distributions, we would expect that the p-score threshold dividing those two distributions would be the same for each cue. Contrary to our hypothesis, we found that some cues were best modeled by a single distribution and others were better
Various acoustic measures that were found to be significantly correlated with perceived prominence (p-scores) were used for this analysis, including measures from the stressed vowel and last (word-final) vowel of the target word, and the whole target word. For duration of the last vowel and the whole word we used timestamps provided by the phoneme-level transcriptions in the Buckeye corpus. The Buckeye corpus does not contain stress information, so additional work was needed to extract the duration of the stressed vowel. Using the International Speech Lexicon (ISLEX) dictionary, which contains phoneme-level dictionary pronunciations with stress markings, we were able to estimate the location of the vowel carrying primary stress and use that phoneme index within the Buckeye phoneme-level transcriptions to calculate the stressed vowel duration. A second set of duration measures was calculated by taking the log values of all the raw duration measures. We also calculated the minimum, maximum, and RMS intensity within the stressed vowel, last vowel, and target word. The raw intensity was extracted automatically using a praat script which sampled the sound files at 1 ms timesteps. In total we used four duration measures, four log duration measures, and twelve intensity measures for a total of twenty features. Correlation analyses were done for each measure to test for significant and positive correlations with our dataset (which was expanded from the dataset used in our earlier work [4, 9]). Any measure that was not significantly correlated with p-scores was discarded, which left eleven features to be analyzed. Table 1 summarizes the acoustic measures that were found to be positively correlated with p-scores. These define the feature set for the modeling experiment described below.
2.2. Model Fitting Criterion For each feature we compared models based on different partitions of the feature (the acoustic cue) as produced by individual speakers. Partitions were made as shown in Figure 1. We first considered the original distribution as a distinct model. Then, for sixteen unique p-scores, with values ranging between 0 and 1, we used the p-score as a threshold for splitting the distribution of the acoustic cue. All of the cue values associated with a p-score less than or equal to that threshold were placed in one distribution and all of the cue values associated with a p-score higher than that value were placed in another distribution. This strategy was motivated by the idea that if prominence is binary, then we might expect to have two populations within the distribution of acoustic cue values, where one population is associated with low p-scores and one population is associated with high p-scores. Furthermore, assuming the feature is binary, we do not know where such a threshold should be made, thus, we run our analysis over every unique p-score value. 2.2.1. Fitting Data to a Model A Gaussian distribution is characterized by a mean and a covariance matrix. For a given set of data we can calculate a mean and a covariance matrix, thus “fitting” our data to the Gaussian defined by those parameters. If p-scores are linearly dependent on an acoustic cue, then the entire range of p-scores will be well modeled by one Gaussian distribution. If the dependence is non-linear e.g., quantile, then the data will be better modeled by a two-Gaussian split. This process can be continued until the set of Gaussian distributions perfectly represents the data. Note however, that increasing the number of Gaussian distributions increases the complexity of the model. To find the best model, we can use a log likelihood estimate if the number of distributions in our two models is the same. In this study, however, we compared a model with a single distribution and several models with two distributions. Thus, we used the Bayesian Information Criterion (BIC) (eq. 1).
tive, the improvement in fit is less than expected. This is not a significance test; ∆BIC > 0 does not mean that Λ2 is rejected with 95% confidence, it only means that Λ1 is better. Within a given feature, after calculating the BIC score for each model, we calculated Equation 2, where Λ2 , the baseline, was the model with a single Gaussian distribution. From these ∆BIC scores, the highest score indicates that the associated p-score threshold is the optimal partition point. Note that any ∆BIC score with a value greater than zero suggests that this feature is better modeled by a two-Gaussian distribution. If none of the ∆BIC scores is higher than zero, this suggests that this feature is better modeled by a single Gaussian distribution. 2.3. Speaker Variability Different speakers sometimes produce prominence in different ways (though the inter-speaker differences were less than we expected). After calculating the optimal BIC partitions, to make patterns more clear, we placed the optimal p-scores into five bins: 0, 0.25, 0.5, 0.75, 1.0 where p-scores were less than or equal to the bin they were placed in. We then observed the data, looking at speaker variation within each feature to determine how different speakers use a given cue in the feature set to signal prominence. For each feature, we tallied the binned optimal p-score thresholds to investigate how features in how speakers used these features. (Figure 2). We also inverted the observation and looked at the feature variation within each speaker (Figure 3).
2.2.2. Bayesian Information Criterion The problem of determining where to partition the acoustic cue distribution to model its relation to p-scores is qualitatively similar, in some ways, to the problem of segmenting a distribution of meeting-room speech into segments (partitions) corresponding to different talkers. The problem of speaker segmentation is often solved using a Bayesian Information Criterion (BIC) [13]. The BIC measures the mutual information between the parameters of a given model and the observed data, under the assumption that the parameters themselves are random variables generated by randomly resampling the training data. The BIC thus takes the form of a penalized log likelihood function, BIC(X; Λ) = logF (X; Λ) − (k/2)ln(n) (1) where Λ is a parameterized distribution model containing k parameters, and X is a dataset containing n observations. The likelihood F (X; Λ) is guaranteed to increase when the dataset is segmented, and separate model parameters are trained using each half of the data. The entropy penalty (k/2)ln(n) measures, in effect, the expected increase in the log likelihood. Thus we can compare two models by computing ∆BIC = BIC(X; Λ1 ) − BIC(X; Λ2 ) (2) If ∆BIC is positive, it means that model Λ1 fits X better than Λ2 by a greater-than-expected amount; if ∆BIC is nega-
Figure 2: Histograms for eight cues, showing the percent of speakers that use that cue to signal gradient Prominence distinctions, and binary distinctions at low, mid, or high P-score thresholds for 27 speakers.
3. Discussion Considering the data in Figure 2, we see that all features are most commonly cued by speakers through two distributions with a low p-score threshold, with the exception of the log duration measures and the word duration, which are most commonly cued by a single distribution. Furthermore, we see some variation in p-score threshold in most features. We observed how features were being used by individual speakers. Our results are summarized in in Figure 3. We found that across all speakers, there are some features that are best modeled by two distributions with a low p-score threshold. Thus, all speakers make a binary prominent and non-prominent distinction with a low p-score threshold. Some speakers also make a binary distinction with a high p-score threshold or a mid p-score threshold. At the same time, everyone has some
nence. Our findings show that while there is some variation in how speakers cue prominence, these variations are not fundamentally different–all speakers signal prominence using some cues to express gradient prominence distinctions and other cues to express binary distinctions. Our results support a model of prominence as a gradient feature in the phonological representation, but variation in our results suggests that not all speakers are exploiting all of the possible distinctions in degree of prominence made available by the prosodic hierarchy. Further studies will continue to investigate the issue of variation in prominence production.
5. Acknowledgements
Figure 3: Example histograms for three speakers, showing the breakdown of 11 cues as gradient or discrete with low, mid, or high p-score thresholds. Speakers are clustered by the group they fall into. The twelve speakers in Group A) use some cues gradiently and some discretely, with a low p-score threshold. The seven speakers in Group B) use some cues gradiently and some discretely, with both low and mid p-score thresholds. The four speakers in Group C) use some cues gradiently and some discretely, with both low and high p-score thresholds. Three speakers did not fall into these three groups utilizing some cues gradiently and some discretely with low, mid, and high p-score thresholds. features that are best modeled by a single distribution. Thus, all speakers also use cues that are associated with prominence in a gradient manner. The results presented here conform with the result found in our prior study. Some of the variance in our previous study may be explained by speaker variation, as speakers do vary to a degree in how they cue prominence. However, by and large, within a feature, speakers are mostly consistent as shown in Figure 2. Thus, different acoustic cues are utilized roughly consistently across speakers as either binary or gradient. As with our previous work, we found some features were best modeled as binary across a low threshold, binary across a high threshold, and gradient. Our results for individual speakers confirms that no one uses a uniformly gradient or uniformly binary strategy in the production of prominence. If we consider a metrical stress notion of prominence, where prominence is hierarchically layered, one possible way to account for the plurality of strategies is to consider that some speakers “flatten” the hierarchy. In other words, they do not fully exploit the possible range of prosodic levels. If we consider the nuclear stress/prominence to be one extreme on a “prominence continuum” and an unstressed word that carries given information on the other end, our results would suggest that not all speakers are utilizing the levels between these two extremes. More work is needed to investigate the status of the prominence feature in speech comprehension and production, and in the cognitive representations of individual speakers. The role of the listener as a source of variance also needs to be investigated.
4. Conclusion In this study we have attempted to refine our understanding of variance across speakers in the production of prosodic promi-
This study is supported by NSF IIS-0703624 to Cole and Hasegawa-Johnson. For their varied contributions, we would like to thank the members of the Illinois Prosody-ASR research group.
6. References [1]
Kochanski, G., Grabe, E., Coleman, J. and Rosner., B., “Loudness predicts prominence: Fundamental frequency lends little”, The Journal of the Acoustical Society of America, vol 118, 2005.
[2]
Ladd, D.R., “Intonational phonology”, Cambridge University Press, 2008.
[3]
Calhoun, S., “Information structure and the prosodic structure of English”, University of Edinburgh, 2006.
[4]
Mo, Y., Cole, J. and Hasegawa-Johnson, M., “Prosodic effects on vowel production: Evidence from formant structure”, Proceedings of Interspeech 2009, Brighton, UK.
[5]
Cole, J., Mo, Y. and Hasegawa-Johnson, M., “Signal-based and expectation-based factors in the perception of prosodic prominence”, Laboratory Phonology, 1, 425452, 2010.
[6]
Fant, G., Kruckenberg, A. and Liljencrants, J., “Acoustic-phonetic analysis of prominence in Swedish”, Intonation. Analysis, Modelling and Technology. Kluwer Academic Publishers, 55-86, 2000.
[7]
Wagner, P., “Great expectations–Introspective vs. perceptual prominence ratings and their acoustic correlates”, In Ninth European Conference on Speech Communication and Technology, ISCA, 2005.
[8]
Hayes, B., “Metrical stress theory: Principles and case studies”, University of Chicago Press, 1995.
[9]
Mo, Y., Cole, J. and Hasegawa-Johnson, J., “How do ordinary listeners perceive prosodic prominence? Syntagmatic vs. paradigmatic comparison”, Poster presented at the 157th Meeting of the Acoustical Society of America, Portland, Oregon, 2009.
[10] Pitt, M. A., Dilley, L., Johnson, K., Kiesling, S., Raymond, W., Hume, E. and et al., “Buckeye corpus of conversational speech (2nd release)”, [www.buckeyecorpus.osu.edu] Columbus, OH: Department of Psychology, Ohio State University (Distributor), 2007. Retrieved March 15, 2006. [11] Mo, Y., Cole, J. and Lee, E.K., “Naive listeners prominence and boundary perception”, Proc. Speech Prosody, Campinas, Brazil, 735–738, 2008. [12] Mahrt, T., Huang, J.T., Mo, Y., Fleck, M., Hasegawa-Johnson, M. and Cole, J., “Optimal models of prosodic prominence using the Bayesian information criterion”, Proceedings of Interspeech 2011, Florence, IT. [13] Moschou, V., Kotti, M., Benetos, E. and Kotropoulos, C., “Systematic comparison of BIC-based speaker segmentation systems”, IEEE Workshop on Multimodal and Multimedia Signal Processing, 2007.