Apr 29, 2016 - ... of Sao Paulo, Sao. Paulo, Brazil. ... forecast system for the Metropolitan Area of Lima-Callao. (MALC), Peru, that is .... structural characteristics of water-soluble organic carbon. (WSOC) in ... available computer resources” [11]. .... PM2.5 observations at 4 monitoring sites in Lima: San Borja. (SBJ), Santa ...
International Journal of Applied Engineering Research ISSN 0973-4562 Volume 13, Number 11 (2018) pp. 10129-10141 © Research India Publications. http://www.ripublication.com
Modeling Study of the Particulate Matter in Lima with the WRF-Chem Model: Case Study of April 2016 Odón. R. Sánchez-Ccoyllo1*, Carol. G. Ordoñez-Aquino2, Ángel G. Muñoz3, Alan Llacza2, María Fátima Andrade4, Yang Liu5, Warren Reátegui-Romero6, Guy Brasseur7 School of Environmental Engineering, Universidad Nacional Tecnológica de Lima Sur (UNTELS), Sector 3 Grupo 1A 03 - Cercado (Av. Central and Av. Bolivar), Villa El Salvador, Lima, Peru.
1
National Meteorology and Hydrology Service (SENAMHI), Lima, Peru.
2 3 4
Research Institute for Climate and Society (IRI). The Earth Institute. Columbia University. New York, NY, USA.
Department of Atmospheric Science, Institute of Astronomy, Geophysics and Atmospheric Sciences, University of Sao Paulo, Sao Paulo, Brazil. 5 6
Department of Environmental Health, University of Emory, Atlanta, GA, USA.
Chemical and Textile Engineering Department (FIQT), National University of Engineering (UNI), Lima, Peru. Max Planck Institute for Meteorology, Germany.
7
*Correspondence to: Odón. R. Sánchez-Ccoyllo
Abstract
INTRODUCTION
The Weather Research and Forecasting-Chemistry (WRFChem) model was used to develop an operational air quality forecast system for the Metropolitan Area of Lima-Callao (MALC), Peru, that is affected by high particulate matter concentrations episodes. In this work, we describe the implementation of an operational air quality-forecasting platform to be used in the elaboration of public policies by decision makers, and as a research tool to evaluate the formation and transport of air pollutants in the MALC. To examine the skills of this new system, an air pollution event in April 2016 exhibiting unusually elevated PM 2.5 concentrations was simulated and compared against in situ air quality measurements. In addition, a Model Output Statistic (MOS) algorithm has been developed to improve outputs of inhalable particulate matter (PM10) and fine particulate matter (PM2.5) from the WRF-Chem model. The obtained results showed that MOS increased the accuracy in terms of mean normalized bias for PM10 and PM2.5 from -43.1% and 71.3% to 3.1%, 7.3%, respectively. In addition, the mean normalized gross error for PM10 and PM2.5 were reduced from 48% and 92.3% to 13.4% and 10.1%, respectively. The WRF-Chem Model results showed an appropriate relationship between of temperature and relative humidity with observations during April 2016. Mean normalized bias for temperature and relative humidity were approximately - 0.6% and 1.1% respectively. In addition, the mean normalized gross error for temperature and relative humidity were approximately 4.0% and 0.1% respectively. The results showed that this modelling system can be a useful tool for the analysis of air quality in MALC.
“Elevated aerosol concentrations exert adverse impacts on ecosystems and human health, reduce visibility and affect the radiative balance through direct and indirect effects” [1]. Studies have shown a direct correlation between heavy traffic in Lima and adverse health effects. “One study found that children ages from 13 to 15 living within 100 meters of a heavily trafficked avenue are twice as likely to suffer asthma symptoms” [2]. Carbajal et al. [3] “conducted the study to determine if the exposure to the vehicular traffic was associated to the prevalence of asthma in population living in the North Zone of Lima”. Carbajal et al. [3] “observed a significant association between traffic flow and asthma among schoolchildren residing in the North Zone of Lima”. “In the 6 to 7 years old group, there was a significant increase in the medical diagnosis of asthma, cumulative wheezing and current wheezing as the traffic flow index increased” [3]. “In the 13 to 14 years old group, there was a significant increase in the medical diagnosis of asthma and nocturnal coughing with increasing exposure to the traffic index” [3]. “These studies together show a pattern of dangerous health effects associated with the high traffic density and the forms of transportation currently in use in Lima” [4].
Keywords: WRF-Chem model, Fine particulate matter, air pollution in Lima, particulate matter, Model Output Statistic, air quality model
Lima, the capital city of Peru is the country’s commercial and industrial centre. The Metropolitan Area of Lima-Callao (MALC) is located at 770 W and 120 S by the central coast of Peru and it has an area of 2819.3 km2 [5] and has 10.419 million inhabitants [6]. “Lima is located in a desertic area, bounded to the northeaster by a landscape that ranges from a large alluvial plain formed by the valleys of the Chillón, Rímac and Lurín rivers to a landscape of hills and finally mountains in the extreme east, which are located at more than 1000 m above sea level” [7]; [8]. “Every day citizens of Lima travel across the city for work or personal reasons, like people
10129
International Journal of Applied Engineering Research ISSN 0973-4562 Volume 13, Number 11 (2018) pp. 10129-10141 © Research India Publications. http://www.ripublication.com all over the world. Yet they face more obstacles in their daily travels, with a good portion of their time wasted sitting on overcrowded, unregulated, dangerous buses in traffic. Thus, the average person in Lima spends four hours a day commuting to and from work” [4]. This inhibits citizens living in lower-income areas from accessing potential jobs in wealthier parts of the city and damages the health of all citizens by polluting the air [4]. “The existing transportation forms within Lima, especially informal public transportation, result in congestion and safety issues and place a greater burden on the poor. A vehicle runs at an average of 3 km h-1. in main avenues of Lima” [4]. “Traffic congestion makes the average commute in Lima over an hour each way and costs more than $1 billion a year in lost output and health problems caused by pollution. 52 percent of Lima’s buses and combis are over 20 years old” [4]. As a result, elevated inhalable particulate matter (airborne particles with an aerodynamic diameter less than 10 micron, PM10) and fine particulate matter (airborne particles with an aerodynamic diameter less than 2.5 micron, PM2.5) concentrations are a persistent air pollution problem in the Metropolitan Area of Lima-Callao (MALC), Peru [9]. Both PM10 and PM2.5 levels routinely exceed the 24-hour standard of 100 µg m-3, and 50 µg m-3 respectively established by the Ministerio del Ambiente del Peru (MINAM, Ministry of the Environment of Peru). In terms of the seasonal cycle, the month of April normally exhibits elevated concentrations of PM10 and PM2.5 because atmospheric conditions over the Pacific Ocean induce a lowering of the boundary layer encompassed by very slow winds (< 1.5 m/s) that inhibit mixing and ventilation [10]. In order to provide better tools for decision makers, an operative air quality forecast system was developed, with a particular focus on hourly prediction of concentration groundlevel PM2.5 and PM10, ozone, carbon monoxide, sulfur dioxide and nitrogen oxides. The air quality forecasts are available freely for consultation at the site: http://www.senamhi.gob.pe/?p=calidad-de-aire-numerico and at the site https://ruc.noaa.gov/wrf/wrfchem/Real_time_forecasts.htm. Air pollution is being forecasted in Lima with the WRF-Chem (Weather Research and Forecast with Chemistry) model [11], [12]. The forecast system uses a combination of meteorological fields, topography data and emission module based on measurements of emission factors and ambient concentrations [12]. “The spatial representation of emission was built using the traffic and street maps as a proxy, to construct the module of mobile emission” (for details see [13]; [12]). The main source of air pollution is the automotive park composed of 1´ 450, 804 vehicles that are more than 14 years old [14]; [15]. “The fleet consists of light duty vehicles (47.7%), taxis (7.9%), pickup trucks (27.6%), buses (3.1%), trucks (12.3%) and motorcycles (1.4%)” [8]. In MALC, the vehicles total emissions inventory are for CO (137 891 Tons/year), SO2 (7 022 Tons/year), NOx (33116 Tons/year), VOC (18 225 Tons/year), PM10 Tons/year), PM2.5 (2993), CO2 (3 879 620 Tons/year), Pb (419 Tons/year) [16]. “In MALC, there are 108 automobiles per thousand inhabitants,
which makes of Lima one of the least motorized capitals of South America. For example, the ratio of automobiles per thousand inhabitants is 172 in Santiago, Chile; and 335 in Buenos Aires, Argentina” [14]. “Vehicular emissions in Lima appear to contribute between 70% and 80% of the air pollution” [3]. MALC is under the influence of South Pacific Anticyclone during all the year, resulting in prevailing southerly and southwesterly winds and persistent atmospheric stability leading high concentrations of PM10 and PM2.5 [7]. There are few studies addressing particulate air pollution in Lima [8]. Duarte et al. [8] “Investigated and compared the structural characteristics of water-soluble organic carbon (WSOC) in atmospheric aerosols collected in Lima”. “For the Lima city , the relative contribution of the four proton functional groups vary in the following order: the saturated aliphatic protons are the most important component (60%), followed by unsaturated (18%) and oxygenated (12%) aliphatic protons, and a less contribution from aromatic protons (10%). The source attribution in Lima confirmed the mixed contributions of biological material (e.g., pollen and fungal spores), secondary formation and urban emissions” [8]. Regarding chemical transport models (CTMs), no applications can be found in the scientific literature in MALC. Thus, in this work many difficulties had to be overcome, with the deficiency in the emission inventory being the worst, in addition to the difficulties in simulating meteorological fields over an area of complex terrain, with significant gradients. “Numerous studies have demonstrated the benefit of adjusting site-specific air quality model predictions using observational data to reduce systematic model error (bias)” [17]. “There are three reasons why statistical reinterpretation of dynamical Numerical Weather Prediction (NWP) output is useful for practical weather forecasting: (a) there are important differences between the real world and its representation in NWP models, (b) the NWP models are not complete and true representations of the workings of the atmosphere, and their forecasts are subject to errors and (c) the NWP models are deterministic. That is, even though the future state of the weather is inherently uncertain, a single NWP integration is capable of producing only a single forecast for any meteorological element, given a set of initial model conditions” [18]. The Model Output Statistic-MOS [19]; [20] is a type of statistical post-processing, a class of techniques used to improve numerical weather models' ability to forecast by relating model outputs to observational or additional model data (https://www.weather.gov/mdl/mos_home); [21]. The objectives of this work were the following: (i) evaluate the performance of the WRF-Chem model configurations in representing the meteorological and air quality variables associated with elevated concentrations of PM2.5 during April 2016, and (ii) describe the air pollution forecast system developed for the Metropolitan Area of Lima-Callao. The WRF- Chem model and its configuration are described in Section 2. The model evaluation is presented in Section 3. The model 10130
International Journal of Applied Engineering Research ISSN 0973-4562 Volume 13, Number 11 (2018) pp. 10129-10141 © Research India Publications. http://www.ripublication.com results and discussions are presented in Section 4; and the conclusions are summarized in Section 5.
WRF-chem model configuration
METHODS In this study, we used the WRF-Chem model version 3.8.1 that is described below. WRF-Chem model description and configuration “The WRF-Chem is a non-hydrostatic mesoscale numerical weather prediction system designed for atmospheric research and operational forecasting” [11]. “The WRF-Chem has a meteorological module coupled on-line with a chemistry module” [11]. “This chemistry module is an atmospheric chemistry approach for representing gaseous, aerosol, and aqueous chemistry processes” [13]. “Various user-selected combinations of chemistry schemes are available to represent the chemical and physical processes of gases and aerosol, such as dry deposition; biogenic and anthropogenic emission; biomass burning; and aerosol schemes” [13]. A detailed description of the WRF-chem model can be found on the website (http://ruc.noaa.gov/wrf/wrf-chem/). “The gas-phase chemistry and aerosol modules employed in this study are the Regional Acid Deposition Model, version 2 (RADM2) [22] and the Modal Aerosol Dynamics Model for EuropeSecondary Organic Aerosol Model (MADE-SORGAM) [23], respectively. The RADM2 mechanism is a compromise between chemical detail, accurate chemical predictions, and available computer resources” [11]. “The inorganic species included in the RADM2 mechanism are 14 stable species, 4 reactive intermediates, and 3 abundant stable species (oxygen, nitrogen and water). The RADM2 mechanism represents organic chemistry through a reactivity aggregated molecular approach” [24]. “Similar organics compounds are grouped together in a limited number of model groups through the use of reactivity weighting [25]. This study considered the assimilation’s method AAS4 of WRF-Chem with NCL for visualizing of the model outputs” [12].
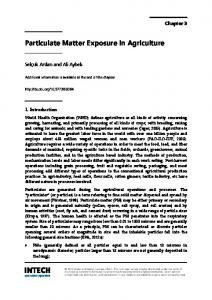
Figure 1. Area of the 5 km modeling domain showing of measurements sites and WRF topography elevation (m). Numbers 1-4 represent sites with information on particles: 1 is SBJ, 2 is STA, 3 is SJL, 4 is CRB. While 5 represents the location of the CDM´s climatological station.
Figure 1 shows the 250 x 250 km study area centered in Lima. The domain is horizontally divided into a 5 x 5 km2 regular grid such as described by Sánchez-Ccoyllo et al. [26]. The number of vertical grids used was 27 and the number of horizontal grids was 50 points x 50 points. Initial and boundary meteorological conditions were obtained from the National Centers for Environmental Prediction (NCEP), Final Analysis (FNL) data set with 0.250 of grid spacing, 26 vertical levels and are available FNL every 6 hours: 00:00, 06:00, 12:00 and 18:00 UTC (http://rda.ucar.edu/datasets/ds083.3/). Parameters include surface pressure, sea level pressure, geopotential height, temperature, sea surface temperature, soil values, ice cover, relative humidity, u- and v- winds, vertical motion, vorticity and ozone profiles. In order to exemplify the application, the period from 28 March to 29 April, 2016 was chosen as the modeling period. To overcome the impacts of initial conditions, 3 days were simulated and considered as spin-up time. The configurations of the model WRF/Chem and those that are running operationally are presented in Table 2.
Table 1. Motor vehicles emissions inventory in the Metropolitan Area of Lima-Callao (Tons/year) Vehicle type Light Vehicles Taxis Pick up trucks Bus Trucks Motorcycles Total Source: Adapted from [16]
CO 36204 39948 19939 8387 3356 30057 137891
SO2 529 487 435 4798 755 18 7022
NOx 3879 4559 1852 13614 9059 153 33116
VOC 3879 4559 3129 2525 1072 3061 18225
10131
PM10 274 275 241 1586 893 2 3271
PM2.5 248 249 219 1456 820 1 2993
CO2 619066 683255 336983 1853521 328288 58507 3879620
Pb 149 151 84 0 0 35 419
International Journal of Applied Engineering Research ISSN 0973-4562 Volume 13, Number 11 (2018) pp. 10129-10141 © Research India Publications. http://www.ripublication.com Anthropogenic emissions in Lima Emissions are key factors affecting the accuracy of air quality modeling results [27], especially for the regions where the main source is the mobile fleet like in the case of Lima, impacted by the on-road vehicle fleet emissions. The vehicles emissions inventory for the Metropolitan Area of Lima-Callao for CO, SO2, NOx, VOC, PM10, PM2.5, CO2 and Pb are presented in Table 1. The anthropogenic emissions of trace gases and particulate matter in a 5 km horizontal resolution grid domain were considered to include emissions only coming from on- road vehicles through the use of a vehicular emissions model developed by the IAG-USP Laboratory of Atmospheric Processes [13]; [12]. “This model does not include point sources nor biogenic sources, and considers the number of vehicles, vehicular emissions factors, and average driving kilometers for vehicle per day as basic parameters for the calculations of exhaust and evaporative emissions considering different vehicles types and different fuel types" [12]. For the spatial distribution of NO, NO2, CO, SO2, VOCs, PM10 and PM2.5 emissions (see Figure 2), it is assumed that the vehicles within the modelling domain were distributed proportional to the road length in each grid cell [13]; [12]. Road length was calculated as the sum of five types of road (motorway, trunk, primary, secondary and tertiary) within each grid cell. The road map is available on the OpenStreetMap project and extracted from the Geofabrik’s free download server (http://download.geofabrik.de/) [13]; [12]. Table 2. Model configuration options in the WRF/Chem version 3.8.1 simulations in Lima Attributes
Model configurations
Figure 2. Emission rates for NO at 1300 UTC in the 5 km modeling domain in Lima
The calculation of total emission in each grid cell where the road density is non-zero proceeds according to the following equation: E=N*FE*IU
(1)
where: E is vehicular emission in g day-1 N is the number of vehicles
Simulation period
April 2016
FE is vehicular emissions factors in g km-1
Domain
Lima, Peru
IU is average driving kilometers for vehicle per day
Short-wave radiation
Goddard
Long-wave radiation
Rapid radiative transfer model
Boundary layer
Yonsei University’ s cheme
Land-surface
Noah Land Surface Model
Cumulus cloud
Grell three-dimensional ensemble cumulus scheme
The total number of vehicles (1, 450, 804) was obtained on the basis of data for 2013 [15]. Emissions factors for six different vehicle types (light-duty vehicles, taxis, pickup trucks, bus, trucks, motorcycles) are shown in Table 3. The proportional distribution of vehicles is shown in Table 4, and both were obtained from PROTRANSPORTE reports [16]. For each type of vehicle, an average intensity of use was estimated from PROTRANSPORTE reports [16], as shown in Table 5.
Cloud microphysics
Lin
Table 3. Vehicular emission factor for each type of vehicle in g km-1
Photolysis scheme
Madronich photolysis (TUV)
Gas-phase mechanism
RADM2
Vehicle type CO Light Vehicles 13.977
NOx 1.3225
MP SO2 0.3390 0.2280
HC 1.7050
Aerosol option
MADE/SORGAN
Horizontal grid resolution
5 km
Center of grid
-12.4 ; -77.4
Taxis Pickup trucks Bus Trucks Motorcycles Source: [16]
1.4670 1.0335 9.59725 15.471 0.0630
0.3950 0.4250 1.43175 2.875 0.0000
2.2014 3.2380 2.4410 3.6965 13.3200
Physical options
Chemical options
10132
14.7548 23.1785 6.64825 8.6115 29.3800
0.23825 0.4600 3.98825 1.8450 0.0230
International Journal of Applied Engineering Research ISSN 0973-4562 Volume 13, Number 11 (2018) pp. 10129-10141 © Research India Publications. http://www.ripublication.com Table 4. Vehicle types and proportional of the number vehicles Vehicle type
Proportion of the total number of vehicles (%) 47.7 7.9 27.6 3.1 12.3 1.4
Light Vehicles Taxis Pickup trucks Bus Trucks Motorcycles Source: [16]
(MNGE) were used to evaluate the model performance in simulating aerosols and meteorological variables [29]; [26]. 1. Mean error bias (MB)
MB
1N
N
( M O ) i
i 1
(1)
i
2. Normalized mean bias (NMB)
NMB
1
( M O ).100% N
i
i
(2)
3. Mean Gross Error (MGE) Table 5. Intensity of use by vehicle type
MGE Vehicle type Use (km/day) Light Vehicles 21 Taxis 126 Pickup trucks 17 Bus 219 Trucks 19 Motorcycles 296 Source: Adapted from [16]
It is assumed that all the grid cells would have the same temporal distribution of mobile emissions for each day based on the results of Lents et al. [28]. The temporal distributions of light-duty vehicles- LDVs (two peaks during the day for LDVS at 0800 local time-LT and 1700, 1900 LT), and heavyduty diesel vehicles- HDVSs (two peaks during the day for HDVS at 0800 local time-LT and 1700, small peak at 1900 LT) are shown in Figure 3
i
i1
i
(3)
4. Mean Normalized Gross Error (MNGE)
MNGE
1
N
| ( N
M
1
O
i
|
i
O
).100%
(4)
i
and Mi and Oi are the model result and observed variables respectively. N is the number of samples [29]. MOS Methodology In this study, the coefficients a and b, which are used to improve the forecast, were evaluated using a linear regression with a linear function. It is also possible to use linear regression with non-linear functions. The calculation scheme is:
Oi a b * Mi Oi a b * Mi Mni a b * Mi Mni a b * Mi
(5) (5) (6) (6) ̅ 𝑖 are the average hourly values and 𝑀 ̅ 𝑛𝑖 is Where 𝑂̅i and 𝑀 ̅ 𝑖 are the average hourly values and 𝑀 ̅ 𝑛𝑖 is Where 𝑂̅i and 𝑀 the new hourly value improved. Following this method it thewas newpossible hourly value improved. Following this method to generate the new PM2.5 and PM10it was data possible to generate the new PM2.5 and PM10 data (see figure (see figure 4). 4).
10
8
Daily emission (%)
| ( M O ) |
N
6
4
2
RESULTS AND DISCUSSIONS
0 0
2
4
6
8
10 12 14 16 18 20 22
local time
Figure 3. Mobile emission hourly distribution, in each cell WRF-Chem model, for light-duty vehicles and heavy-duty vehicles in % (The values of daily emission were divided by factor 0.01)
Model evaluation in Lima The mean bias (MB), normalized mean bias (NMB), Mean Gross Error (MGE) and Mean Normalized Gross Error
Model performance was evaluated using the hourly PM 10 and PM2.5 observations at 4 monitoring sites in Lima: San Borja (SBJ), Santa Anita (STA), San Juan de Lurigancho (SJL) y Carabayllo (CRB). The air pollution data that were being considered for evaluation of the simulations in Lima are obtained by the SENAMHI (Servicio Nacional de Meteorología e Hidrología del Perú, National Service of Meteorology and Hydrology of Peru) air quality network. The location of the air quality stations and their characteristic are presented in Table 6. During the evaluation period (April 2016), the average concentration of PM10 was 56.4 µg m-3 for SBJ, 91.7 µg m-3 for STA, 108.6 µg m-3 for SJL, and 100.6 µg 10133
International Journal of Applied Engineering Research ISSN 0973-4562 Volume 13, Number 11 (2018) pp. 10129-10141 © Research India Publications. http://www.ripublication.com m-3 for CRB. The average concentration of PM2.5 was 18.0 µg m3 for SBJ, 33.4 µg m-3 for STA, 34.5 µg m-3 for SJL, and 32.8 µg m-3 for CRB (Table 7). The average 2016 PM10 concentration for monitoring stations (see Table 7a) were highest 95.4 µg m-3 for SJL, 88.1 µg m-3 for CRB, 80.5 µg m-3 for STA. The station with the lowest annual 2016 PM 10 concentration was 57.9 µg m-3 for SBJ. The hourly maximum 2016 PM10 concentration were highest 476.8 µg m-3 for STA and 564.4 µg m-3 for SJL They were followed by lower concentration at the SBJ (394.1 µg m-3) and CRB (312.0 µg m-3). It is important that the stations with the highest PM 10 concentration are located in the eastern and north part of the city of Lima (such as STA and SJL located at eastern and CRB located at north of Lima city) (see Figure 1). This trend is due to the pattern of persistent local winds entering from the coast with a South- Southwest direction, causing the pollution loads to be transferred to the eastern and northern, which are critical deposition areas [7]. For PM2.5 (see Table 7b), a similar pattern is observed in Lima. The highest average 2016
annual concentrations of PM2.5 are observed at STA (32.3 µg m-3), SJL (32.7 µg m-3) and CRB (29.5 µg m-3). The highest hourly maximum annual concentration of PM2.5 are also presented at STA (179.1 µg m-3), SJL (164.1 µg m-3), CRB (189.2 µg m-3) and SBJ (103.8 µg m-3. Figure 4 shows the comparison between the hourly measured and simulated values for PM10 and PM2.5 for the April 2016 period at average four air quality stations (SBJ, STA, SJL and CRB). In this figure, the model reproduces the diurnal pattern of observed PM10 and PM2.5 concentrations, but underpredicts observed peak of PM10 concentrations and overpredicts observed peak PM2.5 in April 2016 (in the morning at 0700 to 0900 hour local and at night from 18 to 21 hour local) concentrations. When the MOS technique is applied to the PM10 and PM2.5 forecasts, the ability of the WRF-Chem model improves quite a lot during the first hours of the day (0 to 06 local hours). Also, the corrected forecast of PM10 and PM2.5 with MOS reproduces the two peaks generated by traffic.
Table 6. Site code of SENAMHI air quality station, description, characteristic, coordinates available for evaluation of the modeling results in Lima. Code Name of station SBJ San Borja
Pollutants measured 1 h PM10, PM2.5, SO2, NO2, O3, CO
Site characteristic Residential
Longitude 77° 0' 27.96" W
Latitude 12° 6' 31.06" S
Elevation (m) 136
STA
Santa Anita
PM10, PM2.5, SO2, NO2, O3, CO
Vehicular
76° 58' 17.2" W
12° 2' 34.8" S
276
SJL
San Juan de Lurigancho
PM10, PM2.5, SO2, NO2, O3, CO
Vehicular
76° 59' 57.6" W
11° 58' 53.7" S
239
CRB
Carabayllo
PM10, PM2.5, SO2, NO2, O3, CO
Vehicular
77° 2' 1.1" W
11° 54' 7.9" S
190
Table 7. Annual and April 2016 for PM10 and PM2.5 concentration in µg m-3 by the stations under study in Lima. year a) PM10 2016 2016 2016 2016 2016 April 2016 April 2016 April 2016 April 2016 April 2016 b) PM2.5 2016 2016 2016 2016 2016 April 2016
variable
SBJ
STA
SJL
CRB
Mean Max Median Min SD Mean Max Median Min SD
57.9 394.1 51.9 4.9 30.9 56.4 156.3 52.8 16.8 21.8
80.5 476.8 75.0 6.1 35.6 91.7 317.9 83.8 32.5 38.6
95.4 564.4 89.0 8.8 40.4 108.6 564.4 98.1 37.8 49.6
88.1 312.0 85.1 11.0 35.7 100.6 267.8 97.4 19.5 39.0
Mean Max Median Min SD Mean
18.5 103.8 15.8 1.9 11.3 18.0
32.3 179.1 28.3 3.4 17.4 33.4
32.7 164.1 28.8 3.1 17.7 34.5
29.5 189.2 25.4 2.4 18.0 32.8
10134
International Journal of Applied Engineering Research ISSN 0973-4562 Volume 13, Number 11 (2018) pp. 10129-10141 © Research India Publications. http://www.ripublication.com variable Max Median Min SD Where SD is standard deviation
PM10 concentration (µg/m³)
year April 2016 April 2016 April 2016 April 2016
SBJ 65.0 16.4 4.4 8.4
STA 119.8 29.6 8.4 16.6
SJL 110.6 31.1 5.2 16.5
CRB 126.9 29.6 4.1 18.5
140 120 100 80 60 40 20 0
PM2.5 concentration (µg/m³)
0 1 2 3 4 5 6 7 8 9 10 11 12 13 14 15 16 17 18 19 20 21 22 23 Hours PM10 Mod PM10 MOS PM10 Obs
80 70 60 50 40 30 20 10 0 0 1 2 3 4 5 6 7 8 9 10 11 12 13 14 15 16 17 18 19 20 21 22 23 Hours PM2.5 Obs PM2.5 Mod PM2.5 MOS
Figure 4. Comparison between modeled and simulated hourly values for PM 10 y PM2.5 (in µg/m3) during the April 2016 in MALC. PM2.5 Obs is PM2.5 observed, PM2.5 Mod is PM2.5 predicted, and PM2.5 MOS is PM2.5 predicted applied MOS. Figures 5 and 6 are showing the daily observed and predicted temporal variations of PM10 and PM2.5 concentration at the 4 air quality stations (SBJ, STA, SJL and CRB) in Lima. In these figures, it is observed that the concentrations of particles located in sites more impacted by vehicular traffic such as
STA, SJL, CRB stations are higher than the concentrations found in the residential area and with presence of trees (e.g., see SBJ station). The simulated PM10 concentrations (uncorrected) were generally under-estimated when compared to measurements (Figure 5).
10135
International Journal of Applied Engineering Research ISSN 0973-4562 Volume 13, Number 11 (2018) pp. 10129-10141 © Research India Publications. http://www.ripublication.com
PM10 Concentration (µg/m3)
SBJ observed 165 predicted 115 MOS PM10 65 15 1 2 3 4 5 6 7 8 9 10 11 12 13 14 15 16 17 18 19 20 21 22 23 24 25 26 27 28 29 Day
PM10 Concentration (µg/m3)
observed 165
predicted
115
MOS PM10
STA
65 15 1 2 3 4 5 6 7 8 9 10 11 12 13 14 15 16 17 18 19 20 21 22 23 24 25 26 27 28 29 Day
PM10Concentration (µg/m3 )
observed 165 115
SJL
predicted MOS PM10
65 15 1 2 3 4 5 6 7 8 9 10 11 12 13 14D1a5y16 17 18 19 20 21 22 23 24 25 26 27 28 29
PM10 Concentration (µg/m3)
observed 165
predicted
115
MOS PM10
CRB
65 15 1 2 3 4 5 6 7 8 9 10 11 12 13 14 15 16 17 18 19 20 21 22 23 24 25 26 27 28 29 Day
Figure 5. The observed and predicted daily temporal variations of PM 10 concentration at four sites in Lima for the 5 km modeling domain. This under- prediction could be associated with an underestimation on the PM10 vehicular emission which is disregarded in this study such as industrial sources, dust resuspension, natural sources and biogenic sources. In addition, predicted surface winds were more intense than those
observed, leading to a dilution of aerosol particles in Lima. On the other hand, the PM2.5 concentrations simulated (uncorrected) were generally over-estimated when compared to measurements (Figure 6).
10136
International Journal of Applied Engineering Research ISSN 0973-4562 Volume 13, Number 11 (2018) pp. 10129-10141 © Research India Publications. http://www.ripublication.com
PM2.5 Concentration (µg/m3)
90 observed 60 30
PM2.5 Concentration (µg/m3)
predicted MOS PM2.5
1 2 3 4 5 6 7 8 9 10 11 12 13 14 15 16 17 18 19 20 21 22 23 24 25 26 27 28 29 Day 90 60
observed predicted
STA
MOS PM2.5
30
1 2 3 4 5 6 7 8 9 10 11 12 13 14 15 16 17 18 19 20 21 22 23 24 25 26 27 28 29 Day 90
PM2.5 Concentration (µg/m3)
SBJ
observed predicted MOS PM2.5
CRB
60 30
1 2 3 4 5 6 7 8 9 10 11 12 13 14 15 16 17 18 19 20 21 22 23 24 25 26 27 28 29 Day
PM2.5 Concentration (µg/m3)
90
observed predicted MOS PM2.5
SJL
60 30
1 2 3 4 5 6 7 8 9 10 11 12 13 14 15 16 17 18 19 20 21 22 23 24 25 26 27 28 29 Day Figure 6. The observed and predicted daily temporal variations of PM 2.5 concentration at four sites in Lima for the 5 km modeling domain.
This over-prediction could be associated with an overestimation on the PM2.5 vehicular emission that is disregarded in this study. But, the high concentrations of PM 10 and PM2.5 observed, whose variability and trends were reasonably well captured by the WRF-Chem model. When applying MOS the forecast of PM10 and PM2.5 improves a lot for the air quality stations SBJ, STA and SJL, since for CRB it improves
reasonably, but does not reproduce the daily variation of these atmospheric pollutants. To evaluate the WRF-Chem model against the measured of PM10 and PM2.5 concentrations, a model performance evaluation was carried out to complement the qualitative graphical time series analysis (Figures 4-6). A variety of statistical measures have been developed to quantitatively specify air quality model performance [30]. The US
10137
International Journal of Applied Engineering Research ISSN 0973-4562 Volume 13, Number 11 (2018) pp. 10129-10141 © Research India Publications. http://www.ripublication.com Environmental Protection Agency guideline [31] states that the performance evaluations results would be acceptable when normalized bias, and gross error statistics fall within the range (±) 5-15%, and 30-35%, respectively. Table 8 shows the performance evaluations result of the PM10 and PM2.5 modeling. For the whole period (April 2016), the normalized
bias with WRF-Chem model is -43.1% and 71.3% for PM10 and PM2.5, respectively, which indicate bad performance of WRF-Chem model (Table 8). While, the normalized bias after applied MOS is 3.1% and 7.3% for PM 10 and PM2.5, respectively, which indicate improve PM10 and PM2.5 forecast (Table 9).
Table 8. Comparison of species observations from four air quality stations in Lima before applied MOS. Statistical measure
SBJ
Bias (µg m-3) Gross error (µg m-3) Normalized Bias (%) Normalized Gross error (%)
STA
SJL
CRB
Total
PM10 -26.4
PM2.5 7.3
PM10 -45.8
PM2.5 7.3
PM10 -57.6
PM2.5 11.8
PM10 -43.3
PM2.5 20.2
PM10 -43.2
PM2.5 11.6
28.9 -44.0 49.7
12.5 51.6 76.2
47.2 -46.1 48.6
17.8 36.8 61.6
59.8 -47.2 51.3
19.8 59.3 76.5
49.5 -34.9 45.3
29.0 137.5 154.9
46.3 -43.1 48.7
19.8 71.3 92.3
Table 9. Same table 8 but it is after applied MOS. Statistical measure
SBJ
Bias (µg m-3) Gross error (µg m-3) Normalized Bias (%) Normalized Gross error (%)
STA
SJL
CRB
Total
PM10 0.2
PM2.5 0.09
PM10 0.01
PM2.5 0.05
PM10 -0.02
PM2.5 -0.04
PM10 0.4
PM2.5 7.3
PM10 0.2
PM2.5 1.8
5.2 1.7 9.2
2.1 2.3 11.2
10.2 2.0 11.0
5.1 4.0 15.3
14.3 2.4 12.7
6.9 6.3 20.8
20.3 6.3 20.8
9.9 28.2 33.9
12.5 3.1 13.4
6.0 7.3 10.1
Figure 7 shows comparisons of the simulated and observed air temperature at 2 meter, relative humidity and wind speed at the Campo de Marte (CDM) meteorological station in April 2016. The simulated diurnal variations of temperature and relative humidity are in good agreement with the observations. The model also generally reproduces the wind
velocity compared with observations, but over-estimation of the wind speed during the daytime in April 2016. No precipitation during the simulation period was observed and also zero precipitation was simulated in the WRF-Chem model.
predicted observed
28
Temperature (°C)
26 24 22 20 18 1
5
9
13
Day 17
10138
21
25
29
International Journal of Applied Engineering Research ISSN 0973-4562 Volume 13, Number 11 (2018) pp. 10129-10141 © Research India Publications. http://www.ripublication.com
Relative humidity (%)
95 85 75 65
predicted observed
55 1
5
9
13
predicted
8
observed
Wind Speed (m s-1)
10
Day
17
21
25
29
6 4 2 0
Day 17 21 25 29 Figure 7. Temporal variations of simulated (blue line) and observed (red line) meteorological fields including near-surface (a) temperature, (b) relative humidity, and (c) wind speed at the Campo de Marte meteorological station in April 2016. 1
5
9
13
Table 10 also shows the performance evaluation for meteorological variables results of the WRF-Chem modeling on an hourly basis in terms of the statistical measures described above. For the whole period of April 2016 (case study of April 2016), the normalized bias was -0.6 and 1.1 for temperature and relative humidity, respectively, which indicate a good performance of WRF-Chem model. Table 10. Statistics of temperature and relative humidity from climatological station at Campo de Marte in Lima metropolitan area. Statistical measure
April 2016
Temperature Bias (°C)
-0.1
Normalized Bias (°C)
-0.6
Gross error (°C)
0.9
Normalized gross error (°C)
4.0
Relative humidity
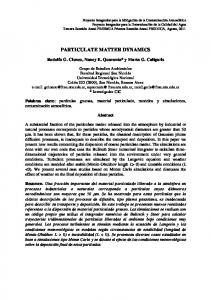
Figure 8. Spatial distribution of predicted PM2.5 concentrations (in µg m-3), for the modeling area at 1800 hour local on April 28, 2016
Bias (%)
0.8
Normalized Bias (%)
1.1
CONCLUSIONS
Gross error (%)
6.1
Normalized gross error (%)
0.1
It is observed that the concentrations of particles located in sites were more impacted by vehicular traffic such as STA, SJL, CRB stations were higher than the concentrations found in the residential area and with presence of trees (e.g., SBJ station). The hourly maximum 2016 PM10 concentration were highest 476.8 µg m-3 for STA and 564.4 µg m-3 for SJL. They were followed by lower concentration at the SBJ (394.1 µg m-3) and CRB (312.0 µg m-3. For PM2.5 the highest hourly maximum annual concentration of PM2.5are also presented at STA (179.1 µg m-3), SJL (164.1 µg m-3), CRB (189.2 µg m-3) and SBJ (103.8 µg m-3).
Figure 8 presents the PM2.5 concentrations at 1800 local hour on April 28, 2016 for the entire grid. The coast of Lima induces the sea-breeze circulations then the air pollution is transported to eastern (STA and SJL) and north (CRB) of Lima city.
10139
International Journal of Applied Engineering Research ISSN 0973-4562 Volume 13, Number 11 (2018) pp. 10129-10141 © Research India Publications. http://www.ripublication.com
It is important that the stations with the highest PM10 and PM2.5 concentration are located in the eastern and north part of the city of Lima (such as STA and SJL located at eastern and CRB located at north of Lima city). The simulated PM10 concentrations (uncorrected) were generally under-estimated when compared to measurements. This under- prediction of PM10 could be associated with an under- estimation on the PM10 vehicular emissions that are disregarded in this study. It also did not considere industrial and biogenic emission. In addition, predicted surface winds were more intense than those observed, leading to a dilution of aerosol particles in Lima. The application of the MOS methodology in air quality forecast in Lima, for the whole period (April 2016) and considering all air quality network (SBJ, STA, SJL and CRB), increases the accuracy with mean error bias, mean gross error, normalized mean bias and mean normalized gross error for PM10 from -43.2 µg m-3, 46.3 µg m-3, -43.1% and 48.7% to 0.2 µg m-3, 12.5 µg m-3, 3.1% and 13.4% respectively. That statistical evaluations for PM2.5 are from 11.6 µg/m3, 19.8 µg/m3, 71.3% and 92.3% to 1.8 µg/m3, 6.0 µg/m3, 7.3% and 10.1% respectively. The results showed that the modelling tool can be used to forecast air quality in Lima and to evaluate the impact of different meteorological conditions on the air quality. ACKNOWLEDGEMENTS The authors gratefully acknowledge Ing. Gabriela Rosas Benancio, Ing. Delia Acuña, Clara Oria Rojas, Ing. Raúl Rojas Cuba, Rulman Raphael Aliaga Martinez, Carlos Pardavé, Augusto Fernandez, José Luis Hinojosa and Rosalinda Aguirre for help with the measurement of air quality and meteorological variables. The first author also gratefully to Ing. Erick Concepcion Gamarra, General Wilar Gamarra Molina and Ing.Jhicenia Rivera Minaya for help with the installed an air quality network of SENAMHI in Lima and to Gerardo Jacome for help installed WRF-chem model. The work of Yang Liu was partially supported by the Hercules Exposome Research Center at Emory University. Gratefully to Ángel Vara-Vela and Mario Gavidia Calderón for their valuable support with emission model. Gratefully to Dr. Laura Gallardo for her comments to improve this manuscript. Research reported in this publication was partially supported by the Grant U01TW010107 (1/2 Regional GEOHealth hub centered in Peru) of National Institute of Health of United States (Program Fogarty).
REFERENCES [1] J. Seinfeld and S. Pandis, Atmospheric Chemistry and Physics: From Air Pollution to Climate Change., New York.: John Wiley & Sons., 2006.
[2] L. Baumann, C. Robinson, J. Combe, A. Gomez, K. G. R. Romero, L. Cabrera, N. Hansel, R. Wise, P. Breysse, K. Barnes, J. Hernandez and W. Checkley, "Effects of distance from a heavily transited avenue on asthma and atopy in a periurban shantytown in Lima, Peru.," Journal of Allergy and Clinical Immunology., vol. 127, no. 4, pp. 875-882, 2011. [3] A. Carbajal, B. A. R. Durand, H. Moreno, R. Espinoza, P. Chiarella and I. Romieu, "Impact of traffic flow on the asthma prevalence among school children in Lima, Peru.," Journal of Asthma, pp. 197-202., 2007. [4] K. Fisher, "Improving Sustainable Development in Lima Through Public Transportation Investment.," Perspectives on Business and Economics., vol. 35, no. 6, pp. 124-134, 2017. [5] IGN, «National Geographic Institute, Republic of Peru,» National Geographic Institute, Lima, 2014. [6] WPR., «World City Populations Population Review., 2018.
2018.,»
World
[7] J. Silva, J. Rojas, M. Norabuena, C. Molina, R. Toro and M. Leiva, "Particulate matter levels in a South American megacity: the metropolitan area of Lima-Callao, Peru.," Environmental Monitoring and Assessment, pp. 635-653, 2017. [8] R. Duarte, J. Matos, A. Paula, S. Lopes, G. Pereira, P. Vasconcellos, A. Gioda, R. Carreira, A. Silva, A. Duarte, P. Smichowski, N. Rojas and C. Sanchez, "Structural signatures of water-soluble organic aerosols in contrasting environments in South America and Western Europe.," Environ Pollut., pp. 513-525, 2017. [9] L. Gallardo, J. Escribano, L. Dawidowski, N. Rojas and M. Andrade, "Evaluation of vehicle emission inventories for carbon monoxide and nitrogen," Atmospheric Environment, pp. 12-19, 2012. [10] O. Sánchez and A. Ordoñez, "Evaluation of air quality in Metropolitan area of Lima 2015 (In Spanish).," National Service of Meteorology and Hydrology of Peru (SENAMHI), Ministry of the Environment (MINAM),, Lima, 2016. [11] G. Grell, S. Peckham, R. M. S. Schmitz, J. Wilczak and B. Eder, "Fully coupled online chemistry within the WRF model.," Atmospheric Environment , pp. 69576975, 2005. [12] A. Vara, M. Andrade, P. Kumar, R. Ynoue and A. Muñoz, "Impact of vehicular emissions on the formation of fine particles in the Sao Paulo Metropolitan Area: a numerical study with the WRF-Chem model," Atmospheric. Chemistry. Physics., pp. 777-797, 2016. [13] M. Andrade, R. Ynoue, E. Dias, T. E., A. Vara, S. Ibarra, L. Dropinchinski, J. Martins and V. Barreto, "Air quality forecasting system for southeastern Brazil," Frontiers in
10140
International Journal of Applied Engineering Research ISSN 0973-4562 Volume 13, Number 11 (2018) pp. 10129-10141 © Research India Publications. http://www.ripublication.com Environmental Sciences, pp. 1-14, 2015. [14] MTC, "Estimated National Vehicle Park, according to Department: 2007–2016. Lima, Peru.," MTC, Lima, 2016. [15] INEI, "National Institute of Statistics and Informatics, Lima, Peru. [WWW Document]. URL http://www.inei.gob.pe/ (accessed 01.29.2018).," National Institute of Statistics and Informatics, Lima, Perú., 2018. [16] Walsh. y Deuman., «Estudio de línea base ambiental COSAC I. Lima. (In Spanish),» PROTRANSPORTE, Lima, 2005. [17] D. Miller, C. MacDonald, T. Dye, K. Craig and A. D., "AQMOS: AIR QUALITY MODEL OUTPUT STATISTICS FROM CMAQ MODEL FORECASTS," in Presented at the 9th Annual CMAS Conference, Chapel Hill, NC., Petaluma, CA, USA., 2010. [18] D. Wilkis, Statistical Methods in the Atmospheric Sciences, Printed in the United States of America: Academic Press, 2006. [19] H. Glahn and D. Lowry, "The use of model Output statistics (MOS) in objetive weather forecasting.," Journal of applied meteorology, pp. 1203-1211, 1972. [20] G. Carter, J. Dallavalle y H. Glahn, «Statistical forecasts based on the National Meteorological Center’s numerical weather prediction system.,» Weather and Forecasting, pp. 401-412, 1989. [21] S. Dennstaedt, "Model Output Statistics Provide Essential Data for Small Airports. The Front. NOAA’s National Weather Service Volume 6, Number 2," NOAA’s National Weather Service, vol. 6, no. 2, pp. 111, 2008. [22] J. Chang, P. Middleton, W. Stockwell, C. Walcek, J. Pleim, H. Lansford, M. Sasha, F. Binkowski, N. Seaman and D. Stauffer, "The Regional Acid Deposition Model and Engineering Model.," in Acid Deposition: State of Science and Technology, Washington, DC, USA., 1989. [23] B. Schell, I. Ackerman, H. Hass, F. Binkowski and A. Ebel, "Modelling the formation of secondary organic aerosol within a comprehensive air quality model system," JOURNAL OF GEOPHYSICAL RESEARCH, pp. 28,275-28,293, 2001.
[26] O. Sánchez, L. Droprinchinski, R. Ynoue y M. Andrade, «The impact on tropospheric ozone formation on the implementation of a program for mobile emissions control: a case study in São Paulo, Brazil,» Environmental Fluid Mechanics, p. 95–119, 2007. [27] M. Gao, G. Carmichael, Y. Wang, P. Saide, M. Yu, J. Xin and Z. Wang, "Modeling study of the 2010 regional haze event in the North China Plain.," Atmos. Chem. Phys, p. 1673–1691, 2016. [28] J. Lents, N. Davis, N. Nikkila y M. Osses, «Lima Vehicle Activity Study,» Lima, 2004. [29] T. Feng, G. Li, J. Cao, N. Bei, Z. Shen, W. Zhou, S. Liu, T. Zhang, Y. Wang, R. Huang, X. Tie and T. Molina, "Simulations of organic aerosol concentrations during Springtime in the Guazhong Basin, China.," Atmos. Chem. Phys, pp. 10045-10061, 2016. [30] C. Seigneur, B. Pun, P. Pai, J. Louis, P. Solomon, C. Emery, R. Morris, M. Zahniser, D. Worsnop, P. Koutrakis, W. W. and I. Tombach, "Guidance for the performance evaluation of three-dimensional air quality modeling systems for particulate matter and visibility.," Journal of the Air & Waste Management Association , pp. 588- 599, 2000. [31] USEPA, "Guidance on the use of models and other analyses in attainment demonstrations for the 8-hour ozone NAAQS, EPA-454/R-05–002,," US Environmental Protection Agency, (accessed in Juanuary 2018) 2005. [32] C. Robinson, B. L. R. Gilman, K. Romero, J. Combe, L. Cabrera, N. Hansel, K. Barnes, G. Gonzalvez, R. Wise, P. Breysse and W. Checkley, "The Peru Urban versus Rural Asthma (PURA) Study: methods and baseline quality control data from a cross-sectional investigation into the prevalence, severity, genetics, immunology and environmental factors affecting asthma in adolescence in Peru," BMJ Open, pp. 1-13, 2012. [33] L. Underhill, S. Bose, D. Williams, K. Romero, G. Malpartida, P. Breysse, E. Klasen, J. Combe, W. Checkley and N. Hansel, "Association of Roadway Proximity with Indoor Air Pollution in a Peri-Urban Community in Lima, Peru.," International Journal of Environmental Research and Public Health, pp. 1346613481, 2015.
[24] P. Middleton, R. Stockwell and W. Carter, "Aggregation and analysis of volatile organic compound emissions for regional modeling," Atmospheric Environment. Part A. General Topics, pp. 1107-1133, 1990. [25] P. Middleton., W. Stockwell and W. Carter, "Aggregation and analysis of volatile organic compound emissions for regional modeling," Atmospheric Environment, pp. 1107-1133, 1990.
10141