Modeling the microstructure and elastic properties of complex materials
A. P. Roberts Centre for Microscopy and Microanalysis University of Queensland St. Lucia, Queensland 4072, Australia and
E.J. Garboczi Building and Fire Research Laboratory National Institute of Standards and Technology Gaithersburg, MD 20899 USA
Reprinted from MSM 2000 International Conference on Modeling and Simulation of Microsystems. Proceedings. Applied Computational Research Society. March 27-29,2000, San Diego, CA, 27-29 pp, 2000.
NOTE:
This paper is a contribution of the National Institute of Standards and Technology and is not subject to copyright.
...-..._ _ ___ _ I
. . .._ls_
.
.-
Modeling the microstructure and elastic properties of complex materials I
A. P. Roberts*>+ and E. .J. Garboczi* *Building Materials Division, National Institute of Standards and Technology, Gaithersburg, MD 20899, USA,
[email protected] +Centre for Microscopy and Microanalysis, University of Queensland, St. Liicia, Qiieensland 4072, Austxalia, ant,hony.roberts43mailbox.uq.ed11.a11
ABSTRACT The finite element method is used t o study the influence of porosity and pore shape on t,he elastic properties of model porous media. The Young’s modulus of each model was found to be practically independent of the solid Poisson’s ratio. The result,s are in good agreement with experimental data. We provide simple formulae that can be used to predict the elastic properties of porous media, and allow the accurate intcrprctation of empirical data in terms of pore shape and structure.
Keywords: elastic moduli, finite-element method, porous media, ceramics, foams, random materials.
1
Introduction
Materials with complex microstructurc arise in a wide range of applications. Materials include ceramics, foamed solids, aerogels, polymer blends, and artificial bone [1]-[3] If a material is to be synthesized for a particular purpose, it is important, to understand t,he relationship between microstructure and the target property. Generally, theoretical relationships only account for porosity, although the shape and nature (c.g. conncctivity) of the the porosity and solid phase are known to be critical. In this study, we use the finite element method t o study the relationship between microstructure and the bulk elastic properties of a wide range of realistic porous models. There have been several different approaches to deriving property-porosity relations for random porous materials. Formulae derived using the micro-mechanacs method [4] are essentially various methods of approximately extending cxact results for small fractions of spherical pores to higher porosities. A drawback of this approach is that the microstructure corresponding to a particular formula is not precisely known; hence agreement or disagreement, with data can neither confirm nor reject a particular model. A second class of models, based on periodic microstructures (for example arrays of spheres or repeated cell-units), arc often too simple to mimic the complex microstructures found iri real materials. Finally, there do exist, rigorous theories based on microstruct,ural inputs [3], but the information required to evaluate the results is generally difficult t o obtain. The most, promising results in this class are variational
bounds [I],[3]. Another approach is to computationally solve the equations of elasticity for digital models of microstructure [5]. In principle this can be done exactly. However, large statistical variations and insufficient resoliition have limited the accuracy of results obtained t,o date. Only recently have computers been able to handle the large 3-D models and number of computations needed t o obtain reasonable results. As input t o the method, we employ nine different microstructural models that broadly cover the types of morphology observcd in porous materials. The resuks, which can be expressed simply by two parameter relations, correspond to a particular microstructure and explicitly show how the properties depend on the nature of the porosity. Therefore, the results can be used as a predictive tool for cases where the microstructure of the material is similar to one of the models, and as an interprctive tool if the microstructure is unknown.
2
Results and discussion
The models we consider are depicted in Fig. 1. The models are digitized on grids of a sufficiently high resolution to capture the important details of the model. This study is limited t o grids of linear dimension M 5 128 (ie. M 3 x 2 x lo6 pixels). The finite element method (FEM) uses a variational formulation of the linear elastic equations, and finds the solution by minimizing the elastic energy via a fast, conjugate gradient method. A strain is applied, with the average stress or the average elastic energy giving the effective elastic moduli 111, [3]. Details of the theory and programs used arc report,ed in Ref. [ 5 ] . The actual programs are available a t http://ciks. cht.nist.gov/garboczz/, Part I1 Chapter 2. Results for t,he “Boolean” models (overlapping solid sphere, spherical pores and ellipsoidal pores) are shown in Fig. 2. Each symbol represents t,he average over five different samples to reduce statistical errors in the results. We study the models for reduced densities p = p/ps > 0.5, where p and ps are the density of the porous media and solid matrix respectively. It becomes iricreasingly difficult to make accurate measurements a t low densities as the properties depend more and more on thin connections which are difficult to accurately resolve. The density range we study encompasses most
1
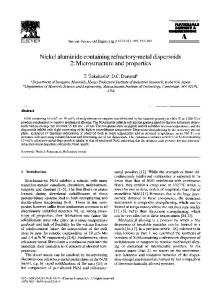
Figure 1: The model microstructures. (a) overlapping solid spheres, (b) overlapping spherical pores, (c) overlapping ellipsoidal pores, (d) open-cell Voronoi tessellation, (e) closed-cell Voronoi tessellation, (f) open-cell node-bond model, (g) open-cell node-bond model, (h) open-cell level-cut, Gaussian random field, and (i) closed-cell level-cut, Gaussian random field. The Boolean models (a -c) are discussed in Refs. [3], [6] and the Voronoi tessellation (d -e) is reviewed by Stoyan et al [6]. The node-bond models (f-g) will be described in a forthcoming paper [7] and t,he details of the level-cut Gaussian random field scheme we use is reported in Ref. [a]
-
. i
.u
I
I
. W"
. u)
H.S. Bound
0.5
.
W
w
W
_-- _ -
0.0
I
0.4
I
0.6 0.8 Reduced density
1
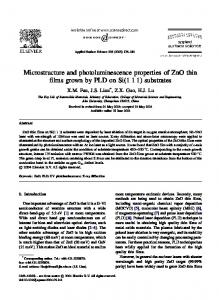
Figure 2: The You~ig'smodulus of tlic Boolean ~riodels sliowri iri Fig. 1. Tlic alIriost overlapping sy~iibolsat each point correspond to different solid Poisson's ratios. The dotted line is the Hashiri-SlitrikrriaIi upper-bouiid [l]for isotropic media.
0.02
0.05
; 0.4
I
I
0.6 0.8 Reduced density
~
sintered ceraIriics? with which we compare our results below. The density depeIideIice of the Young's modulus can be fitted with the equation -
Po))m
1
0.02
0.05 0.10 Reduced density
0.20
0.50
I 1
Figure 3: Experimental data for porous alumina conipared with the overlapping spherical pore (~ -, Fig. l b ) and solid sphere Iiiodels (- --:Fig. l a ) .
E/Es = ( ( P - Po)/(l
0.5
Figure 4: The Yourig's iiiodulus of the cellular rriodels shown iri Figs. l ( d - ~ i )Tlic . solid arid dashed lilies corresporid to the cnipirical fits given in Table 1.
0.01 0.0
0.1 0.2 Reduceddensity
(1)
where and 'rri are reported in Table 1. Here E (E,) is the Young's modulus of the porous riiediurri (solid matrix). Note that rri arid po are e~ripiricalcorrelation parameters and should not be interpreted as tlie percolation exponent arid threshold, respectively. The FEM results shown iu the figure took approximately four thousand hours to compute on current high-end workstations. 111 Figure 3 we compare the results to expeririieiital data for porous alurriiria [9]:[lo]. Most of the data falls
Figure 5: Experimental data for open- (0) and closedcell (A) cellular solids compared with the FEM results for open- (- -. Fig. Id) arid closed-cell (--. Fig. le) Voronoi tessellations. ~
close to the line for overlapping solid spheres (Fig. la). h4aIly of these ceramics are synthesized by sintering a ceramic powder: consistent with the model microstructure. The additional data [9] are for a material made with a particulate filler, which should give a Iriicrostructure similar to that observed in the overlapping spherical pore model (Fig. lb). The FER4 result for this model is seen to agree well with the data. %'e have also studied the properties of six differerit models of cellular solids [2]. At high densities the data caii be described by Eq. (1) with the parameters reported in Table 1. The density range where Eq. (1) reriiains accurate is also given. Since cellular solids can have extremely low densities (e.g. p NN 0.01 for opencell materials) , it is necessary to obtain results at lower densities. For each of the models the FEM results appear to adopt a linear behaviour on a log-log graph as
/'
+ (1.
l l l ~ l l ~ ' 2 l f , l l l $i!l, ( ~ ( ~ l l ~ ' ( ' l l t , l ( J l lS(~?illll$!, 2l~ 111 Of
I,ll(:
101-
111 [2] E / E S CJ)".T l l ~I,iiraIil(:t,c:rs C a~itl' 1 1 . arid t,li(! applicxble tlwsity raligc:. arc giwn for each of i,he (:diilar rriod(:ls in Table 1. 111 Fig. 5 we co~riparc:sel(:ct,otl FEM results for i h ! c:cllular ~iiodt:lswith experim:ut,al data. Tlic! Yor1rig;'s ~~iodulus of closed-cell foarried glass [I11agrees well with rwults for the c:losc:d-cc:ll Voronoi tesselation (Fig. lc). hforeover, rriicmgraplis of the glass [ 1I] show a structure siuiilar l,o that, of the r~iodel. Data for opt:~i-cc:ll materials [a] sliow c:oiisideraMc scatter. h i t appear to be reasonably well Iiiodelled by tlie operi-cell C'oronoi tessellatioii (Fig. Id). We have also studied tlie irifluerice of solid Poisson's ratio v, 0 1 1 the Yourig's Iiiotlulus. The Young's modiilus at v, = [- O.l,O.O 0.41 is plotted in Fig. 2. a t a given density the results are practically iridisti~iguislial~le, iIidicatiIig that E is nearly iiidepeIident of v s . Tlierefore, tlie empirical forrnulae given in Table 1 can h: app1it:d to solids with arbitrary PoissoIi's ratios. Exact calculations for the modulus of a matrix cout,aiIiiIig dilute spherical pores [I] actually show a s~rialldept:ritleuce OII v,., indicating that the result, is only approxiiiiatkly true. Tlie models we have coilsidered above are qualitatively similar to the microstructures observed iii real composites. However, it is also iriiportant to c3stal)lisli a yuaiititative link with experirrieIita1 cliarac:t,erieatiori data. This may be done by tuiiing tlie parauieters of a 3-D model so that its statistical iiiicrostructure properties Iriatcli those of a 2-D micrograph. As an example, we sliow a porous tungsten matrix aiid its 3-D statistical reconstruction iii Fig. 6 (tlie details are given in Ref. [SI). The finite-element code is theii used to measure the YouIig's modulus of the model giving E/E,=0.57 (where we have used a solid Poisson's ratio of v = 0.28). This compares well with the experimeiital value of E/E,=0.59. The process of Irieasuriiig the statistical properties of a given material, generating a corresponding iiiodel, arid riieasuriIig its properties is time intensive. It is expected that future research will make tlie irietliod more efficieut. We have derived eiriprical finite-element theories that explicity show tlie coiinectiori between density, microstructure, arid the Young's modulus of corriplex porous materials. Tlie results 11iay be used to predict tlie properties of porous materials, or accurately interpret experi~nentalrrieasurerrients. The results will be described in greater detail iIi a forthco~~ii~ig publication (71.
REFERENCES [l] Z. Hasliiii: J. Appl. Me&. 50: 481 (1983). solids: [2] L. J. Gibson aiid M. F. .4sliby: Cdl~ular~ Structure und properfies (Pergamon Press, Oxford, 1988). [3]'S. Toryuato, Appl. h4ech. Rev. 44, 37 (1991).
Figure 6: -4 two tliIiierisiorial image (left) of a tuiigsteri matrix [la] (the I h c k regions represent pores). .4 3-D model which shares statistical properties with the experiuiental image [8]. Table 1: For low deiisities ( p < ullax) the firiite-eIemeut data can be described by E / E , = Cp". At high derisities ( p > pllIlax) the relation E / E , = [(p-po)/(l -po)lrn is used. Thr: parameters correspond to the rriodels listcd iii the first colu~ri~i.
Til -
2.0 1.2 1.8 1.3 3.2, 1.5
0.93 0.50 0.56 0.30 0.54 0.35 0.38 0.25 4.2 10.20 0.69 0.20
.
2.23 1.65 2.35 2.12 1.19 4.27 2.80 2.15 1.54 __
PO
0.652 0.818 0.798 -0.0056 -0.196 -0.445 -0.198 0.029 -0.121
0.04 0.25 0.10
0.05 0.15
Cliristerisen, Me( York, 1979). [5] E. J. Garboczi arid -4.R. Day, J. Mech. Phys. Solids 43, 1349 (1995). [GI D. Stoyayalil b-.S. Kexidall, and J. Mecke, Stucliustic geometiy uiid its upplicutioiis, 21id ed. (Wiley, Chichester, 1995). [7] .4. P. Roberts and E. J. Garbocei (u~ipublislied). [8] .4.P. Roberts and E. J. Garboczi, J. h4ech. Phys. Solids 47, 2029 (1999). [9] R. L. Coble and U'.D. Kingery, J. h i . Ceraui. Soc. 39, 377 (1956). [lo] F. P. Kiiudsen, J. .4rri. Cerarii. SOC.45, 94 (1962). [Ill J. G. Zwissler arid M. A . 24da11is,in F7.uctui.e Mechanics of Ceiurriics, edited by R. C. Bradt, A. G. Evans, D. P. H. Hasselriiaii: axid F. F. LaIige (PleiiuIri Press: New York, 1983): Vol. 6, pp. 211241. [12] S. Umekawa. R. Kotfila, arid 0. D. Slierby. J. Mech. Pliys. Solids 13, 229 (1965). r d s (Wiley, Sew